Races in Mastic Beach, New York (NY) Detailed Stats
Data:
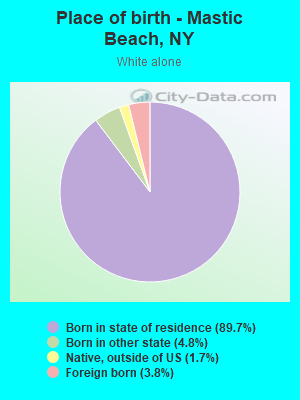
Races - White alone (%)
Races - White alone (% change since 2000)
Races - Black alone (%)
Races - Black alone (% change since 2000)
Races - American Indian alone (%)
Races - American Indian alone (% change since 2000)
Races - Asian alone (%)
Races - Asian alone (% change since 2000)
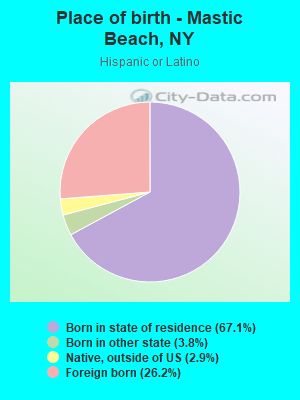
Races - Hispanic (%)
Races - Hispanic (% change since 2000)
Races - Native Hawaiian and Other Pacific Islander alone (%)
Races - Native Hawaiian and Other Pacific Islander alone (% change since 2000)
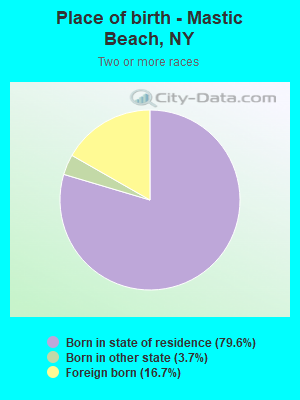
Races - Two or more races(%)
Races - Two or more races(% change since 2000)
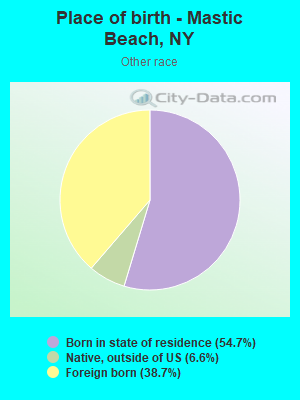
Races - Other race alone (%)
Races - Other race alone (% change since 2000)
Racial diversity
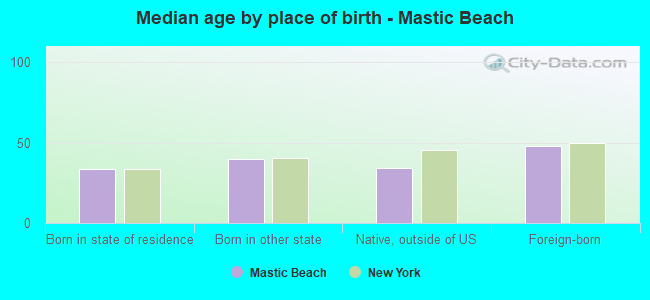
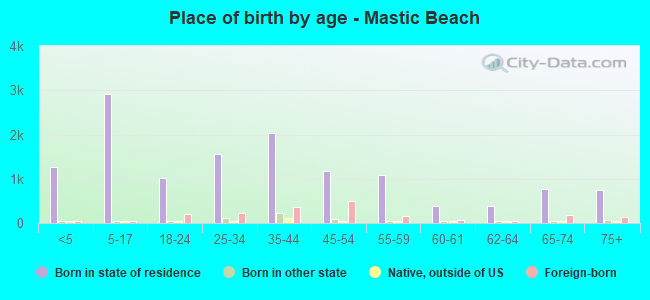
Place of birth - Born in state of residence (%)
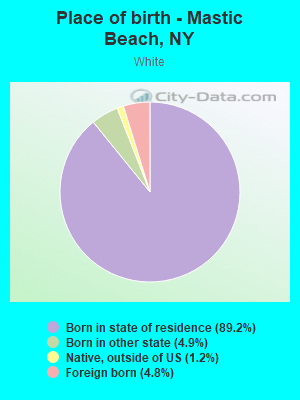
Place of birth - Born in state of residence (%) - White
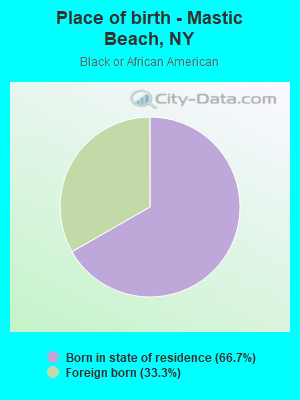
Place of birth - Born in state of residence (%) - Black or African American
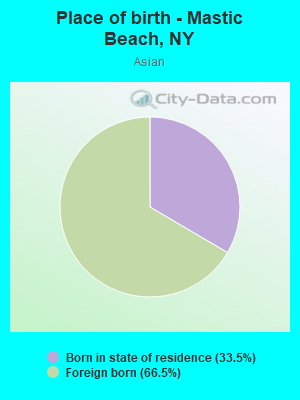
Place of birth - Born in state of residence (%) - Asian
Place of birth - Born in state of residence (%) - Hispanic or Latino
Place of birth - Born in state of residence (%) - American Indian and Alaska Native
Place of birth - Born in state of residence (%) - Multirace
Place of birth - Born in state of residence (%) - Other Race
Place of birth - Born in other state (%)
Place of birth - Born in other state (%) - White
Place of birth - Born in other state (%) - Black or African American
Place of birth - Born in other state (%) - Asian
Place of birth - Born in other state (%) - Hispanic or Latino
Place of birth - Born in other state (%) - American Indian and Alaska Native
Place of birth - Born in other state (%) - Multirace
Place of birth - Born in other state (%) - Other Race
Place of birth - Native, outside of US (%)
Place of birth - Native, outside of US (%) - White
Place of birth - Native, outside of US (%) - Black or African American
Place of birth - Native, outside of US (%) - Asian
Place of birth - Native, outside of US (%) - Hispanic or Latino
Place of birth - Native, outside of US (%) - American Indian and Alaska Native
Place of birth - Native, outside of US (%) - Multirace
Place of birth - Native, outside of US (%) - Other Race
Place of birth - Foreign born (%)
Place of birth - Foreign born (%) - White
Place of birth - Foreign born (%) - Black or African American
Place of birth - Foreign born (%) - Asian
Place of birth - Foreign born (%) - Hispanic or Latino
Place of birth - Foreign born (%) - American Indian and Alaska Native
Place of birth - Foreign born (%) - Multirace
Place of birth - Foreign born (%) - Other Race
Residents speaking English at home (%)
Residents speaking English at home - Born in the United States (%)
Residents speaking English at home - Native, born elsewhere (%)
Residents speaking English at home - Foreign born (%)
Residents speaking Spanish at home (%)
Residents speaking Spanish at home - Born in the United States (%)
Residents speaking Spanish at home - Native, born elsewhere (%)
Residents speaking Spanish at home - Foreign born (%)
Residents speaking other language at home (%)
Residents speaking other language at home - Born in the United States (%)
Residents speaking other language at home - Native, born elsewhere (%)
Residents speaking other language at home - Foreign born (%)
Marital status - Never married (%)
Marital status - Now married (%)
Marital status - Separated (%)
Marital status - Widowed (%)
Marital status - Divorced (%)
Ancestries Reported - Arab (%)
Ancestries Reported - Czech (%)
Ancestries Reported - Danish (%)
Ancestries Reported - Dutch (%)
Ancestries Reported - English (%)
Ancestries Reported - French (%)
Ancestries Reported - French Canadian (%)
Ancestries Reported - German (%)
Ancestries Reported - Greek (%)
Ancestries Reported - Hungarian (%)
Ancestries Reported - Irish (%)
Ancestries Reported - Italian (%)
Ancestries Reported - Lithuanian (%)
Ancestries Reported - Norwegian (%)
Ancestries Reported - Polish (%)
Ancestries Reported - Portuguese (%)
Ancestries Reported - Russian (%)
Ancestries Reported - Scotch-Irish (%)
Ancestries Reported - Scottish (%)
Ancestries Reported - Slovak (%)
Ancestries Reported - Subsaharan African (%)
Ancestries Reported - Swedish (%)
Ancestries Reported - Swiss (%)
Ancestries Reported - Ukrainian (%)
Ancestries Reported - United States (%)
Ancestries Reported - Welsh (%)
Ancestries Reported - West Indian (%)
Ancestries Reported - Other (%)
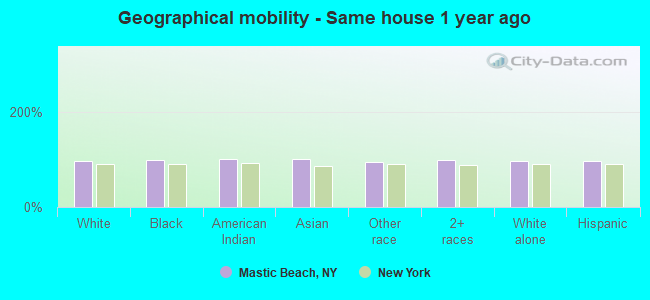
Geographical mobility - Same house 1 year ago (%)
Geographical mobility - Same house 1 year ago (%) - White
Geographical mobility - Same house 1 year ago (%) - Black or African American
Geographical mobility - Same house 1 year ago (%) - Asian
Geographical mobility - Same house 1 year ago (%) - Hispanic or Latino
Geographical mobility - Same house 1 year ago (%) - American Indian and Alaska Native
Geographical mobility - Same house 1 year ago (%) - Multirace
Geographical mobility - Same house 1 year ago (%) - Other Race
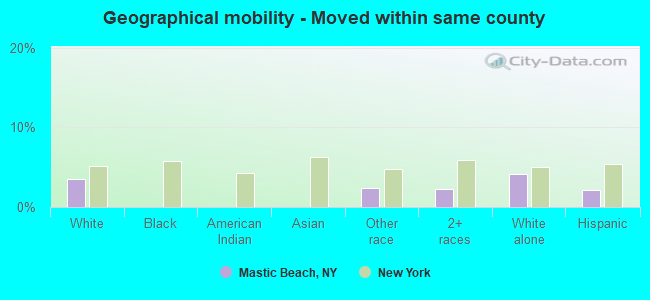
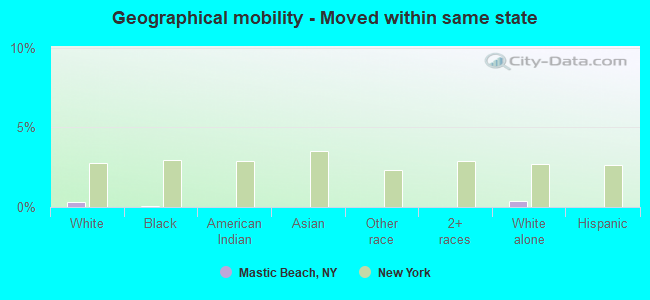
Geographical mobility - Moved within same county (%)
Geographical mobility - Moved within same county (%) - White
Geographical mobility - Moved within same county (%) - Black or African American
Geographical mobility - Moved within same county (%) - Asian
Geographical mobility - Moved within same county (%) - Hispanic or Latino
Geographical mobility - Moved within same county (%) - American Indian and Alaska Native
Geographical mobility - Moved within same county (%) - Multirace
Geographical mobility - Moved within same county (%) - Other Race
Geographical mobility - Moved from different county within same state (%)
Geographical mobility - Moved from different county within same state (%) - White
Geographical mobility - Moved from different county within same state (%) - Black or African American
Geographical mobility - Moved from different county within same state (%) - Asian
Geographical mobility - Moved from different county within same state (%) - Hispanic or Latino
Geographical mobility - Moved from different county within same state (%) - American Indian and Alaska Native
Geographical mobility - Moved from different county within same state (%) - Multirace
Geographical mobility - Moved from different county within same state (%) - Other Race
Geographical mobility - Moved from different state (%)
Geographical mobility - Moved from different state (%) - White
Geographical mobility - Moved from different state (%) - Black or African American
Geographical mobility - Moved from different state (%) - Asian
Geographical mobility - Moved from different state (%) - Hispanic or Latino
Geographical mobility - Moved from different state (%) - American Indian and Alaska Native
Geographical mobility - Moved from different state (%) - Multirace
Geographical mobility - Moved from different state (%) - Other Race
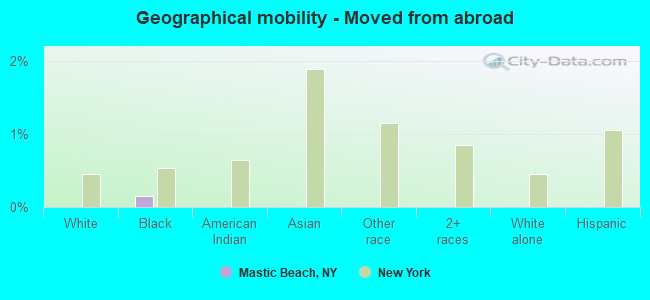
Geographical mobility - Moved from abroad (%)
Geographical mobility - Moved from abroad (%) - White
Geographical mobility - Moved from abroad (%) - Black or African American
Geographical mobility - Moved from abroad (%) - Asian
Geographical mobility - Moved from abroad (%) - Hispanic or Latino
Geographical mobility - Moved from abroad (%) - American Indian and Alaska Native
Geographical mobility - Moved from abroad (%) - Multirace
Geographical mobility - Moved from abroad (%) - Other Race
Place of birth for the foreign-born population - Ireland (%)
Place of birth for the foreign-born population - Denmark (%)
Place of birth for the foreign-born population - Norway (%)
Place of birth for the foreign-born population - Sweden (%)
Place of birth for the foreign-born population - United Kingdom (%)
Place of birth for the foreign-born population - England (%)
Place of birth for the foreign-born population - Scotland (%)
Place of birth for the foreign-born population - Other Northern Europe (%)
Place of birth for the foreign-born population - Austria (%)
Place of birth for the foreign-born population - Belgium (%)
Place of birth for the foreign-born population - France (%)
Place of birth for the foreign-born population - Germany (%)
Place of birth for the foreign-born population - Netherlands (%)
Place of birth for the foreign-born population - Switzerland (%)
Place of birth for the foreign-born population - Other Western Europe (%)
Place of birth for the foreign-born population - Greece (%)
Place of birth for the foreign-born population - Italy (%)
Place of birth for the foreign-born population - Portugal (%)
Place of birth for the foreign-born population - Spain (%)
Place of birth for the foreign-born population - Other Southern Europe (%)
Place of birth for the foreign-born population - Albania (%)
Place of birth for the foreign-born population - Belarus (%)
Place of birth for the foreign-born population - Bosnia and Herzegovina (%)
Place of birth for the foreign-born population - Bulgaria (%)
Place of birth for the foreign-born population - Croatia (%)
Place of birth for the foreign-born population - Czechoslovakia (%)
Place of birth for the foreign-born population - Hungary (%)
Place of birth for the foreign-born population - Latvia (%)
Place of birth for the foreign-born population - Lithuania (%)
Place of birth for the foreign-born population - North Macedonia (Macedonia) (%)
Place of birth for the foreign-born population - Moldova (%)
Place of birth for the foreign-born population - Poland (%)
Place of birth for the foreign-born population - Romania (%)
Place of birth for the foreign-born population - Russia (%)
Place of birth for the foreign-born population - Serbia (%)
Place of birth for the foreign-born population - Ukraine (%)
Place of birth for the foreign-born population - Other Eastern Europe (%)
Place of birth for the foreign-born population - China (%)
Place of birth for the foreign-born population - Hong Kong (%)
Place of birth for the foreign-born population - Taiwan (%)
Place of birth for the foreign-born population - Japan (%)
Place of birth for the foreign-born population - Korea (%)
Place of birth for the foreign-born population - Other Eastern Asia (%)
Place of birth for the foreign-born population - Afghanistan (%)
Place of birth for the foreign-born population - Bangladesh (%)
Place of birth for the foreign-born population - India (%)
Place of birth for the foreign-born population - Iran (%)
Place of birth for the foreign-born population - Kazakhstan (%)
Place of birth for the foreign-born population - Nepal (%)
Place of birth for the foreign-born population - Pakistan (%)
Place of birth for the foreign-born population - Sri Lanka (%)
Place of birth for the foreign-born population - Uzbekistan (%)
Place of birth for the foreign-born population - Other South Central Asia (%)
Place of birth for the foreign-born population - Burma (%)
Place of birth for the foreign-born population - Cambodia (%)
Place of birth for the foreign-born population - Indonesia (%)
Place of birth for the foreign-born population - Laos (%)
Place of birth for the foreign-born population - Malaysia (%)
Place of birth for the foreign-born population - Philippines (%)
Place of birth for the foreign-born population - Singapore (%)
Place of birth for the foreign-born population - Thailand (%)
Place of birth for the foreign-born population - Vietnam (%)
Place of birth for the foreign-born population - Other South Eastern Asia (%)
Place of birth for the foreign-born population - Armenia (%)
Place of birth for the foreign-born population - Iraq (%)
Place of birth for the foreign-born population - Israel (%)
Place of birth for the foreign-born population - Jordan (%)
Place of birth for the foreign-born population - Kuwait (%)
Place of birth for the foreign-born population - Lebanon (%)
Place of birth for the foreign-born population - Saudi Arabia (%)
Place of birth for the foreign-born population - Syria (%)
Place of birth for the foreign-born population - Turkey (%)
Place of birth for the foreign-born population - Yemen (%)
Place of birth for the foreign-born population - Other Western Asia (%)
Place of birth for the foreign-born population - Eritrea (%)
Place of birth for the foreign-born population - Ethiopia (%)
Place of birth for the foreign-born population - Kenya (%)
Place of birth for the foreign-born population - Somalia (%)
Place of birth for the foreign-born population - Uganda (%)
Place of birth for the foreign-born population - Zimbabwe (%)
Place of birth for the foreign-born population - Other Eastern Africa (%)
Place of birth for the foreign-born population - Cameroon (%)
Place of birth for the foreign-born population - Congo (%)
Place of birth for the foreign-born population - Democratic Republic of Congo (Zaire) (%)
Place of birth for the foreign-born population - Other Middle Africa (%)
Place of birth for the foreign-born population - Egypt (%)
Place of birth for the foreign-born population - Morocco (%)
Place of birth for the foreign-born population - Sudan (%)
Place of birth for the foreign-born population - Other Northern Africa (%)
Place of birth for the foreign-born population - South Africa (%)
Place of birth for the foreign-born population - Other Southern Africa (%)
Place of birth for the foreign-born population - Cabo Verde (%)
Place of birth for the foreign-born population - Ghana (%)
Place of birth for the foreign-born population - Liberia (%)
Place of birth for the foreign-born population - Nigeria (%)
Place of birth for the foreign-born population - Senegal (%)
Place of birth for the foreign-born population - Sierra Leone (%)
Place of birth for the foreign-born population - Other Western Africa (%)
Place of birth for the foreign-born population - Australia (%)
Place of birth for the foreign-born population - New Zealand (%)
Place of birth for the foreign-born population - Fiji (%)
Place of birth for the foreign-born population - Micronesia (%)
Place of birth for the foreign-born population - Bahamas (%)
Place of birth for the foreign-born population - Barbados (%)
Place of birth for the foreign-born population - Cuba (%)
Place of birth for the foreign-born population - Dominica (%)
Place of birth for the foreign-born population - Dominican Republic (%)
Place of birth for the foreign-born population - Grenada (%)
Place of birth for the foreign-born population - Haiti (%)
Place of birth for the foreign-born population - Jamaica (%)
Place of birth for the foreign-born population - St. Vincent and the Grenadines (%)
Place of birth for the foreign-born population - Trinidad and Tobago (%)
Place of birth for the foreign-born population - West Indies (%)
Place of birth for the foreign-born population - Other Caribbean (%)
Place of birth for the foreign-born population - Belize (%)
Place of birth for the foreign-born population - Costa Rica (%)
Place of birth for the foreign-born population - El Salvador (%)
Place of birth for the foreign-born population - Guatemala (%)
Place of birth for the foreign-born population - Honduras (%)
Place of birth for the foreign-born population - Mexico (%)
Place of birth for the foreign-born population - Nicaragua (%)
Place of birth for the foreign-born population - Panama (%)
Place of birth for the foreign-born population - Other Central America (%)
Place of birth for the foreign-born population - Argentina (%)
Place of birth for the foreign-born population - Bolivia (%)
Place of birth for the foreign-born population - Brazil (%)
Place of birth for the foreign-born population - Chile (%)
Place of birth for the foreign-born population - Colombia (%)
Place of birth for the foreign-born population - Ecuador (%)
Place of birth for the foreign-born population - Guyana (%)
Place of birth for the foreign-born population - Peru (%)
Place of birth for the foreign-born population - Uruguay (%)
Place of birth for the foreign-born population - Venezuela (%)
Place of birth for the foreign-born population - Other South America (%)
Place of birth for the foreign-born population - Canada (%)
Place of birth for the foreign-born population - Other Northern America (%)
Place of birth for the foreign-born population - Other (%)
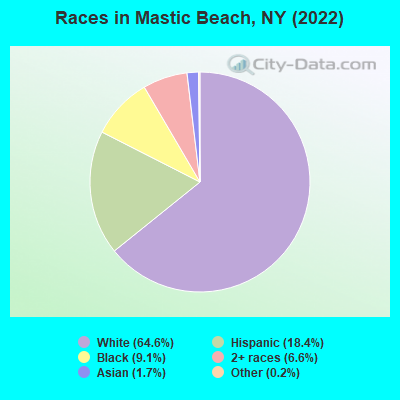
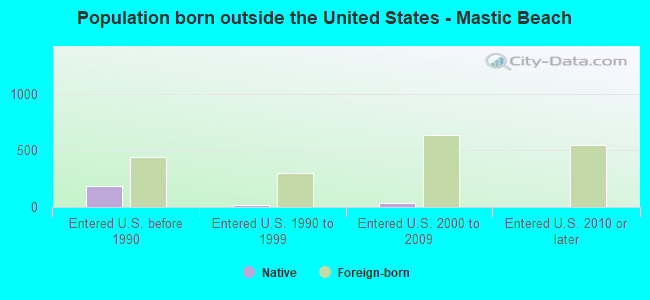
According to 2022 data, the most numerous races in Mastic Beach, NY are White alone (10,462 residents), Hispanic (2,981 residents), and Black alone (1,480 residents). 77.8% of Mastic Beach residents speak English at home. 10.9% of Mastic Beach, NY residents are foreign-born (4.8% born in Latin America, 2.4% born in Europe, 2.3% born in Asia, 1.5% born in Africa), which is 102.4% less than the foreign-born rate of 22.0% across the entire state of New York.
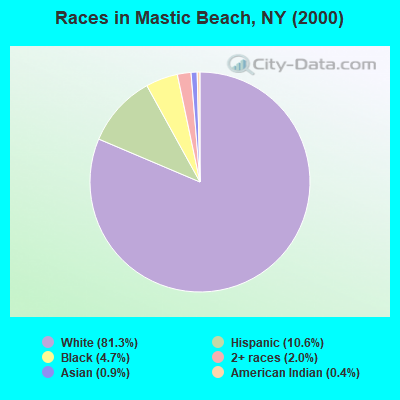
Race distribution in Mastic Beach
2000 2022
11,760,981 62.0% White alone 2,867,583 15.1% Hispanic 2,812,623 14.8% Black alone 1,035,926 5.5% Asian alone 366,116 1.9% Two or more races 75,499 0.4% Other race alone 52,499 0.3% American Indian alone 5,230 0.03% Native Hawaiian and Other
10,408,933 52.9% White alone 3,867,299 19.7% Hispanic 2,633,840 13.4% Black alone 1,776,286 9.0% Asian alone 732,670 3.7% Two or more races 216,110 1.1% Other race alone 35,082 0.2% American Indian alone 6,931 0.04% Native Hawaiian and Other
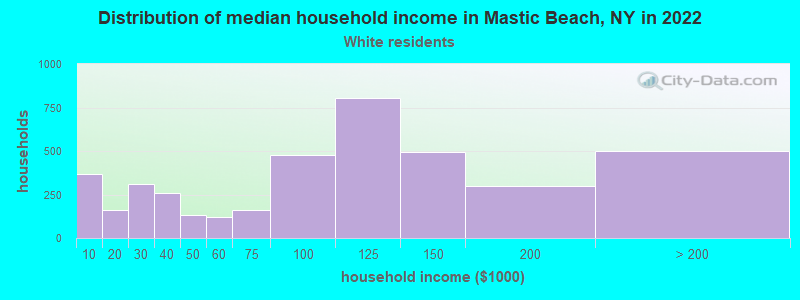
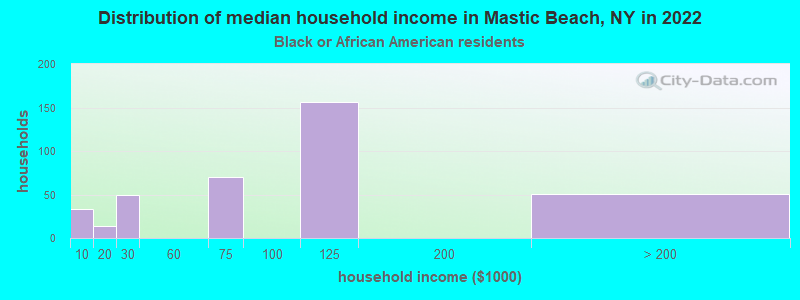
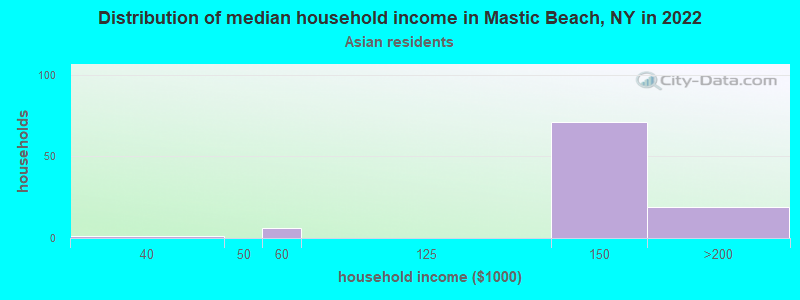
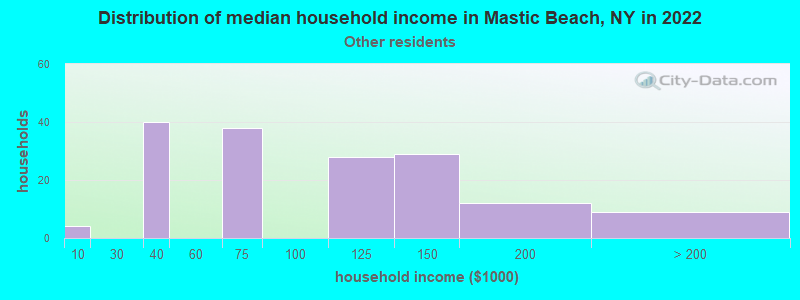
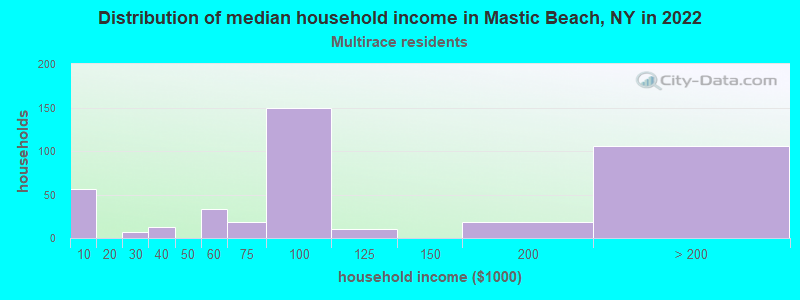
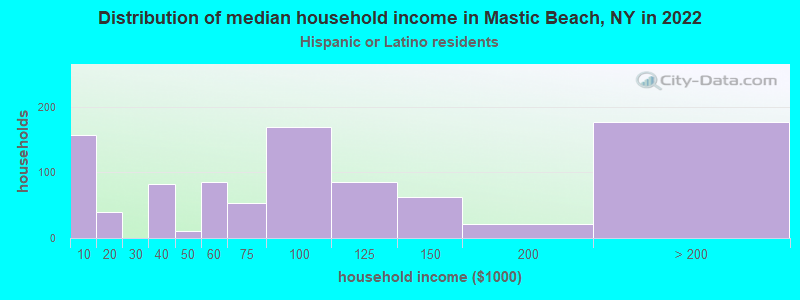
Income and house value in Mastic Beach Median household income in 2022 $102,150 White non-Hispanic householders$104,807 Black householders$131,489 Asian householders$100,781 Some other race householders$97,156 Two or more races householders$85,461 Hispanic or Latino race householdersMedian 2022 house value $337,200 White Non-Hispanic householders$385,127 Black or African American householders $385,127 Asian householders$350,893 Some other race householders$307,074 Two or more races householders$291,669 Hispanic or Latino householders
Median age by race in Mastic Beach
41.6 Median age for White residents43.6 41.5 26.1 Median age for Black or African American residents14.7 26.8 -748,832,865.7 Median age for American Indian / Alaska Native residents-807,017,543.1 -513,692,161.9 53.4 Median age for Asian residents52.8 54.2 -742,816,091.2 Median age for Native Hawaiian / Pacific Islander residents-831,187,409.8 -771,300,447.7 45.7 Median age for Other race residents46.4 47.0 20.8 Median age for Two or more races residents28.1 12.6 41.6 Median age for White alone residents42.8 40.7 38.8 Median age for Hispanic or Latino residents41.1 36.0
Owner/renter occupied households by race in Mastic Beach
House owners and renters - White residents 3,348 81.8% Owner occupied746 18.2% Renter occupiedHouse owners and renters - Black or African American residents 273 70.0% Owner occupied117 30.0% Renter occupiedHouse owners and renters - Asian residents 99 99.1% Owner occupied1 0.9% Renter occupiedHouse owners and renters - Other race residents 95 61.5% Owner occupied60 38.5% Renter occupiedHouse owners and renters - Two or more races residents 371 100.0% Owner occupiedHouse owners and renters - White alone residents 3,055 81.8% Owner occupied680 18.2% Renter occupiedHouse owners and renters - Hispanic or Latino residents 723 79.1% Owner occupied190 20.9% Renter occupied
Language usage in Mastic Beach
English speakers - Total 77.8% of residents of Mastic Beach speak English at home.
13.1% of residents speak Spanish at home 1,452 74.0% Speak English very well511 26.0% Speak English less than very well8.3% of residents speak other language at home 839 67.3% Speak English very well408 32.7% Speak English less than very well
English speakers - Born in the United States 85.2% of residents of Mastic Beach speak English at home.
12.0% of residents speak Spanish at home 77 100.0% Speak English very well2.0% of residents speak other language at home 13 100.0% Speak English very well
English speakers - Native, born elsewhere 72.5% of residents of Mastic Beach speak English at home.
28.3% of residents speak Spanish at home 28 40.0% Speak English very well42 60.0% Speak English less than very well
English speakers - Foreign-born 20.9% of residents of Mastic Beach speak English at home.
31.4% of residents speak Spanish at home 245 40.8% Speak English very well355 59.2% Speak English less than very well45.9% of residents speak other language at home 533 60.7% Speak English very well345 39.3% Speak English less than very well
White (Caucasian) - Speak only English Native:
90.8% (9,477)Foreign-born:
26.9% (149)
White (Caucasian) - Speak another language Native:
8.1% (845)Foreign-born:
72.2% (400)
Black or African American - Speak only English Native:
77.5% (682)Foreign-born:
13.2% (68)
Black or African American - Speak another language Native:
26.1% (230)Foreign-born:
78.7% (409)
Asian - Speak only English Native:
91.6% (80)Foreign-born:
25.1% (45)
Other race - Speak only English Native:
49.8% (133)Foreign-born:
21.5% (37)
Other race - Speak another language Native:
51.5% (137)Foreign-born:
75.4% (129)
Two or more races - Speak only English Native:
75.3% (817)Foreign-born:
32.0% (95)
Two or more races - Speak another language Native:
25.0% (271)Foreign-born:
65.4% (195)
White alone - Speak only English Native:
96.4% (9,128)Foreign-born:
25.0% (100)
White alone - Speak another language Native:
3.5% (336)Foreign-born:
75.0% (299)
Hispanic or Latino - Speak only English Native:
40.9% (803)Foreign-born:
19.0% (147)
Hispanic or Latino - Speak another language Native:
58.6% (1,151)Foreign-born:
79.8% (615)
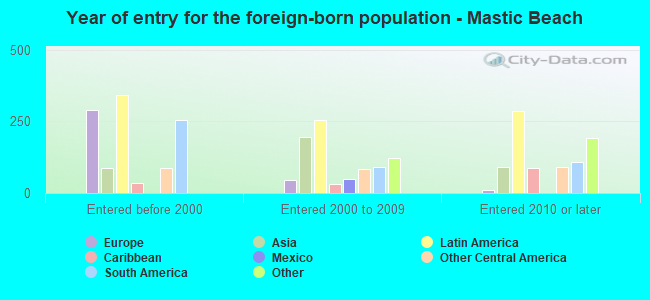
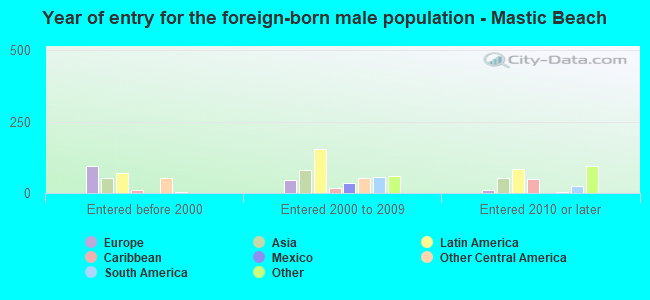
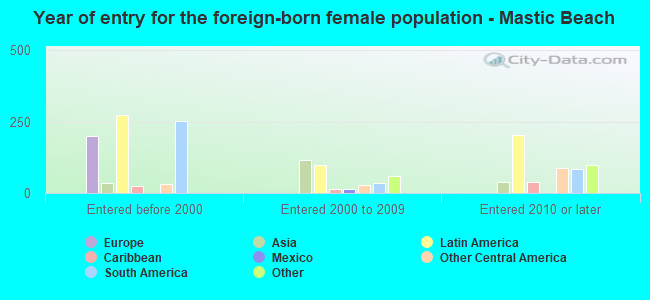
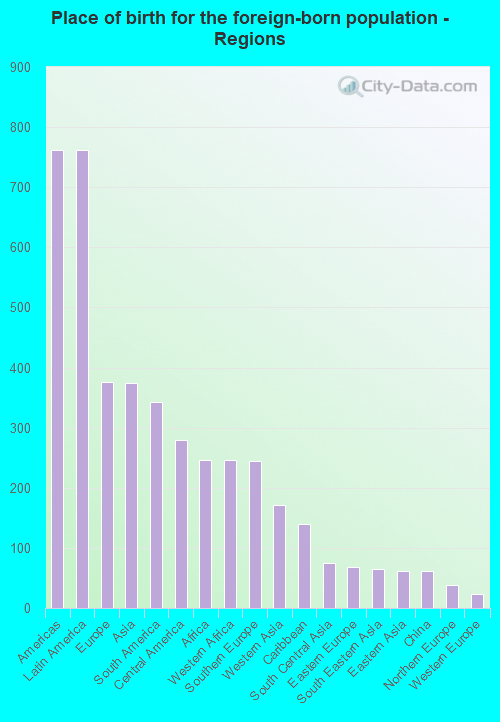
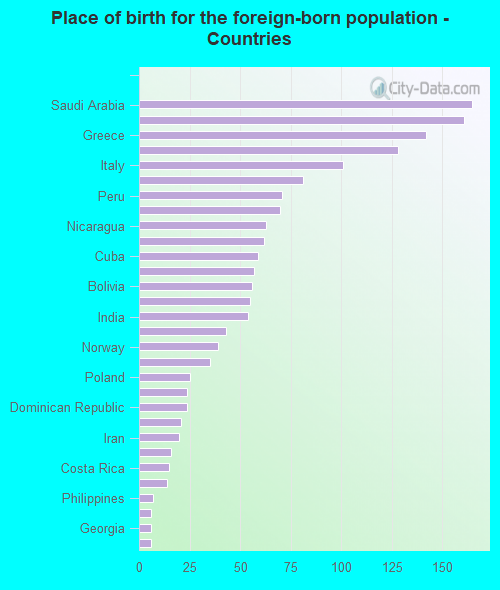
Foreign-born residents in Mastic Beach 1,761 residents are foreign born (4.8% Latin America , 2.4% Europe , 2.3% Asia , 1.5% Africa ).
This city:
10.9%New York:
22.6%
Marital status for residents in Mastic Beach Marital status - White (Caucasian) population 15 years and over
Males 36.0% Never married56.2% Now married1.3% Separated2.6% Widowed3.9% DivorcedFemales 30.0% Never married49.3% Now married0.7% Separated12.8% Widowed7.2% DivorcedWomen who gave birth in the past 12 months Now married:
100.0% (55)Unmarried:
0.0% (0)
Women who did not give birth in the past 12 months Now married:
51.1% (1,377)Unmarried:
48.9% (1,319)
Marital status - Black or African American population 15 years and over
Males 35.5% Never married56.2% Now married0.0% Separated0.0% Widowed8.3% DivorcedFemales 48.2% Never married39.6% Now married0.0% Separated0.0% Widowed12.3% DivorcedWomen who gave birth in the past 12 months Now married:
42.3% (41)Unmarried:
57.7% (56)
Women who did not give birth in the past 12 months Now married:
24.3% (80)Unmarried:
75.7% (251)
Marital status - Asian population 15 years and over
Males 31.0% Never married69.0% Now married0.0% Separated0.0% Widowed0.0% DivorcedFemales 0.0% Never married100.0% Now married0.0% Separated0.0% Widowed0.0% DivorcedWomen who did not give birth in the past 12 months Now married:
100.0% (9)Unmarried:
0.0% (0)
Marital status - Other race population 15 years and over
Males 45.5% Never married37.0% Now married0.0% Separated5.8% Widowed11.7% DivorcedFemales 42.4% Never married32.6% Now married0.0% Separated19.4% Widowed5.6% DivorcedWomen who did not give birth in the past 12 months Now married:
18.3% (22)Unmarried:
81.7% (98)
Marital status - Two or more races population 15 years and over
Males 44.3% Never married53.6% Now married0.0% Separated0.0% Widowed2.0% DivorcedFemales 40.7% Never married55.4% Now married0.0% Separated1.7% Widowed2.3% DivorcedWomen who did not give birth in the past 12 months Now married:
50.2% (212)Unmarried:
49.8% (211)
Marital status - White alone, not Hispanic / Latino population 15 years and over
Males 37.9% Never married53.0% Now married1.5% Separated3.1% Widowed4.5% DivorcedFemales 30.7% Never married47.0% Now married0.9% Separated15.0% Widowed6.5% DivorcedWomen who gave birth in the past 12 months Now married:
100.0% (29)Unmarried:
0.0% (0)
Women who did not give birth in the past 12 months Now married:
49.2% (1,177)Unmarried:
50.8% (1,214)
Marital status - Hispanic or Latino population 15 years and over
Males 28.5% Never married66.4% Now married0.0% Separated0.8% Widowed4.3% DivorcedFemales 24.4% Never married63.7% Now married0.0% Separated3.4% Widowed8.5% DivorcedWomen who gave birth in the past 12 months Now married:
100.0% (34)Unmarried:
0.0% (0)
Women who did not give birth in the past 12 months Now married:
61.8% (512)Unmarried:
38.2% (317)
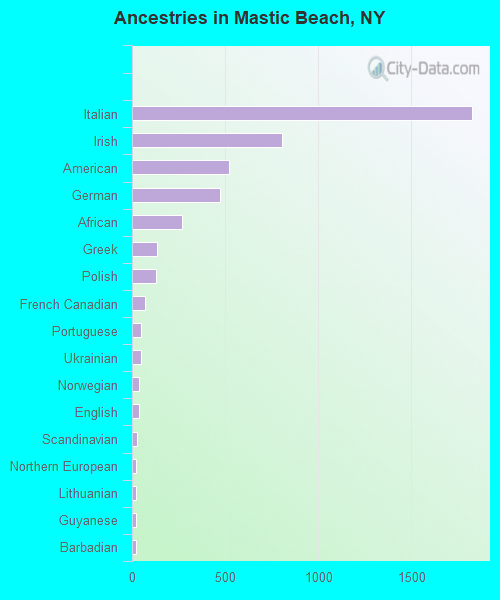
Ancestries in Mastic Beach
1,827 24.0% Italian805 10.6% Irish519 6.8% American471 6.2% German267 3.5% African135 1.8% Greek128 1.7% Polish71 0.9% French Canadian50 0.7% Portuguese50 0.7% Ukrainian40 0.5% Norwegian36 0.5% English27 0.4% Scandinavian23 0.3% Northern European22 0.3% Lithuanian20 0.3% Guyanese19 0.2% Barbadian13 0.2% Eastern European12 0.2% Scottish6 0.08% Czech6 0.08% Hungarian5 0.07% Russian2 0.03% Ghanaian1 0.01% South African
Children Nativity (place of birth) in Mastic Beach
Children under 6 years - Living with two parents Both parents native 741 100.0% NativeBoth parents foreign-born 139 100.0% NativeChildren under 6 years - Living with one parent Native parent 615 100.0% NativeChildren 6 to 17 years - Living with two parents Both parents native 878 100.0% Native0 0.0% Foreign-bornBoth parents foreign-born 501 96.7% Native17 3.3% Foreign-bornOne native, one foreign-born parent 45 100.0% NativeChildren 6 to 17 years - Living with one parent Native parent 1,154 100.0% NativeForeign-born parent 121 51.5% Native114 48.5% Foreign-born
Grandparents responsible for own grandchildren in Mastic Beach
Grandparents (30 to 59 years) White / Caucasian 13 10.9% Responsible for grandchildren108 89.1% Not responsible for grandchildrenOther race 9 100.0% Responsible for grandchildrenWhite alone, not Hispanic / Latino 13 10.5% Responsible for grandchildren110 89.5% Not responsible for grandchildrenHispanic or Latino 11 39.1% Responsible for grandchildren17 60.9% Not responsible for grandchildren
Grandparents (60 years and over) White / Caucasian 173 100.0% Not responsible for grandchildrenWhite alone, not Hispanic / Latino 172 100.0% Not responsible for grandchildrenHispanic or Latino 32 100.0% Not responsible for grandchildren