Races in Matagorda-Sargent, Texas (TX) Detailed Stats
Ancestries, Foreign-born residents, place of birth
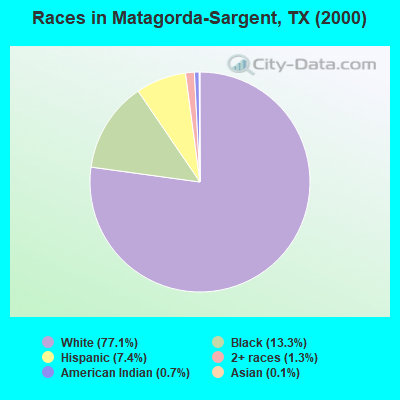
Race distribution in Matagorda-Sargent

- 2,57177.1%White alone
- 44213.3%Black alone
- 2487.4%Hispanic
- 421.3%Two or more races
- 250.7%American Indian alone
- 50.1%Asian alone
- 20.06%Other race alone
2000
2022
-
- 10,933,31352.4%White alone
- 6,669,66632.0%Hispanic
- 2,364,25511.3%Black alone
- 554,4452.7%Asian alone
- 230,5671.1%Two or more races
- 68,8590.3%American Indian alone
- 19,9580.10%Other race alone
- 10,7570.05%Native Hawaiian and Other
Pacific Islander alone

-
- 12,070,64240.2%Hispanic
- 11,683,43038.9%White alone
- 3,508,70611.7%Black alone
- 1,608,1735.4%Asian alone
- 956,5603.2%Two or more races
- 125,7630.4%Other race alone
- 47,0230.2%American Indian alone
- 29,2750.10%Native Hawaiian and Other
Pacific Islander alone

Income and house value in Matagorda-Sargent
- Median household income in 2022
- $61,740White non-Hispanic householders
- $31,537Black householders
- $51,993American Indian and Alaska Native householders
- $83,770Some other race householders
- $43,672Two or more races householders
- $63,212Hispanic or Latino race householders
- Median 2022 house value
- $198,592White Non-Hispanic householders
- $137,146Black or African American householders
- $68,731American Indian or Alaska Native householders
- $269,224Some other race householders
- $311,350Two or more races householders
- $142,530Hispanic or Latino householders
Household income for White non-Hispanic householders

Household income for Black householders

Household income for American Indian and Alaska Native householders

Household income for Two or more races householders

Household income for Hispanic or Latino race householders
