Races in Matawan, New Jersey (NJ) Detailed Stats
Data:
Races - White alone (%)
Races - White alone (% change since 2000)
Races - Black alone (%)
Races - Black alone (% change since 2000)
Races - American Indian alone (%)
Races - American Indian alone (% change since 2000)
Races - Asian alone (%)
Races - Asian alone (% change since 2000)
Races - Hispanic (%)
Races - Hispanic (% change since 2000)
Races - Native Hawaiian and Other Pacific Islander alone (%)
Races - Native Hawaiian and Other Pacific Islander alone (% change since 2000)
Races - Two or more races(%)
Races - Two or more races(% change since 2000)
Races - Other race alone (%)
Races - Other race alone (% change since 2000)
Racial diversity
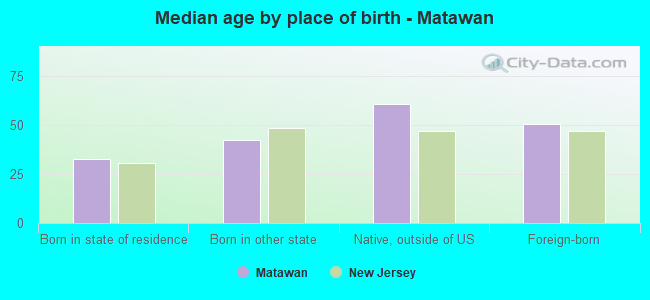
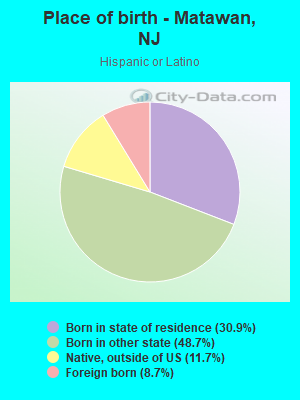
Place of birth - Born in state of residence (%)
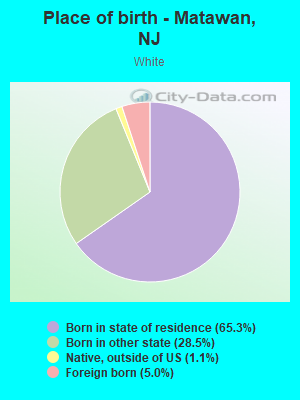
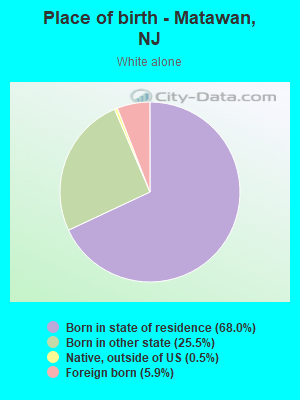
Place of birth - Born in state of residence (%) - White
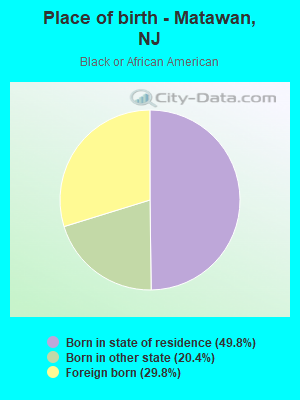
Place of birth - Born in state of residence (%) - Black or African American
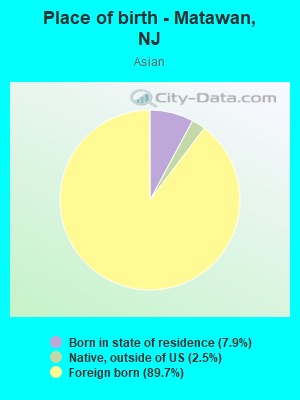
Place of birth - Born in state of residence (%) - Asian
Place of birth - Born in state of residence (%) - Hispanic or Latino
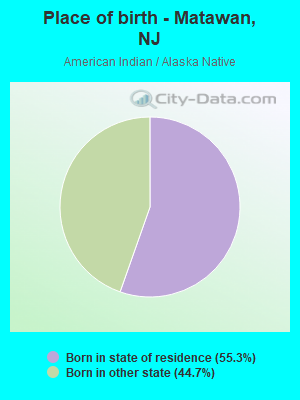
Place of birth - Born in state of residence (%) - American Indian and Alaska Native
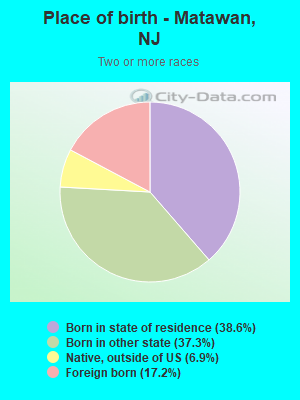
Place of birth - Born in state of residence (%) - Multirace
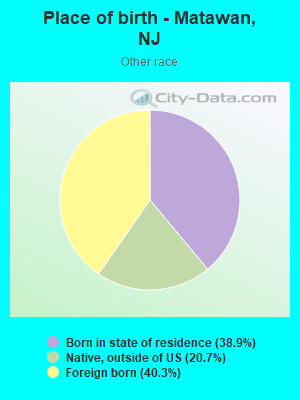
Place of birth - Born in state of residence (%) - Other Race
Place of birth - Born in other state (%)
Place of birth - Born in other state (%) - White
Place of birth - Born in other state (%) - Black or African American
Place of birth - Born in other state (%) - Asian
Place of birth - Born in other state (%) - Hispanic or Latino
Place of birth - Born in other state (%) - American Indian and Alaska Native
Place of birth - Born in other state (%) - Multirace
Place of birth - Born in other state (%) - Other Race
Place of birth - Native, outside of US (%)
Place of birth - Native, outside of US (%) - White
Place of birth - Native, outside of US (%) - Black or African American
Place of birth - Native, outside of US (%) - Asian
Place of birth - Native, outside of US (%) - Hispanic or Latino
Place of birth - Native, outside of US (%) - American Indian and Alaska Native
Place of birth - Native, outside of US (%) - Multirace
Place of birth - Native, outside of US (%) - Other Race
Place of birth - Foreign born (%)
Place of birth - Foreign born (%) - White
Place of birth - Foreign born (%) - Black or African American
Place of birth - Foreign born (%) - Asian
Place of birth - Foreign born (%) - Hispanic or Latino
Place of birth - Foreign born (%) - American Indian and Alaska Native
Place of birth - Foreign born (%) - Multirace
Place of birth - Foreign born (%) - Other Race
Residents speaking English at home (%)
Residents speaking English at home - Born in the United States (%)
Residents speaking English at home - Native, born elsewhere (%)
Residents speaking English at home - Foreign born (%)
Residents speaking Spanish at home (%)
Residents speaking Spanish at home - Born in the United States (%)
Residents speaking Spanish at home - Native, born elsewhere (%)
Residents speaking Spanish at home - Foreign born (%)
Residents speaking other language at home (%)
Residents speaking other language at home - Born in the United States (%)
Residents speaking other language at home - Native, born elsewhere (%)
Residents speaking other language at home - Foreign born (%)
Marital status - Never married (%)
Marital status - Now married (%)
Marital status - Separated (%)
Marital status - Widowed (%)
Marital status - Divorced (%)
Ancestries Reported - Arab (%)
Ancestries Reported - Czech (%)
Ancestries Reported - Danish (%)
Ancestries Reported - Dutch (%)
Ancestries Reported - English (%)
Ancestries Reported - French (%)
Ancestries Reported - French Canadian (%)
Ancestries Reported - German (%)
Ancestries Reported - Greek (%)
Ancestries Reported - Hungarian (%)
Ancestries Reported - Irish (%)
Ancestries Reported - Italian (%)
Ancestries Reported - Lithuanian (%)
Ancestries Reported - Norwegian (%)
Ancestries Reported - Polish (%)
Ancestries Reported - Portuguese (%)
Ancestries Reported - Russian (%)
Ancestries Reported - Scotch-Irish (%)
Ancestries Reported - Scottish (%)
Ancestries Reported - Slovak (%)
Ancestries Reported - Subsaharan African (%)
Ancestries Reported - Swedish (%)
Ancestries Reported - Swiss (%)
Ancestries Reported - Ukrainian (%)
Ancestries Reported - United States (%)
Ancestries Reported - Welsh (%)
Ancestries Reported - West Indian (%)
Ancestries Reported - Other (%)
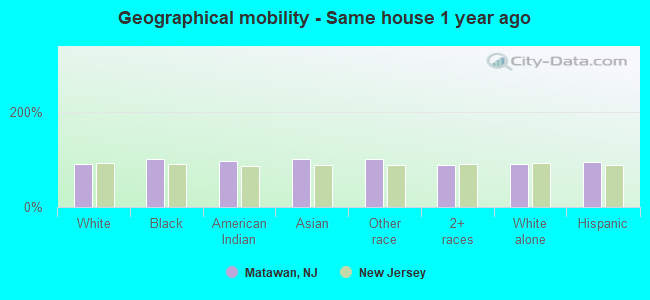
Geographical mobility - Same house 1 year ago (%)
Geographical mobility - Same house 1 year ago (%) - White
Geographical mobility - Same house 1 year ago (%) - Black or African American
Geographical mobility - Same house 1 year ago (%) - Asian
Geographical mobility - Same house 1 year ago (%) - Hispanic or Latino
Geographical mobility - Same house 1 year ago (%) - American Indian and Alaska Native
Geographical mobility - Same house 1 year ago (%) - Multirace
Geographical mobility - Same house 1 year ago (%) - Other Race
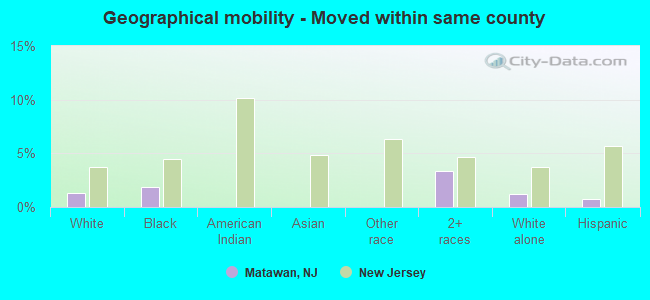
Geographical mobility - Moved within same county (%)
Geographical mobility - Moved within same county (%) - White
Geographical mobility - Moved within same county (%) - Black or African American
Geographical mobility - Moved within same county (%) - Asian
Geographical mobility - Moved within same county (%) - Hispanic or Latino
Geographical mobility - Moved within same county (%) - American Indian and Alaska Native
Geographical mobility - Moved within same county (%) - Multirace
Geographical mobility - Moved within same county (%) - Other Race
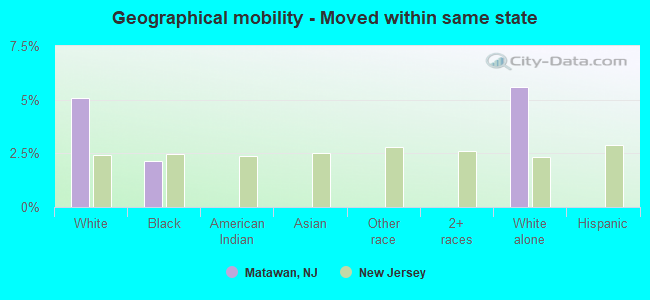
Geographical mobility - Moved from different county within same state (%)
Geographical mobility - Moved from different county within same state (%) - White
Geographical mobility - Moved from different county within same state (%) - Black or African American
Geographical mobility - Moved from different county within same state (%) - Asian
Geographical mobility - Moved from different county within same state (%) - Hispanic or Latino
Geographical mobility - Moved from different county within same state (%) - American Indian and Alaska Native
Geographical mobility - Moved from different county within same state (%) - Multirace
Geographical mobility - Moved from different county within same state (%) - Other Race
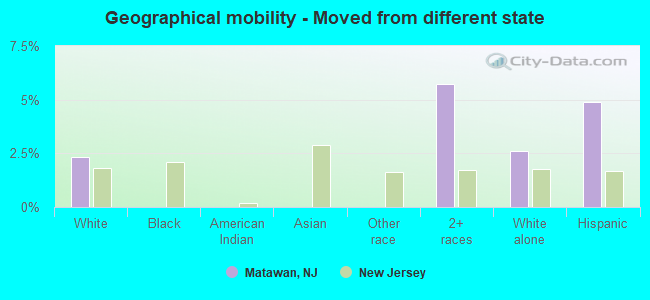
Geographical mobility - Moved from different state (%)
Geographical mobility - Moved from different state (%) - White
Geographical mobility - Moved from different state (%) - Black or African American
Geographical mobility - Moved from different state (%) - Asian
Geographical mobility - Moved from different state (%) - Hispanic or Latino
Geographical mobility - Moved from different state (%) - American Indian and Alaska Native
Geographical mobility - Moved from different state (%) - Multirace
Geographical mobility - Moved from different state (%) - Other Race
Geographical mobility - Moved from abroad (%)
Geographical mobility - Moved from abroad (%) - White
Geographical mobility - Moved from abroad (%) - Black or African American
Geographical mobility - Moved from abroad (%) - Asian
Geographical mobility - Moved from abroad (%) - Hispanic or Latino
Geographical mobility - Moved from abroad (%) - American Indian and Alaska Native
Geographical mobility - Moved from abroad (%) - Multirace
Geographical mobility - Moved from abroad (%) - Other Race
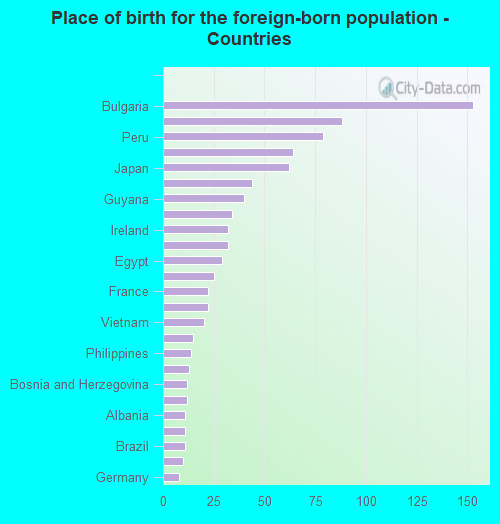
Place of birth for the foreign-born population - Ireland (%)
Place of birth for the foreign-born population - Denmark (%)
Place of birth for the foreign-born population - Norway (%)
Place of birth for the foreign-born population - Sweden (%)
Place of birth for the foreign-born population - United Kingdom (%)
Place of birth for the foreign-born population - England (%)
Place of birth for the foreign-born population - Scotland (%)
Place of birth for the foreign-born population - Other Northern Europe (%)
Place of birth for the foreign-born population - Austria (%)
Place of birth for the foreign-born population - Belgium (%)
Place of birth for the foreign-born population - France (%)
Place of birth for the foreign-born population - Germany (%)
Place of birth for the foreign-born population - Netherlands (%)
Place of birth for the foreign-born population - Switzerland (%)
Place of birth for the foreign-born population - Other Western Europe (%)
Place of birth for the foreign-born population - Greece (%)
Place of birth for the foreign-born population - Italy (%)
Place of birth for the foreign-born population - Portugal (%)
Place of birth for the foreign-born population - Spain (%)
Place of birth for the foreign-born population - Other Southern Europe (%)
Place of birth for the foreign-born population - Albania (%)
Place of birth for the foreign-born population - Belarus (%)
Place of birth for the foreign-born population - Bosnia and Herzegovina (%)
Place of birth for the foreign-born population - Bulgaria (%)
Place of birth for the foreign-born population - Croatia (%)
Place of birth for the foreign-born population - Czechoslovakia (%)
Place of birth for the foreign-born population - Hungary (%)
Place of birth for the foreign-born population - Latvia (%)
Place of birth for the foreign-born population - Lithuania (%)
Place of birth for the foreign-born population - North Macedonia (Macedonia) (%)
Place of birth for the foreign-born population - Moldova (%)
Place of birth for the foreign-born population - Poland (%)
Place of birth for the foreign-born population - Romania (%)
Place of birth for the foreign-born population - Russia (%)
Place of birth for the foreign-born population - Serbia (%)
Place of birth for the foreign-born population - Ukraine (%)
Place of birth for the foreign-born population - Other Eastern Europe (%)
Place of birth for the foreign-born population - China (%)
Place of birth for the foreign-born population - Hong Kong (%)
Place of birth for the foreign-born population - Taiwan (%)
Place of birth for the foreign-born population - Japan (%)
Place of birth for the foreign-born population - Korea (%)
Place of birth for the foreign-born population - Other Eastern Asia (%)
Place of birth for the foreign-born population - Afghanistan (%)
Place of birth for the foreign-born population - Bangladesh (%)
Place of birth for the foreign-born population - India (%)
Place of birth for the foreign-born population - Iran (%)
Place of birth for the foreign-born population - Kazakhstan (%)
Place of birth for the foreign-born population - Nepal (%)
Place of birth for the foreign-born population - Pakistan (%)
Place of birth for the foreign-born population - Sri Lanka (%)
Place of birth for the foreign-born population - Uzbekistan (%)
Place of birth for the foreign-born population - Other South Central Asia (%)
Place of birth for the foreign-born population - Burma (%)
Place of birth for the foreign-born population - Cambodia (%)
Place of birth for the foreign-born population - Indonesia (%)
Place of birth for the foreign-born population - Laos (%)
Place of birth for the foreign-born population - Malaysia (%)
Place of birth for the foreign-born population - Philippines (%)
Place of birth for the foreign-born population - Singapore (%)
Place of birth for the foreign-born population - Thailand (%)
Place of birth for the foreign-born population - Vietnam (%)
Place of birth for the foreign-born population - Other South Eastern Asia (%)
Place of birth for the foreign-born population - Armenia (%)
Place of birth for the foreign-born population - Iraq (%)
Place of birth for the foreign-born population - Israel (%)
Place of birth for the foreign-born population - Jordan (%)
Place of birth for the foreign-born population - Kuwait (%)
Place of birth for the foreign-born population - Lebanon (%)
Place of birth for the foreign-born population - Saudi Arabia (%)
Place of birth for the foreign-born population - Syria (%)
Place of birth for the foreign-born population - Turkey (%)
Place of birth for the foreign-born population - Yemen (%)
Place of birth for the foreign-born population - Other Western Asia (%)
Place of birth for the foreign-born population - Eritrea (%)
Place of birth for the foreign-born population - Ethiopia (%)
Place of birth for the foreign-born population - Kenya (%)
Place of birth for the foreign-born population - Somalia (%)
Place of birth for the foreign-born population - Uganda (%)
Place of birth for the foreign-born population - Zimbabwe (%)
Place of birth for the foreign-born population - Other Eastern Africa (%)
Place of birth for the foreign-born population - Cameroon (%)
Place of birth for the foreign-born population - Congo (%)
Place of birth for the foreign-born population - Democratic Republic of Congo (Zaire) (%)
Place of birth for the foreign-born population - Other Middle Africa (%)
Place of birth for the foreign-born population - Egypt (%)
Place of birth for the foreign-born population - Morocco (%)
Place of birth for the foreign-born population - Sudan (%)
Place of birth for the foreign-born population - Other Northern Africa (%)
Place of birth for the foreign-born population - South Africa (%)
Place of birth for the foreign-born population - Other Southern Africa (%)
Place of birth for the foreign-born population - Cabo Verde (%)
Place of birth for the foreign-born population - Ghana (%)
Place of birth for the foreign-born population - Liberia (%)
Place of birth for the foreign-born population - Nigeria (%)
Place of birth for the foreign-born population - Senegal (%)
Place of birth for the foreign-born population - Sierra Leone (%)
Place of birth for the foreign-born population - Other Western Africa (%)
Place of birth for the foreign-born population - Australia (%)
Place of birth for the foreign-born population - New Zealand (%)
Place of birth for the foreign-born population - Fiji (%)
Place of birth for the foreign-born population - Micronesia (%)
Place of birth for the foreign-born population - Bahamas (%)
Place of birth for the foreign-born population - Barbados (%)
Place of birth for the foreign-born population - Cuba (%)
Place of birth for the foreign-born population - Dominica (%)
Place of birth for the foreign-born population - Dominican Republic (%)
Place of birth for the foreign-born population - Grenada (%)
Place of birth for the foreign-born population - Haiti (%)
Place of birth for the foreign-born population - Jamaica (%)
Place of birth for the foreign-born population - St. Vincent and the Grenadines (%)
Place of birth for the foreign-born population - Trinidad and Tobago (%)
Place of birth for the foreign-born population - West Indies (%)
Place of birth for the foreign-born population - Other Caribbean (%)
Place of birth for the foreign-born population - Belize (%)
Place of birth for the foreign-born population - Costa Rica (%)
Place of birth for the foreign-born population - El Salvador (%)
Place of birth for the foreign-born population - Guatemala (%)
Place of birth for the foreign-born population - Honduras (%)
Place of birth for the foreign-born population - Mexico (%)
Place of birth for the foreign-born population - Nicaragua (%)
Place of birth for the foreign-born population - Panama (%)
Place of birth for the foreign-born population - Other Central America (%)
Place of birth for the foreign-born population - Argentina (%)
Place of birth for the foreign-born population - Bolivia (%)
Place of birth for the foreign-born population - Brazil (%)
Place of birth for the foreign-born population - Chile (%)
Place of birth for the foreign-born population - Colombia (%)
Place of birth for the foreign-born population - Ecuador (%)
Place of birth for the foreign-born population - Guyana (%)
Place of birth for the foreign-born population - Peru (%)
Place of birth for the foreign-born population - Uruguay (%)
Place of birth for the foreign-born population - Venezuela (%)
Place of birth for the foreign-born population - Other South America (%)
Place of birth for the foreign-born population - Canada (%)
Place of birth for the foreign-born population - Other Northern America (%)
Place of birth for the foreign-born population - Other (%)
Latest news about races in Matawan, NJ collected exclusively by city-data.com from local newspapers, TV, and radio stations
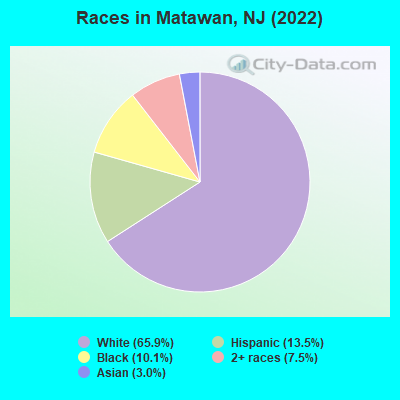
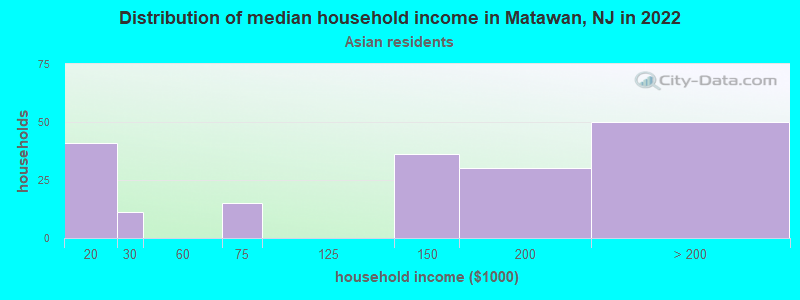
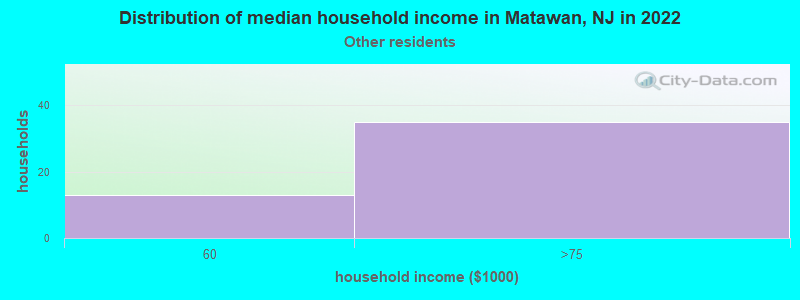
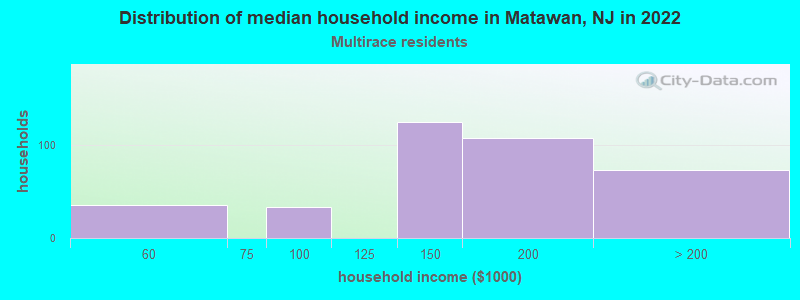
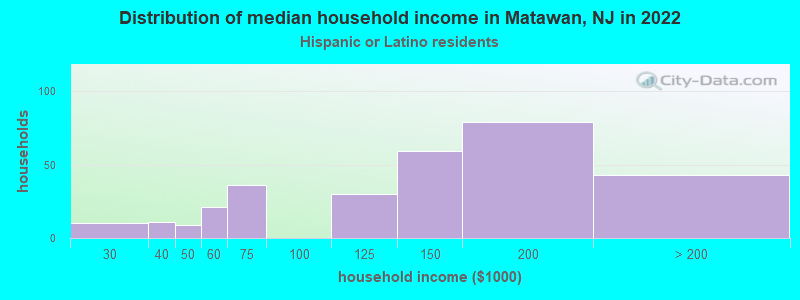
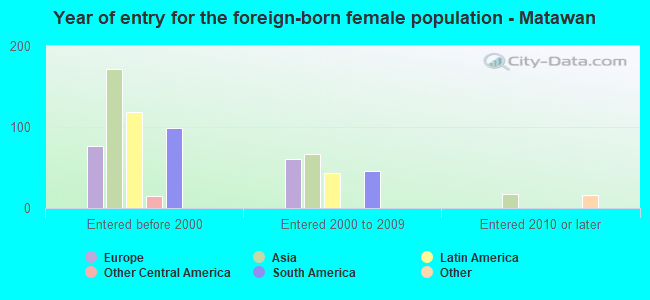
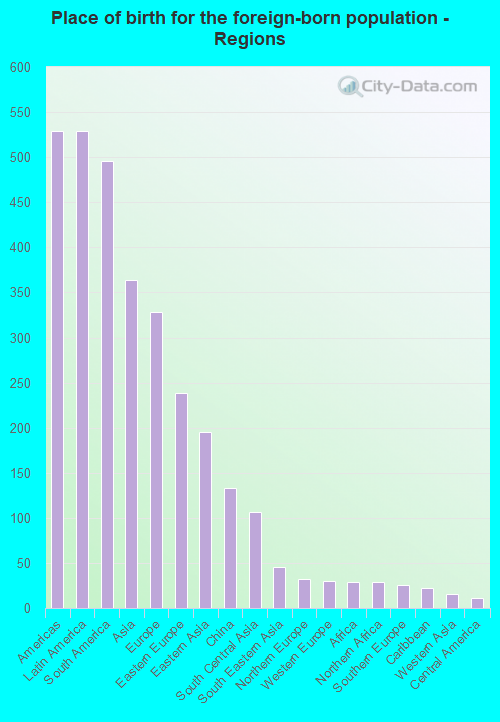
According to 2022 data, the most numerous races in Matawan, NJ are White alone (6,300 residents), Hispanic (1,286 residents), and Black alone (961 residents). 84.6% of Matawan residents speak English at home. 13.1% of Matawan, NJ residents are foreign-born (5.4% born in Latin America, 3.8% born in Asia, 3.4% born in Europe), which is 75.6% less than the foreign-born rate of 23.0% across the entire state of New Jersey.
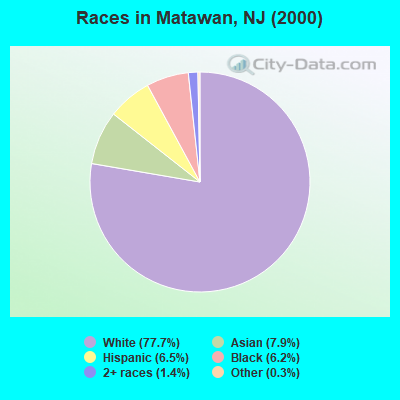
Race distribution in Matawan
2000 2022
5,557,209 66.0% White alone 1,117,191 13.3% Hispanic 1,096,171 13.0% Black alone 477,012 5.7% Asian alone 133,689 1.6% Two or more races 19,565 0.2% Other race alone 11,338 0.1% American Indian alone 2,175 0.03% Native Hawaiian and Other
4,766,476 51.5% White alone 2,028,470 21.9% Hispanic 1,111,632 12.0% Black alone 923,546 10.0% Asian alone 332,237 3.6% Two or more races 89,847 1.0% Other race alone 8,557 0.09% American Indian alone 934 0.01% Native Hawaiian and Other
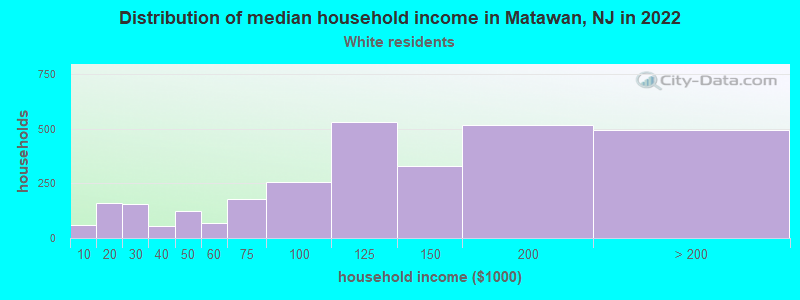
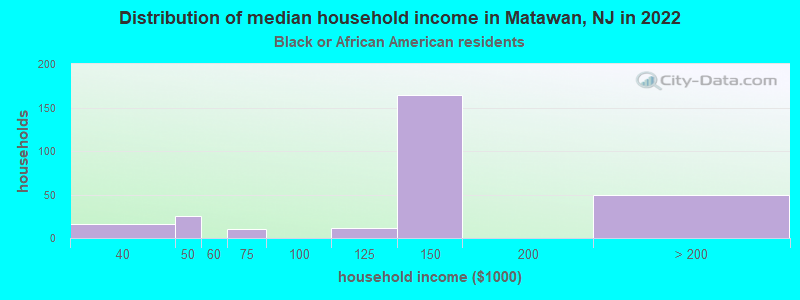
Income and house value in Matawan Median household income in 2022 $116,699 White non-Hispanic householders$89,666 Black householders$136,246 Asian householders$139,068 Two or more races householders$161,478 Hispanic or Latino race householdersMedian 2022 house value $460,878 White Non-Hispanic householders$356,330 Black or African American householders $473,147 Asian householders$479,282 Some other race householders$287,569 Two or more races householders$468,546 Hispanic or Latino householders
Median age by race in Matawan
39.9 Median age for White residents40.1 39.6 32.6 Median age for Black or African American residents26.6 33.4 -501,872,658.7 Median age for American Indian / Alaska Native residents-594,464,500.0 -447,596,532.3 57.7 Median age for Asian residents59.5 57.6 -804,177,544.9 Median age for Native Hawaiian / Pacific Islander residents-860,335,194.7 -713,070,378.3 43.3 Median age for Other race residents41.0 17.9 37.6 Median age for Two or more races residents32.7 37.8 40.7 Median age for White alone residents40.5 40.8 30.7 Median age for Hispanic or Latino residents29.2 31.5
Owner/renter occupied households by race in Matawan
House owners and renters - White residents 1,994 68.6% Owner occupied913 31.4% Renter occupiedHouse owners and renters - Black or African American residents 70 23.9% Owner occupied223 76.1% Renter occupiedHouse owners and renters - American Indian / Alaska Native residents 28 100.0% Renter occupiedHouse owners and renters - Asian residents 115 66.1% Owner occupied59 33.9% Renter occupiedHouse owners and renters - Other race residents 50 58.4% Owner occupied36 41.6% Renter occupiedHouse owners and renters - Two or more races residents 223 59.6% Owner occupied151 40.4% Renter occupiedHouse owners and renters - White alone residents 1,927 68.3% Owner occupied893 31.7% Renter occupiedHouse owners and renters - Hispanic or Latino residents 207 66.0% Owner occupied107 34.0% Renter occupied
Language usage in Matawan
English speakers - Total 84.6% of residents of Matawan speak English at home.
4.7% of residents speak Spanish at home 297 71.4% Speak English very well119 28.6% Speak English less than very well10.6% of residents speak other language at home 596 63.5% Speak English very well342 36.5% Speak English less than very well
English speakers - Born in the United States 90.2% of residents of Matawan speak English at home.
7.7% of residents speak Spanish at home 116 60.1% Speak English very well77 39.9% Speak English less than very well1.8% of residents speak other language at home 46 100.0% Speak English very well
English speakers - Native, born elsewhere 20.7% of residents of Matawan speak English at home.
71.0% of residents speak Spanish at home 86 62.8% Speak English very well51 37.2% Speak English less than very well3.6% of residents speak other language at home 7 100.0% Speak English very well
English speakers - Foreign-born 31.0% of residents of Matawan speak English at home.
7.5% of residents speak Spanish at home 78 83.0% Speak English very well16 17.0% Speak English less than very well59.7% of residents speak other language at home 409 54.5% Speak English very well342 45.5% Speak English less than very well
White (Caucasian) - Speak only English Native:
94.8% (5,739)Foreign-born:
4.7% (16)
White (Caucasian) - Speak another language Native:
5.0% (303)Foreign-born:
96.4% (329)
Black or African American - Speak only English Native:
97.3% (497)Foreign-born:
100.0% (284)
Asian - Speak only English Native:
67.9% (20)Foreign-born:
3.2% (9)
Asian - Speak another language Native:
25.7% (8)Foreign-born:
100.0% (269)
Other race - Speak another language Native:
21.6% (41)Foreign-born:
96.1% (107)
Two or more races - Speak only English Native:
92.3% (794)Foreign-born:
18.2% (36)
Two or more races - Speak another language Native:
10.0% (86)Foreign-born:
70.9% (141)
White alone - Speak only English Native:
97.4% (5,479)Foreign-born:
1.9% (7)
White alone - Speak another language Native:
2.7% (150)Foreign-born:
100.0% (374)
Hispanic or Latino - Speak only English Native:
69.5% (740)Foreign-born:
11.6% (14)
Hispanic or Latino - Speak another language Native:
31.7% (337)Foreign-born:
87.8% (106)
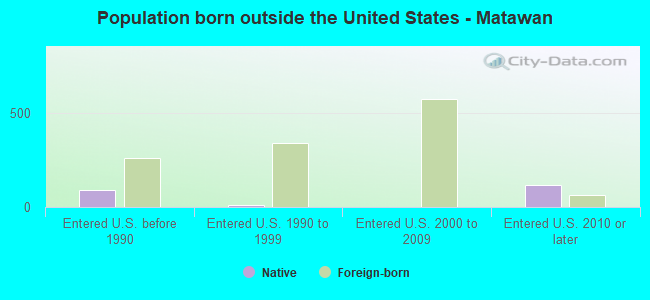
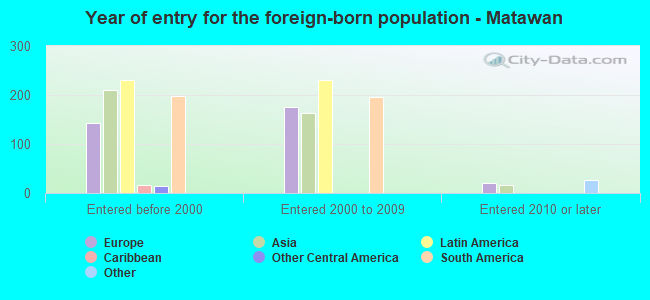
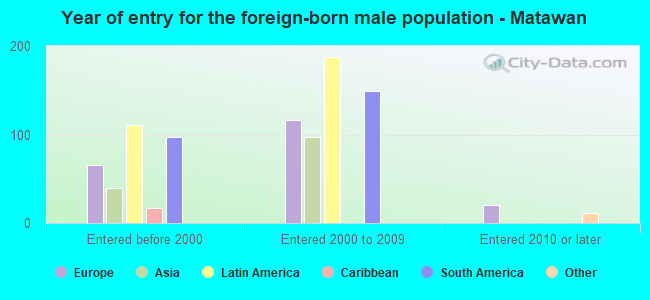
Foreign-born residents in Matawan 1,252 residents are foreign born (5.4% Latin America , 3.8% Asia , 3.4% Europe ).
This city:
13.1%New Jersey:
23.2%
Marital status for residents in Matawan Marital status - White (Caucasian) population 15 years and over
Males 33.7% Never married50.1% Now married2.4% Separated4.2% Widowed9.6% DivorcedFemales 26.3% Never married53.5% Now married1.1% Separated5.6% Widowed13.5% DivorcedWomen who gave birth in the past 12 months Now married:
75.3% (54)Unmarried:
24.7% (18)
Women who did not give birth in the past 12 months Now married:
57.2% (724)Unmarried:
42.8% (542)
Marital status - Black or African American population 15 years and over
Males 58.7% Never married32.4% Now married7.0% Separated0.0% Widowed1.8% DivorcedFemales 27.4% Never married64.6% Now married0.0% Separated8.0% Widowed0.0% DivorcedWomen who gave birth in the past 12 months Now married:
100.0% (107)Unmarried:
0.0% (0)
Women who did not give birth in the past 12 months Now married:
25.2% (29)Unmarried:
74.8% (85)
Marital status - Asian population 15 years and over
Males 9.8% Never married90.2% Now married0.0% Separated0.0% Widowed0.0% DivorcedFemales 0.0% Never married62.0% Now married0.0% Separated0.0% Widowed38.0% DivorcedWomen who did not give birth in the past 12 months Now married:
34.2% (26)Unmarried:
65.8% (49)
Marital status - Other race population 15 years and over
Males 0.0% Never married100.0% Now married0.0% Separated0.0% Widowed0.0% DivorcedFemales 0.0% Never married100.0% Now married0.0% Separated0.0% Widowed0.0% DivorcedMarital status - Two or more races population 15 years and over
Males 33.0% Never married64.3% Now married0.0% Separated2.7% Widowed0.0% DivorcedFemales 31.7% Never married32.7% Now married0.0% Separated12.5% Widowed23.1% DivorcedWomen who did not give birth in the past 12 months Now married:
36.5% (108)Unmarried:
63.5% (188)
Marital status - White alone, not Hispanic / Latino population 15 years and over
Males 34.2% Never married48.5% Now married2.4% Separated4.5% Widowed10.4% DivorcedFemales 25.2% Never married53.4% Now married1.2% Separated6.0% Widowed14.2% DivorcedWomen who gave birth in the past 12 months Now married:
75.3% (56)Unmarried:
24.7% (18)
Women who did not give birth in the past 12 months Now married:
58.5% (684)Unmarried:
41.5% (484)
Marital status - Hispanic or Latino population 15 years and over
Males 29.7% Never married67.8% Now married1.5% Separated1.1% Widowed0.0% DivorcedFemales 39.3% Never married57.9% Now married0.0% Separated0.0% Widowed2.9% DivorcedWomen who gave birth in the past 12 months Now married:
0.0% (0)Unmarried:
100.0% (18)
Women who did not give birth in the past 12 months Now married:
39.3% (89)Unmarried:
60.7% (138)
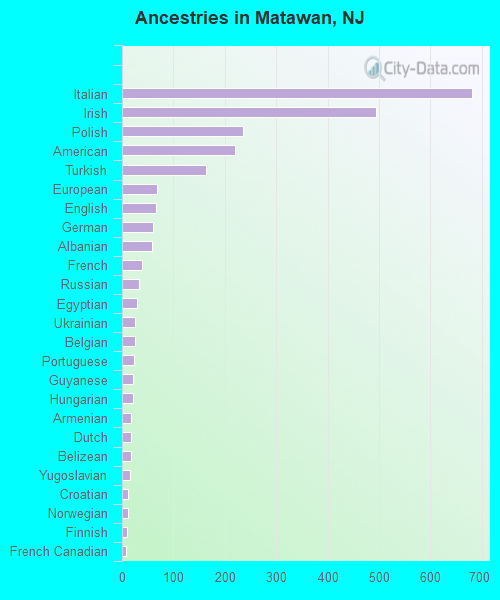
Ancestries in Matawan
680 16.0% Italian495 11.7% Irish235 5.5% Polish220 5.2% American164 3.9% Turkish69 1.6% European67 1.6% English61 1.4% German59 1.4% Albanian38 0.9% French33 0.8% Russian29 0.7% Egyptian26 0.6% Ukrainian25 0.6% Belgian24 0.6% Portuguese21 0.5% Guyanese21 0.5% Hungarian17 0.4% Armenian17 0.4% Dutch17 0.4% Belizean15 0.4% Yugoslavian11 0.3% Croatian11 0.3% Norwegian10 0.2% Finnish8 0.2% French Canadian7 0.2% Macedonian4 0.09% British4 0.09% Welsh1 0.02% Romanian
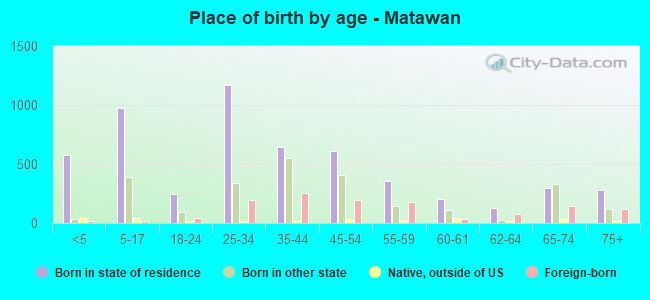
Children Nativity (place of birth) in Matawan
Children under 6 years - Living with two parents Both parents native 431 100.0% NativeBoth parents foreign-born 52 100.0% NativeOne native, one foreign-born parent 65 100.0% NativeChildren under 6 years - Living with one parent Native parent 105 100.0% NativeForeign-born parent 94 100.0% NativeChildren 6 to 17 years - Living with two parents Both parents native 729 100.0% NativeBoth parents foreign-born 82 94.6% Native5 5.4% Foreign-bornOne native, one foreign-born parent 131 100.0% NativeChildren 6 to 17 years - Living with one parent Native parent 346 100.0% NativeForeign-born parent 14 48.9% Native14 51.1% Foreign-born
Grandparents responsible for own grandchildren in Matawan
Grandparents (30 to 59 years) White / Caucasian 5 100.0% Not responsible for grandchildrenBlack or African American 66 100.0% Not responsible for grandchildrenHispanic or Latino 6 100.0% Not responsible for grandchildrenGrandparents (60 years and over) White / Caucasian 42 51.7% Responsible for grandchildren40 48.3% Not responsible for grandchildrenHispanic or Latino 6 19.9% Responsible for grandchildren23 80.1% Not responsible for grandchildren