Races in Mauldin, South Carolina (SC) Detailed Stats
Data:
Races - White alone (%)
Races - White alone (% change since 2000)
Races - Black alone (%)
Races - Black alone (% change since 2000)
Races - American Indian alone (%)
Races - American Indian alone (% change since 2000)
Races - Asian alone (%)
Races - Asian alone (% change since 2000)
Races - Hispanic (%)
Races - Hispanic (% change since 2000)
Races - Native Hawaiian and Other Pacific Islander alone (%)
Races - Native Hawaiian and Other Pacific Islander alone (% change since 2000)
Races - Two or more races(%)
Races - Two or more races(% change since 2000)
Races - Other race alone (%)
Races - Other race alone (% change since 2000)
Racial diversity
Place of birth - Born in state of residence (%)
Place of birth - Born in state of residence (%) - White
Place of birth - Born in state of residence (%) - Black or African American
Place of birth - Born in state of residence (%) - Asian
Place of birth - Born in state of residence (%) - Hispanic or Latino
Place of birth - Born in state of residence (%) - American Indian and Alaska Native
Place of birth - Born in state of residence (%) - Multirace
Place of birth - Born in state of residence (%) - Other Race
Place of birth - Born in other state (%)
Place of birth - Born in other state (%) - White
Place of birth - Born in other state (%) - Black or African American
Place of birth - Born in other state (%) - Asian
Place of birth - Born in other state (%) - Hispanic or Latino
Place of birth - Born in other state (%) - American Indian and Alaska Native
Place of birth - Born in other state (%) - Multirace
Place of birth - Born in other state (%) - Other Race
Place of birth - Native, outside of US (%)
Place of birth - Native, outside of US (%) - White
Place of birth - Native, outside of US (%) - Black or African American
Place of birth - Native, outside of US (%) - Asian
Place of birth - Native, outside of US (%) - Hispanic or Latino
Place of birth - Native, outside of US (%) - American Indian and Alaska Native
Place of birth - Native, outside of US (%) - Multirace
Place of birth - Native, outside of US (%) - Other Race
Place of birth - Foreign born (%)
Place of birth - Foreign born (%) - White
Place of birth - Foreign born (%) - Black or African American
Place of birth - Foreign born (%) - Asian
Place of birth - Foreign born (%) - Hispanic or Latino
Place of birth - Foreign born (%) - American Indian and Alaska Native
Place of birth - Foreign born (%) - Multirace
Place of birth - Foreign born (%) - Other Race
Residents speaking English at home (%)
Residents speaking English at home - Born in the United States (%)
Residents speaking English at home - Native, born elsewhere (%)
Residents speaking English at home - Foreign born (%)
Residents speaking Spanish at home (%)
Residents speaking Spanish at home - Born in the United States (%)
Residents speaking Spanish at home - Native, born elsewhere (%)
Residents speaking Spanish at home - Foreign born (%)
Residents speaking other language at home (%)
Residents speaking other language at home - Born in the United States (%)
Residents speaking other language at home - Native, born elsewhere (%)
Residents speaking other language at home - Foreign born (%)
Marital status - Never married (%)
Marital status - Now married (%)
Marital status - Separated (%)
Marital status - Widowed (%)
Marital status - Divorced (%)
Ancestries Reported - Arab (%)
Ancestries Reported - Czech (%)
Ancestries Reported - Danish (%)
Ancestries Reported - Dutch (%)
Ancestries Reported - English (%)
Ancestries Reported - French (%)
Ancestries Reported - French Canadian (%)
Ancestries Reported - German (%)
Ancestries Reported - Greek (%)
Ancestries Reported - Hungarian (%)
Ancestries Reported - Irish (%)
Ancestries Reported - Italian (%)
Ancestries Reported - Lithuanian (%)
Ancestries Reported - Norwegian (%)
Ancestries Reported - Polish (%)
Ancestries Reported - Portuguese (%)
Ancestries Reported - Russian (%)
Ancestries Reported - Scotch-Irish (%)
Ancestries Reported - Scottish (%)
Ancestries Reported - Slovak (%)
Ancestries Reported - Subsaharan African (%)
Ancestries Reported - Swedish (%)
Ancestries Reported - Swiss (%)
Ancestries Reported - Ukrainian (%)
Ancestries Reported - United States (%)
Ancestries Reported - Welsh (%)
Ancestries Reported - West Indian (%)
Ancestries Reported - Other (%)
Geographical mobility - Same house 1 year ago (%)
Geographical mobility - Same house 1 year ago (%) - White
Geographical mobility - Same house 1 year ago (%) - Black or African American
Geographical mobility - Same house 1 year ago (%) - Asian
Geographical mobility - Same house 1 year ago (%) - Hispanic or Latino
Geographical mobility - Same house 1 year ago (%) - American Indian and Alaska Native
Geographical mobility - Same house 1 year ago (%) - Multirace
Geographical mobility - Same house 1 year ago (%) - Other Race
Geographical mobility - Moved within same county (%)
Geographical mobility - Moved within same county (%) - White
Geographical mobility - Moved within same county (%) - Black or African American
Geographical mobility - Moved within same county (%) - Asian
Geographical mobility - Moved within same county (%) - Hispanic or Latino
Geographical mobility - Moved within same county (%) - American Indian and Alaska Native
Geographical mobility - Moved within same county (%) - Multirace
Geographical mobility - Moved within same county (%) - Other Race
Geographical mobility - Moved from different county within same state (%)
Geographical mobility - Moved from different county within same state (%) - White
Geographical mobility - Moved from different county within same state (%) - Black or African American
Geographical mobility - Moved from different county within same state (%) - Asian
Geographical mobility - Moved from different county within same state (%) - Hispanic or Latino
Geographical mobility - Moved from different county within same state (%) - American Indian and Alaska Native
Geographical mobility - Moved from different county within same state (%) - Multirace
Geographical mobility - Moved from different county within same state (%) - Other Race
Geographical mobility - Moved from different state (%)
Geographical mobility - Moved from different state (%) - White
Geographical mobility - Moved from different state (%) - Black or African American
Geographical mobility - Moved from different state (%) - Asian
Geographical mobility - Moved from different state (%) - Hispanic or Latino
Geographical mobility - Moved from different state (%) - American Indian and Alaska Native
Geographical mobility - Moved from different state (%) - Multirace
Geographical mobility - Moved from different state (%) - Other Race
Geographical mobility - Moved from abroad (%)
Geographical mobility - Moved from abroad (%) - White
Geographical mobility - Moved from abroad (%) - Black or African American
Geographical mobility - Moved from abroad (%) - Asian
Geographical mobility - Moved from abroad (%) - Hispanic or Latino
Geographical mobility - Moved from abroad (%) - American Indian and Alaska Native
Geographical mobility - Moved from abroad (%) - Multirace
Geographical mobility - Moved from abroad (%) - Other Race
Place of birth for the foreign-born population - Ireland (%)
Place of birth for the foreign-born population - Denmark (%)
Place of birth for the foreign-born population - Norway (%)
Place of birth for the foreign-born population - Sweden (%)
Place of birth for the foreign-born population - United Kingdom (%)
Place of birth for the foreign-born population - England (%)
Place of birth for the foreign-born population - Scotland (%)
Place of birth for the foreign-born population - Other Northern Europe (%)
Place of birth for the foreign-born population - Austria (%)
Place of birth for the foreign-born population - Belgium (%)
Place of birth for the foreign-born population - France (%)
Place of birth for the foreign-born population - Germany (%)
Place of birth for the foreign-born population - Netherlands (%)
Place of birth for the foreign-born population - Switzerland (%)
Place of birth for the foreign-born population - Other Western Europe (%)
Place of birth for the foreign-born population - Greece (%)
Place of birth for the foreign-born population - Italy (%)
Place of birth for the foreign-born population - Portugal (%)
Place of birth for the foreign-born population - Spain (%)
Place of birth for the foreign-born population - Other Southern Europe (%)
Place of birth for the foreign-born population - Albania (%)
Place of birth for the foreign-born population - Belarus (%)
Place of birth for the foreign-born population - Bosnia and Herzegovina (%)
Place of birth for the foreign-born population - Bulgaria (%)
Place of birth for the foreign-born population - Croatia (%)
Place of birth for the foreign-born population - Czechoslovakia (%)
Place of birth for the foreign-born population - Hungary (%)
Place of birth for the foreign-born population - Latvia (%)
Place of birth for the foreign-born population - Lithuania (%)
Place of birth for the foreign-born population - North Macedonia (Macedonia) (%)
Place of birth for the foreign-born population - Moldova (%)
Place of birth for the foreign-born population - Poland (%)
Place of birth for the foreign-born population - Romania (%)
Place of birth for the foreign-born population - Russia (%)
Place of birth for the foreign-born population - Serbia (%)
Place of birth for the foreign-born population - Ukraine (%)
Place of birth for the foreign-born population - Other Eastern Europe (%)
Place of birth for the foreign-born population - China (%)
Place of birth for the foreign-born population - Hong Kong (%)
Place of birth for the foreign-born population - Taiwan (%)
Place of birth for the foreign-born population - Japan (%)
Place of birth for the foreign-born population - Korea (%)
Place of birth for the foreign-born population - Other Eastern Asia (%)
Place of birth for the foreign-born population - Afghanistan (%)
Place of birth for the foreign-born population - Bangladesh (%)
Place of birth for the foreign-born population - India (%)
Place of birth for the foreign-born population - Iran (%)
Place of birth for the foreign-born population - Kazakhstan (%)
Place of birth for the foreign-born population - Nepal (%)
Place of birth for the foreign-born population - Pakistan (%)
Place of birth for the foreign-born population - Sri Lanka (%)
Place of birth for the foreign-born population - Uzbekistan (%)
Place of birth for the foreign-born population - Other South Central Asia (%)
Place of birth for the foreign-born population - Burma (%)
Place of birth for the foreign-born population - Cambodia (%)
Place of birth for the foreign-born population - Indonesia (%)
Place of birth for the foreign-born population - Laos (%)
Place of birth for the foreign-born population - Malaysia (%)
Place of birth for the foreign-born population - Philippines (%)
Place of birth for the foreign-born population - Singapore (%)
Place of birth for the foreign-born population - Thailand (%)
Place of birth for the foreign-born population - Vietnam (%)
Place of birth for the foreign-born population - Other South Eastern Asia (%)
Place of birth for the foreign-born population - Armenia (%)
Place of birth for the foreign-born population - Iraq (%)
Place of birth for the foreign-born population - Israel (%)
Place of birth for the foreign-born population - Jordan (%)
Place of birth for the foreign-born population - Kuwait (%)
Place of birth for the foreign-born population - Lebanon (%)
Place of birth for the foreign-born population - Saudi Arabia (%)
Place of birth for the foreign-born population - Syria (%)
Place of birth for the foreign-born population - Turkey (%)
Place of birth for the foreign-born population - Yemen (%)
Place of birth for the foreign-born population - Other Western Asia (%)
Place of birth for the foreign-born population - Eritrea (%)
Place of birth for the foreign-born population - Ethiopia (%)
Place of birth for the foreign-born population - Kenya (%)
Place of birth for the foreign-born population - Somalia (%)
Place of birth for the foreign-born population - Uganda (%)
Place of birth for the foreign-born population - Zimbabwe (%)
Place of birth for the foreign-born population - Other Eastern Africa (%)
Place of birth for the foreign-born population - Cameroon (%)
Place of birth for the foreign-born population - Congo (%)
Place of birth for the foreign-born population - Democratic Republic of Congo (Zaire) (%)
Place of birth for the foreign-born population - Other Middle Africa (%)
Place of birth for the foreign-born population - Egypt (%)
Place of birth for the foreign-born population - Morocco (%)
Place of birth for the foreign-born population - Sudan (%)
Place of birth for the foreign-born population - Other Northern Africa (%)
Place of birth for the foreign-born population - South Africa (%)
Place of birth for the foreign-born population - Other Southern Africa (%)
Place of birth for the foreign-born population - Cabo Verde (%)
Place of birth for the foreign-born population - Ghana (%)
Place of birth for the foreign-born population - Liberia (%)
Place of birth for the foreign-born population - Nigeria (%)
Place of birth for the foreign-born population - Senegal (%)
Place of birth for the foreign-born population - Sierra Leone (%)
Place of birth for the foreign-born population - Other Western Africa (%)
Place of birth for the foreign-born population - Australia (%)
Place of birth for the foreign-born population - New Zealand (%)
Place of birth for the foreign-born population - Fiji (%)
Place of birth for the foreign-born population - Micronesia (%)
Place of birth for the foreign-born population - Bahamas (%)
Place of birth for the foreign-born population - Barbados (%)
Place of birth for the foreign-born population - Cuba (%)
Place of birth for the foreign-born population - Dominica (%)
Place of birth for the foreign-born population - Dominican Republic (%)
Place of birth for the foreign-born population - Grenada (%)
Place of birth for the foreign-born population - Haiti (%)
Place of birth for the foreign-born population - Jamaica (%)
Place of birth for the foreign-born population - St. Vincent and the Grenadines (%)
Place of birth for the foreign-born population - Trinidad and Tobago (%)
Place of birth for the foreign-born population - West Indies (%)
Place of birth for the foreign-born population - Other Caribbean (%)
Place of birth for the foreign-born population - Belize (%)
Place of birth for the foreign-born population - Costa Rica (%)
Place of birth for the foreign-born population - El Salvador (%)
Place of birth for the foreign-born population - Guatemala (%)
Place of birth for the foreign-born population - Honduras (%)
Place of birth for the foreign-born population - Mexico (%)
Place of birth for the foreign-born population - Nicaragua (%)
Place of birth for the foreign-born population - Panama (%)
Place of birth for the foreign-born population - Other Central America (%)
Place of birth for the foreign-born population - Argentina (%)
Place of birth for the foreign-born population - Bolivia (%)
Place of birth for the foreign-born population - Brazil (%)
Place of birth for the foreign-born population - Chile (%)
Place of birth for the foreign-born population - Colombia (%)
Place of birth for the foreign-born population - Ecuador (%)
Place of birth for the foreign-born population - Guyana (%)
Place of birth for the foreign-born population - Peru (%)
Place of birth for the foreign-born population - Uruguay (%)
Place of birth for the foreign-born population - Venezuela (%)
Place of birth for the foreign-born population - Other South America (%)
Place of birth for the foreign-born population - Canada (%)
Place of birth for the foreign-born population - Other Northern America (%)
Place of birth for the foreign-born population - Other (%)
Latest news about races in Mauldin, SC collected exclusively by city-data.com from local newspapers, TV, and radio stations
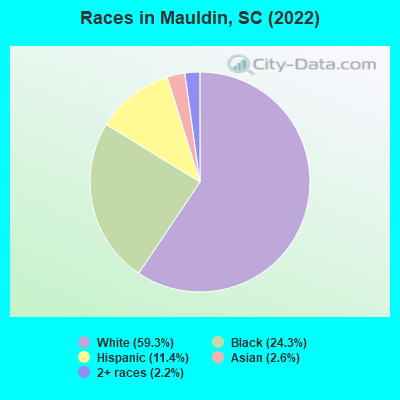
According to 2022 data, the most numerous races in Mauldin, SC are White alone (15,535 residents), Black alone (6,366 residents), and Hispanic (2,982 residents). 86.7% of Mauldin residents speak English at home. 9.6% of Mauldin, SC residents are foreign-born (4.6% born in Latin America, 2.7% born in Asia, 1.1% born in Europe, 1.0% born in Africa), which is 48.2% greater than the foreign-born rate of 5.0% across the entire state of South Carolina.
Race distribution in Mauldin
2000 2022
2,652,291 66.1% White alone 1,178,486 29.4% Black alone 95,076 2.4% Hispanic 35,568 0.9% Asian alone 33,290 0.8% Two or more races 12,765 0.3% American Indian alone 3,266 0.08% Other race alone 1,270 0.03% Native Hawaiian and Other
3,301,739 62.5% White alone 1,313,290 24.9% Black alone 343,783 6.5% Hispanic 190,508 3.6% Two or more races 89,888 1.7% Asian alone 29,390 0.6% Other race alone 12,112 0.2% American Indian alone 1,924 0.04% Native Hawaiian and Other
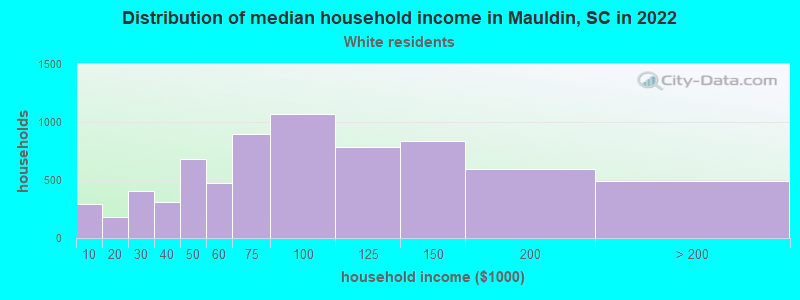
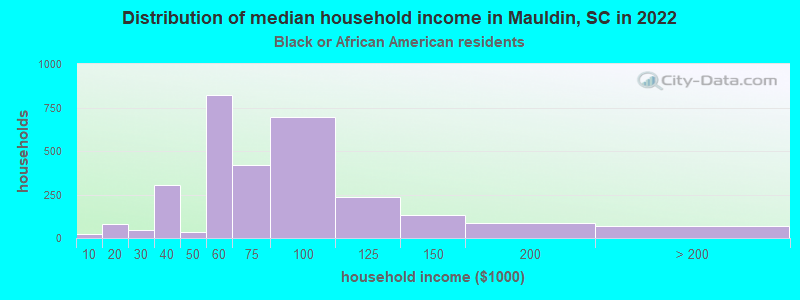
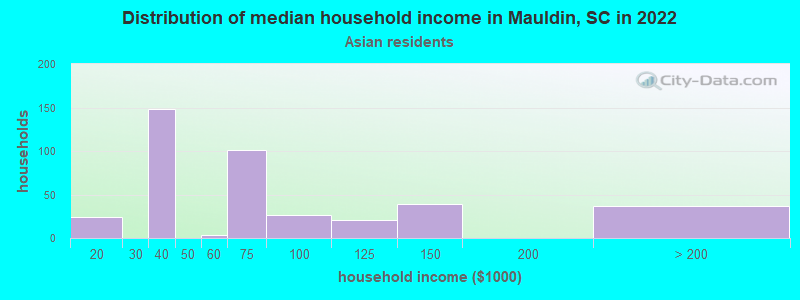
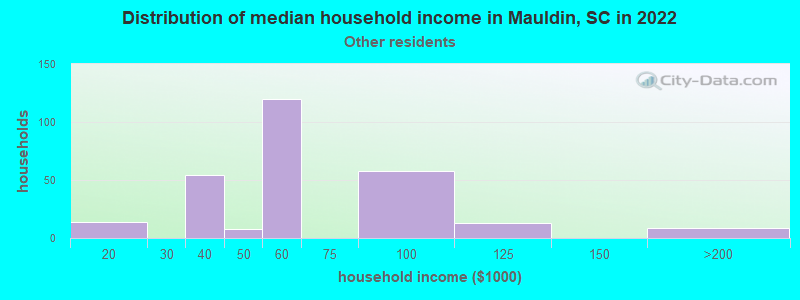
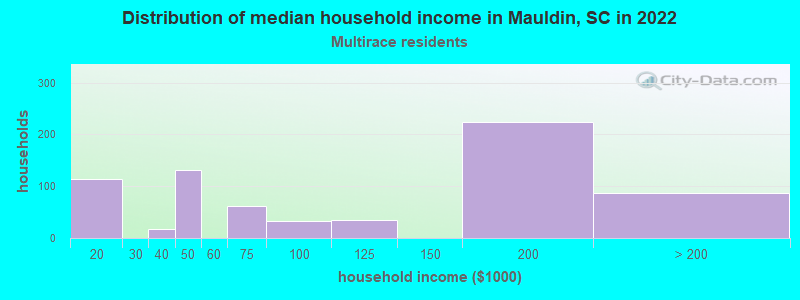
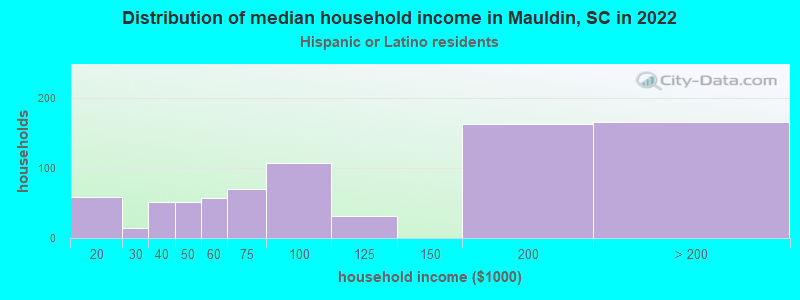
Income and house value in Mauldin Median household income in 2022 $80,296 White non-Hispanic householders$73,630 Black householders$59,967 Asian householders$62,617 Some other race householdersMedian 2022 house value $257,118 White Non-Hispanic householders$265,653 Black or African American householders$181,370 American Indian or Alaska Native householders $166,647 Asian householders$202,707 Some other race householders$158,965 Two or more races householders$329,666 Hispanic or Latino householders
Median age by race in Mauldin
45.0 Median age for White residents44.5 45.4 43.5 Median age for Black or African American residents43.7 45.5 -450,811,842.9 Median age for American Indian / Alaska Native residents-862,419,205.0 -446,859,902.9 43.2 Median age for Asian residents32.7 44.5 -698,412,697.7 Median age for Native Hawaiian / Pacific Islander residents-551,574,375.1 -1,016,109,044.8 26.3 Median age for Other race residents25.3 31.5 31.3 Median age for Two or more races residents17.6 43.0 44.9 Median age for White alone residents43.8 45.4 33.6 Median age for Hispanic or Latino residents30.7 34.2
Owner/renter occupied households by race in Mauldin
House owners and renters - White residents 5,334 76.9% Owner occupied1,599 23.1% Renter occupiedHouse owners and renters - Black or African American residents 1,592 56.1% Owner occupied1,246 43.9% Renter occupiedHouse owners and renters - Asian residents 284 63.7% Owner occupied162 36.3% Renter occupiedHouse owners and renters - Native Hawaiian / Pacific Islander residents 6 100.0% Owner occupiedHouse owners and renters - Other race residents 181 60.5% Owner occupied118 39.5% Renter occupiedHouse owners and renters - Two or more races residents 312 40.2% Owner occupied464 59.8% Renter occupiedHouse owners and renters - White alone residents 5,222 76.9% Owner occupied1,565 23.1% Renter occupiedHouse owners and renters - Hispanic or Latino residents 521 48.3% Owner occupied557 51.7% Renter occupied
Language usage in Mauldin
English speakers - Total 86.7% of residents of Mauldin speak English at home.
7.9% of residents speak Spanish at home 1,255 63.7% Speak English very well715 36.3% Speak English less than very well5.3% of residents speak other language at home 954 71.3% Speak English very well384 28.7% Speak English less than very well
English speakers - Born in the United States 94.6% of residents of Mauldin speak English at home.
3.6% of residents speak Spanish at home 384 90.4% Speak English very well41 9.6% Speak English less than very well1.5% of residents speak other language at home 180 100.0% Speak English very well
English speakers - Native, born elsewhere 78.1% of residents of Mauldin speak English at home.
21.2% of residents speak Spanish at home 90 100.0% Speak English very well
English speakers - Foreign-born 10.7% of residents of Mauldin speak English at home.
40.1% of residents speak Spanish at home 379 40.2% Speak English very well563 59.8% Speak English less than very well50.1% of residents speak other language at home 789 67.1% Speak English very well387 32.9% Speak English less than very well
White (Caucasian) - Speak only English Native:
97.3% (14,116)Foreign-born:
21.7% (137)
White (Caucasian) - Speak another language Native:
2.6% (372)Foreign-born:
69.2% (436)
Black or African American - Speak only English Native:
95.4% (5,669)Foreign-born:
1.1% (3)
Black or African American - Speak another language Native:
4.9% (294)Foreign-born:
100.0% (293)
Asian - Speak only English Native:
54.9% (43)Foreign-born:
16.1% (86)
Asian - Speak another language Native:
37.0% (29)Foreign-born:
84.0% (451)
Other race - Speak only English Native:
20.9% (89)Foreign-born:
2.5% (14)
Other race - Speak another language Native:
74.6% (317)Foreign-born:
94.6% (532)
Two or more races - Speak only English Native:
86.7% (1,526)Foreign-born:
0.6% (2)
Two or more races - Speak another language Native:
13.1% (231)Foreign-born:
100.0% (369)
White alone - Speak only English Native:
97.6% (13,990)Foreign-born:
27.8% (143)
White alone - Speak another language Native:
2.3% (330)Foreign-born:
69.6% (359)
Hispanic or Latino - Speak only English Native:
73.1% (1,324)Foreign-born:
1.3% (13)
Hispanic or Latino - Speak another language Native:
32.5% (589)Foreign-born:
96.7% (1,004)
Foreign-born residents in Mauldin 2,529 residents are foreign born (4.6% Latin America , 2.7% Asia , 1.1% Europe , 1.0% Africa ).
This city:
9.6%South Carolina:
5.3%
Marital status for residents in Mauldin Marital status - White (Caucasian) population 15 years and over
Males 26.5% Never married58.8% Now married1.8% Separated3.8% Widowed9.1% DivorcedFemales 25.0% Never married48.0% Now married1.6% Separated8.5% Widowed16.9% DivorcedWomen who gave birth in the past 12 months Now married:
78.8% (63)Unmarried:
21.2% (17)
Women who did not give birth in the past 12 months Now married:
43.9% (1,654)Unmarried:
56.1% (2,114)
Marital status - Black or African American population 15 years and over
Males 48.3% Never married41.2% Now married0.0% Separated0.4% Widowed10.1% DivorcedFemales 39.8% Never married38.7% Now married3.4% Separated3.2% Widowed14.9% DivorcedWomen who gave birth in the past 12 months Now married:
100.0% (28)Unmarried:
0.0% (0)
Women who did not give birth in the past 12 months Now married:
19.5% (307)Unmarried:
80.5% (1,266)
Marital status - Asian population 15 years and over
Males 12.0% Never married47.4% Now married0.0% Separated0.0% Widowed40.6% DivorcedFemales 9.5% Never married75.5% Now married0.0% Separated9.1% Widowed5.8% DivorcedWomen who gave birth in the past 12 months Now married:
100.0% (29)Unmarried:
0.0% (0)
Women who did not give birth in the past 12 months Now married:
76.3% (82)Unmarried:
23.7% (25)
Marital status - Other race population 15 years and over
Males 44.7% Never married55.3% Now married0.0% Separated0.0% Widowed0.0% DivorcedFemales 26.9% Never married73.1% Now married0.0% Separated0.0% Widowed0.0% DivorcedWomen who gave birth in the past 12 months Now married:
100.0% (17)Unmarried:
0.0% (0)
Women who did not give birth in the past 12 months Now married:
68.1% (191)Unmarried:
31.9% (90)
Marital status - Two or more races population 15 years and over
Males 54.6% Never married39.7% Now married0.0% Separated2.0% Widowed3.7% DivorcedFemales 8.4% Never married76.6% Now married0.0% Separated0.3% Widowed14.7% DivorcedWomen who did not give birth in the past 12 months Now married:
74.2% (438)Unmarried:
25.8% (152)
Marital status - White alone, not Hispanic / Latino population 15 years and over
Males 27.6% Never married58.2% Now married1.9% Separated3.9% Widowed8.4% DivorcedFemales 25.6% Never married47.2% Now married1.6% Separated8.8% Widowed16.7% DivorcedWomen who gave birth in the past 12 months Now married:
78.8% (64)Unmarried:
21.2% (17)
Women who did not give birth in the past 12 months Now married:
42.9% (1,609)Unmarried:
57.1% (2,142)
Marital status - Hispanic or Latino population 15 years and over
Males 39.4% Never married53.6% Now married0.0% Separated0.0% Widowed7.0% DivorcedFemales 13.2% Never married79.6% Now married0.0% Separated0.2% Widowed7.0% DivorcedWomen who gave birth in the past 12 months Now married:
100.0% (14)Unmarried:
0.0% (0)
Women who did not give birth in the past 12 months Now married:
80.1% (640)Unmarried:
19.9% (159)
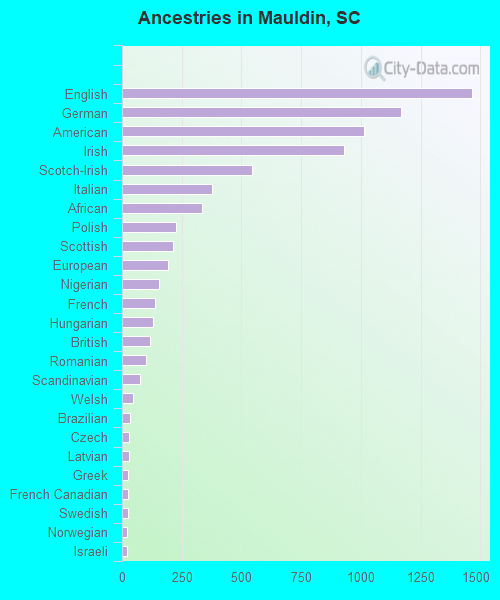
Ancestries in Mauldin
1,463 10.2% English1,168 8.1% German1,015 7.1% American929 6.5% Irish546 3.8% Scotch-Irish377 2.6% Italian335 2.3% African226 1.6% Polish215 1.5% Scottish192 1.3% European155 1.1% Nigerian137 1.0% French128 0.9% Hungarian119 0.8% British101 0.7% Romanian74 0.5% Scandinavian46 0.3% Welsh34 0.2% Brazilian29 0.2% Czech28 0.2% Latvian26 0.2% Greek24 0.2% French Canadian24 0.2% Swedish20 0.1% Norwegian19 0.1% Israeli14 0.10% Albanian13 0.09% Egyptian12 0.08% Slovene11 0.08% Canadian9 0.06% Cypriot9 0.06% Dutch
Geographical mobility in Mauldin Same house 1 year ago 13,529 84.8% White (Caucasian)5,437 86.1% Black or African American608 89.6% Asian10 100.0% Native Hawaiian / Pacific Islander905 84.7% Other race931 43.1% Two or more races13,375 86.4% White alone, not Hispanic / Latino1,489 50.7% Hispanic or LatinoMoved within same county 1,056 6.6% White / Caucasian296 4.7% Black or African American11 1.7% Asian10 0.9% Other race65 3.0% Two or more races788 5.1% White alone, not Hispanic / Latino536 18.3% Hispanic or LatinoMoved within same state 456 2.9% White / Caucasian353 5.6% Black or African American19 1.8% Other race267 12.3% Two or more races467 3.0% White alone, not Hispanic / Latino296 10.1% Hispanic or LatinoMoved from different state 656 4.1% White / Caucasian156 2.5% Black or African American13 1.9% Asian782 36.2% Two or more races699 4.5% White alone, not Hispanic / Latino318 10.8% Hispanic or LatinoMoved from abroad 103 0.6% White145 2.3% Black or African American26 3.8% Asian118 11.1% Other race184 8.5% Two or more races110 0.7% White alone, not Hispanic / Latino181 6.1% Hispanic or Latino
Children Nativity (place of birth) in Mauldin
Children under 6 years - Living with two parents Both parents native 485 100.0% NativeBoth parents foreign-born 102 82.7% Native21 17.3% Foreign-bornOne native, one foreign-born parent 370 100.0% NativeChildren under 6 years - Living with one parent Native parent 380 100.0% NativeForeign-born parent 25 100.0% NativeChildren 6 to 17 years - Living with two parents Both parents native 2,024 99.1% Native18 0.9% Foreign-bornBoth parents foreign-born 128 54.0% Native109 46.0% Foreign-bornOne native, one foreign-born parent 163 100.0% NativeChildren 6 to 17 years - Living with one parent Native parent 568 100.0% NativeForeign-born parent 236 64.7% Native129 35.3% Foreign-born
Grandparents responsible for own grandchildren in Mauldin
Grandparents (30 to 59 years) White / Caucasian 8 100.0% Not responsible for grandchildrenBlack or African American 55 87.8% Responsible for grandchildren8 12.2% Not responsible for grandchildrenWhite alone, not Hispanic / Latino 9 100.0% Not responsible for grandchildrenGrandparents (60 years and over) White / Caucasian 33 24.2% Responsible for grandchildren103 75.8% Not responsible for grandchildrenBlack or African American 22 9.4% Responsible for grandchildren214 90.6% Not responsible for grandchildrenWhite alone, not Hispanic / Latino 105 100.0% Not responsible for grandchildren