Races in Mayfield Heights, Ohio (OH) Detailed Stats
Data:
Races - White alone (%)
Races - White alone (% change since 2000)
Races - Black alone (%)
Races - Black alone (% change since 2000)
Races - American Indian alone (%)
Races - American Indian alone (% change since 2000)
Races - Asian alone (%)
Races - Asian alone (% change since 2000)
Races - Hispanic (%)
Races - Hispanic (% change since 2000)
Races - Native Hawaiian and Other Pacific Islander alone (%)
Races - Native Hawaiian and Other Pacific Islander alone (% change since 2000)
Races - Two or more races(%)
Races - Two or more races(% change since 2000)
Races - Other race alone (%)
Races - Other race alone (% change since 2000)
Racial diversity
Place of birth - Born in state of residence (%)
Place of birth - Born in state of residence (%) - White
Place of birth - Born in state of residence (%) - Black or African American
Place of birth - Born in state of residence (%) - Asian
Place of birth - Born in state of residence (%) - Hispanic or Latino
Place of birth - Born in state of residence (%) - American Indian and Alaska Native
Place of birth - Born in state of residence (%) - Multirace
Place of birth - Born in state of residence (%) - Other Race
Place of birth - Born in other state (%)
Place of birth - Born in other state (%) - White
Place of birth - Born in other state (%) - Black or African American
Place of birth - Born in other state (%) - Asian
Place of birth - Born in other state (%) - Hispanic or Latino
Place of birth - Born in other state (%) - American Indian and Alaska Native
Place of birth - Born in other state (%) - Multirace
Place of birth - Born in other state (%) - Other Race
Place of birth - Native, outside of US (%)
Place of birth - Native, outside of US (%) - White
Place of birth - Native, outside of US (%) - Black or African American
Place of birth - Native, outside of US (%) - Asian
Place of birth - Native, outside of US (%) - Hispanic or Latino
Place of birth - Native, outside of US (%) - American Indian and Alaska Native
Place of birth - Native, outside of US (%) - Multirace
Place of birth - Native, outside of US (%) - Other Race
Place of birth - Foreign born (%)
Place of birth - Foreign born (%) - White
Place of birth - Foreign born (%) - Black or African American
Place of birth - Foreign born (%) - Asian
Place of birth - Foreign born (%) - Hispanic or Latino
Place of birth - Foreign born (%) - American Indian and Alaska Native
Place of birth - Foreign born (%) - Multirace
Place of birth - Foreign born (%) - Other Race
Residents speaking English at home (%)
Residents speaking English at home - Born in the United States (%)
Residents speaking English at home - Native, born elsewhere (%)
Residents speaking English at home - Foreign born (%)
Residents speaking Spanish at home (%)
Residents speaking Spanish at home - Born in the United States (%)
Residents speaking Spanish at home - Native, born elsewhere (%)
Residents speaking Spanish at home - Foreign born (%)
Residents speaking other language at home (%)
Residents speaking other language at home - Born in the United States (%)
Residents speaking other language at home - Native, born elsewhere (%)
Residents speaking other language at home - Foreign born (%)
Marital status - Never married (%)
Marital status - Now married (%)
Marital status - Separated (%)
Marital status - Widowed (%)
Marital status - Divorced (%)
Ancestries Reported - Arab (%)
Ancestries Reported - Czech (%)
Ancestries Reported - Danish (%)
Ancestries Reported - Dutch (%)
Ancestries Reported - English (%)
Ancestries Reported - French (%)
Ancestries Reported - French Canadian (%)
Ancestries Reported - German (%)
Ancestries Reported - Greek (%)
Ancestries Reported - Hungarian (%)
Ancestries Reported - Irish (%)
Ancestries Reported - Italian (%)
Ancestries Reported - Lithuanian (%)
Ancestries Reported - Norwegian (%)
Ancestries Reported - Polish (%)
Ancestries Reported - Portuguese (%)
Ancestries Reported - Russian (%)
Ancestries Reported - Scotch-Irish (%)
Ancestries Reported - Scottish (%)
Ancestries Reported - Slovak (%)
Ancestries Reported - Subsaharan African (%)
Ancestries Reported - Swedish (%)
Ancestries Reported - Swiss (%)
Ancestries Reported - Ukrainian (%)
Ancestries Reported - United States (%)
Ancestries Reported - Welsh (%)
Ancestries Reported - West Indian (%)
Ancestries Reported - Other (%)
Geographical mobility - Same house 1 year ago (%)
Geographical mobility - Same house 1 year ago (%) - White
Geographical mobility - Same house 1 year ago (%) - Black or African American
Geographical mobility - Same house 1 year ago (%) - Asian
Geographical mobility - Same house 1 year ago (%) - Hispanic or Latino
Geographical mobility - Same house 1 year ago (%) - American Indian and Alaska Native
Geographical mobility - Same house 1 year ago (%) - Multirace
Geographical mobility - Same house 1 year ago (%) - Other Race
Geographical mobility - Moved within same county (%)
Geographical mobility - Moved within same county (%) - White
Geographical mobility - Moved within same county (%) - Black or African American
Geographical mobility - Moved within same county (%) - Asian
Geographical mobility - Moved within same county (%) - Hispanic or Latino
Geographical mobility - Moved within same county (%) - American Indian and Alaska Native
Geographical mobility - Moved within same county (%) - Multirace
Geographical mobility - Moved within same county (%) - Other Race
Geographical mobility - Moved from different county within same state (%)
Geographical mobility - Moved from different county within same state (%) - White
Geographical mobility - Moved from different county within same state (%) - Black or African American
Geographical mobility - Moved from different county within same state (%) - Asian
Geographical mobility - Moved from different county within same state (%) - Hispanic or Latino
Geographical mobility - Moved from different county within same state (%) - American Indian and Alaska Native
Geographical mobility - Moved from different county within same state (%) - Multirace
Geographical mobility - Moved from different county within same state (%) - Other Race
Geographical mobility - Moved from different state (%)
Geographical mobility - Moved from different state (%) - White
Geographical mobility - Moved from different state (%) - Black or African American
Geographical mobility - Moved from different state (%) - Asian
Geographical mobility - Moved from different state (%) - Hispanic or Latino
Geographical mobility - Moved from different state (%) - American Indian and Alaska Native
Geographical mobility - Moved from different state (%) - Multirace
Geographical mobility - Moved from different state (%) - Other Race
Geographical mobility - Moved from abroad (%)
Geographical mobility - Moved from abroad (%) - White
Geographical mobility - Moved from abroad (%) - Black or African American
Geographical mobility - Moved from abroad (%) - Asian
Geographical mobility - Moved from abroad (%) - Hispanic or Latino
Geographical mobility - Moved from abroad (%) - American Indian and Alaska Native
Geographical mobility - Moved from abroad (%) - Multirace
Geographical mobility - Moved from abroad (%) - Other Race
Place of birth for the foreign-born population - Ireland (%)
Place of birth for the foreign-born population - Denmark (%)
Place of birth for the foreign-born population - Norway (%)
Place of birth for the foreign-born population - Sweden (%)
Place of birth for the foreign-born population - United Kingdom (%)
Place of birth for the foreign-born population - England (%)
Place of birth for the foreign-born population - Scotland (%)
Place of birth for the foreign-born population - Other Northern Europe (%)
Place of birth for the foreign-born population - Austria (%)
Place of birth for the foreign-born population - Belgium (%)
Place of birth for the foreign-born population - France (%)
Place of birth for the foreign-born population - Germany (%)
Place of birth for the foreign-born population - Netherlands (%)
Place of birth for the foreign-born population - Switzerland (%)
Place of birth for the foreign-born population - Other Western Europe (%)
Place of birth for the foreign-born population - Greece (%)
Place of birth for the foreign-born population - Italy (%)
Place of birth for the foreign-born population - Portugal (%)
Place of birth for the foreign-born population - Spain (%)
Place of birth for the foreign-born population - Other Southern Europe (%)
Place of birth for the foreign-born population - Albania (%)
Place of birth for the foreign-born population - Belarus (%)
Place of birth for the foreign-born population - Bosnia and Herzegovina (%)
Place of birth for the foreign-born population - Bulgaria (%)
Place of birth for the foreign-born population - Croatia (%)
Place of birth for the foreign-born population - Czechoslovakia (%)
Place of birth for the foreign-born population - Hungary (%)
Place of birth for the foreign-born population - Latvia (%)
Place of birth for the foreign-born population - Lithuania (%)
Place of birth for the foreign-born population - North Macedonia (Macedonia) (%)
Place of birth for the foreign-born population - Moldova (%)
Place of birth for the foreign-born population - Poland (%)
Place of birth for the foreign-born population - Romania (%)
Place of birth for the foreign-born population - Russia (%)
Place of birth for the foreign-born population - Serbia (%)
Place of birth for the foreign-born population - Ukraine (%)
Place of birth for the foreign-born population - Other Eastern Europe (%)
Place of birth for the foreign-born population - China (%)
Place of birth for the foreign-born population - Hong Kong (%)
Place of birth for the foreign-born population - Taiwan (%)
Place of birth for the foreign-born population - Japan (%)
Place of birth for the foreign-born population - Korea (%)
Place of birth for the foreign-born population - Other Eastern Asia (%)
Place of birth for the foreign-born population - Afghanistan (%)
Place of birth for the foreign-born population - Bangladesh (%)
Place of birth for the foreign-born population - India (%)
Place of birth for the foreign-born population - Iran (%)
Place of birth for the foreign-born population - Kazakhstan (%)
Place of birth for the foreign-born population - Nepal (%)
Place of birth for the foreign-born population - Pakistan (%)
Place of birth for the foreign-born population - Sri Lanka (%)
Place of birth for the foreign-born population - Uzbekistan (%)
Place of birth for the foreign-born population - Other South Central Asia (%)
Place of birth for the foreign-born population - Burma (%)
Place of birth for the foreign-born population - Cambodia (%)
Place of birth for the foreign-born population - Indonesia (%)
Place of birth for the foreign-born population - Laos (%)
Place of birth for the foreign-born population - Malaysia (%)
Place of birth for the foreign-born population - Philippines (%)
Place of birth for the foreign-born population - Singapore (%)
Place of birth for the foreign-born population - Thailand (%)
Place of birth for the foreign-born population - Vietnam (%)
Place of birth for the foreign-born population - Other South Eastern Asia (%)
Place of birth for the foreign-born population - Armenia (%)
Place of birth for the foreign-born population - Iraq (%)
Place of birth for the foreign-born population - Israel (%)
Place of birth for the foreign-born population - Jordan (%)
Place of birth for the foreign-born population - Kuwait (%)
Place of birth for the foreign-born population - Lebanon (%)
Place of birth for the foreign-born population - Saudi Arabia (%)
Place of birth for the foreign-born population - Syria (%)
Place of birth for the foreign-born population - Turkey (%)
Place of birth for the foreign-born population - Yemen (%)
Place of birth for the foreign-born population - Other Western Asia (%)
Place of birth for the foreign-born population - Eritrea (%)
Place of birth for the foreign-born population - Ethiopia (%)
Place of birth for the foreign-born population - Kenya (%)
Place of birth for the foreign-born population - Somalia (%)
Place of birth for the foreign-born population - Uganda (%)
Place of birth for the foreign-born population - Zimbabwe (%)
Place of birth for the foreign-born population - Other Eastern Africa (%)
Place of birth for the foreign-born population - Cameroon (%)
Place of birth for the foreign-born population - Congo (%)
Place of birth for the foreign-born population - Democratic Republic of Congo (Zaire) (%)
Place of birth for the foreign-born population - Other Middle Africa (%)
Place of birth for the foreign-born population - Egypt (%)
Place of birth for the foreign-born population - Morocco (%)
Place of birth for the foreign-born population - Sudan (%)
Place of birth for the foreign-born population - Other Northern Africa (%)
Place of birth for the foreign-born population - South Africa (%)
Place of birth for the foreign-born population - Other Southern Africa (%)
Place of birth for the foreign-born population - Cabo Verde (%)
Place of birth for the foreign-born population - Ghana (%)
Place of birth for the foreign-born population - Liberia (%)
Place of birth for the foreign-born population - Nigeria (%)
Place of birth for the foreign-born population - Senegal (%)
Place of birth for the foreign-born population - Sierra Leone (%)
Place of birth for the foreign-born population - Other Western Africa (%)
Place of birth for the foreign-born population - Australia (%)
Place of birth for the foreign-born population - New Zealand (%)
Place of birth for the foreign-born population - Fiji (%)
Place of birth for the foreign-born population - Micronesia (%)
Place of birth for the foreign-born population - Bahamas (%)
Place of birth for the foreign-born population - Barbados (%)
Place of birth for the foreign-born population - Cuba (%)
Place of birth for the foreign-born population - Dominica (%)
Place of birth for the foreign-born population - Dominican Republic (%)
Place of birth for the foreign-born population - Grenada (%)
Place of birth for the foreign-born population - Haiti (%)
Place of birth for the foreign-born population - Jamaica (%)
Place of birth for the foreign-born population - St. Vincent and the Grenadines (%)
Place of birth for the foreign-born population - Trinidad and Tobago (%)
Place of birth for the foreign-born population - West Indies (%)
Place of birth for the foreign-born population - Other Caribbean (%)
Place of birth for the foreign-born population - Belize (%)
Place of birth for the foreign-born population - Costa Rica (%)
Place of birth for the foreign-born population - El Salvador (%)
Place of birth for the foreign-born population - Guatemala (%)
Place of birth for the foreign-born population - Honduras (%)
Place of birth for the foreign-born population - Mexico (%)
Place of birth for the foreign-born population - Nicaragua (%)
Place of birth for the foreign-born population - Panama (%)
Place of birth for the foreign-born population - Other Central America (%)
Place of birth for the foreign-born population - Argentina (%)
Place of birth for the foreign-born population - Bolivia (%)
Place of birth for the foreign-born population - Brazil (%)
Place of birth for the foreign-born population - Chile (%)
Place of birth for the foreign-born population - Colombia (%)
Place of birth for the foreign-born population - Ecuador (%)
Place of birth for the foreign-born population - Guyana (%)
Place of birth for the foreign-born population - Peru (%)
Place of birth for the foreign-born population - Uruguay (%)
Place of birth for the foreign-born population - Venezuela (%)
Place of birth for the foreign-born population - Other South America (%)
Place of birth for the foreign-born population - Canada (%)
Place of birth for the foreign-born population - Other Northern America (%)
Place of birth for the foreign-born population - Other (%)
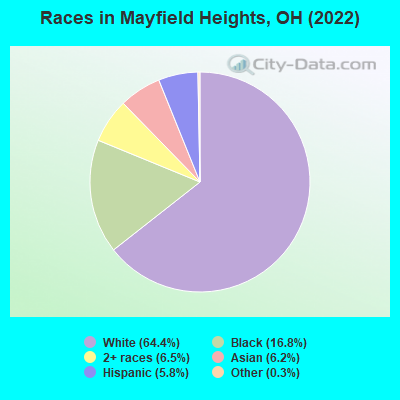
According to 2022 data, the most numerous races in Mayfield Heights, OH are White alone (12,756 residents), Black alone (3,317 residents), and Two or more races (1,295 residents). 76.5% of Mayfield Heights residents speak English at home. 18.9% of Mayfield Heights, OH residents are foreign-born (8.8% born in Asia, 7.9% born in Europe), which is 78.8% greater than the foreign-born rate of 4.0% across the entire state of Ohio.
Race distribution in Mayfield Heights
2000 2022
9,538,111 84.0% White alone 1,290,662 11.4% Black alone 217,123 1.9% Hispanic 137,770 1.2% Two or more races 131,670 1.2% Asian alone 21,985 0.2% American Indian alone 13,483 0.1% Other race alone 2,336 0.02% Native Hawaiian and Other
8,948,793 76.1% White alone 1,401,403 11.9% Black alone 529,291 4.5% Two or more races 517,232 4.4% Hispanic 293,387 2.5% Asian alone 52,805 0.4% Other race alone 9,785 0.08% American Indian alone 3,362 0.03% Native Hawaiian and Other
Income and house value in Mayfield Heights Median household income in 2022 $68,043 White non-Hispanic householders$35,821 Black householders$83,233 Asian householders$31,334 Some other race householders$85,863 Hispanic or Latino race householdersMedian 2022 house value $199,912 White Non-Hispanic householders$156,102 Black or African American householders $200,228 Asian householders$86,987 Some other race householders$159,898 Two or more races householders$86,987 Hispanic or Latino householders
Median age by race in Mayfield Heights
45.9 Median age for White residents40.6 50.5 36.6 Median age for Black or African American residents33.1 41.6 -545,601,290.8 Median age for American Indian / Alaska Native residents-734,374,999.3 -499,999,999.5 33.6 Median age for Asian residents36.9 31.9 -706,093,189.3 Median age for Native Hawaiian / Pacific Islander residents-750,242,953.6 -805,394,989.6 41.7 Median age for Other race residents37.9 42.1 28.4 Median age for Two or more races residents36.9 14.9 47.1 Median age for White alone residents41.3 51.2 34.6 Median age for Hispanic or Latino residents36.1 30.1
Owner/renter occupied households by race in Mayfield Heights
House owners and renters - White residents 3,988 56.6% Owner occupied3,060 43.4% Renter occupiedHouse owners and renters - Black or African American residents 179 10.3% Owner occupied1,557 89.7% Renter occupiedHouse owners and renters - Asian residents 117 27.1% Owner occupied314 72.9% Renter occupiedHouse owners and renters - Other race residents 37 31.3% Owner occupied81 68.7% Renter occupiedHouse owners and renters - Two or more races residents 325 50.0% Owner occupied326 50.0% Renter occupiedHouse owners and renters - White alone residents 3,960 56.5% Owner occupied3,051 43.5% Renter occupiedHouse owners and renters - Hispanic or Latino residents 258 57.3% Owner occupied192 42.7% Renter occupied
Language usage in Mayfield Heights
English speakers - Total 76.5% of residents of Mayfield Heights speak English at home.
4.2% of residents speak Spanish at home 626 80.7% Speak English very well150 19.3% Speak English less than very well19.1% of residents speak other language at home 1,609 45.3% Speak English very well1,940 54.7% Speak English less than very well
English speakers - Born in the United States 82.6% of residents of Mayfield Heights speak English at home.
11.5% of residents speak Spanish at home 338 100.0% Speak English very well4.3% of residents speak other language at home 111 87.4% Speak English very well16 12.6% Speak English less than very well
English speakers - Native, born elsewhere 63.2% of residents of Mayfield Heights speak English at home.
16.4% of residents speak Spanish at home 28 100.0% Speak English very well14.6% of residents speak other language at home 25 100.0% Speak English very well
English speakers - Foreign-born 7.9% of residents of Mayfield Heights speak English at home.
6.7% of residents speak Spanish at home 57 24.4% Speak English very well177 75.6% Speak English less than very well83.3% of residents speak other language at home 1,198 40.9% Speak English very well1,730 59.1% Speak English less than very well
White (Caucasian) - Speak only English Native:
95.9% (10,014)Foreign-born:
10.1% (176)
White (Caucasian) - Speak another language Native:
4.1% (429)Foreign-born:
89.5% (1,559)
Black or African American - Speak only English Native:
96.4% (3,002)Foreign-born:
15.3% (15)
Black or African American - Speak another language Native:
2.9% (92)Foreign-born:
90.3% (88)
Asian - Speak only English Native:
16.3% (25)Foreign-born:
7.4% (69)
Asian - Speak another language Native:
87.7% (134)Foreign-born:
92.5% (863)
Other race - Speak only English Native:
62.7% (53)Foreign-born:
7.3% (9)
Other race - Speak another language Native:
26.3% (22)Foreign-born:
100.0% (118)
Two or more races - Speak only English Native:
67.4% (890)Foreign-born:
2.6% (18)
Two or more races - Speak another language Native:
34.2% (451)Foreign-born:
98.3% (665)
White alone - Speak only English Native:
96.1% (9,855)Foreign-born:
9.8% (171)
White alone - Speak another language Native:
3.9% (404)Foreign-born:
90.3% (1,579)
Hispanic or Latino - Speak only English Native:
35.3% (275)Foreign-born:
2.6% (6)
Hispanic or Latino - Speak another language Native:
64.1% (498)Foreign-born:
98.9% (231)
Foreign-born residents in Mayfield Heights 3,736 residents are foreign born (8.8% Asia , 7.9% Europe ).
Marital status for residents in Mayfield Heights Marital status - White (Caucasian) population 15 years and over
Males 33.2% Never married49.0% Now married1.7% Separated4.3% Widowed11.8% DivorcedFemales 23.1% Never married42.3% Now married0.8% Separated14.5% Widowed19.3% DivorcedWomen who gave birth in the past 12 months Now married:
96.2% (216)Unmarried:
3.8% (8)
Women who did not give birth in the past 12 months Now married:
45.3% (1,170)Unmarried:
54.7% (1,413)
Marital status - Black or African American population 15 years and over
Males 51.5% Never married35.1% Now married1.5% Separated0.9% Widowed11.1% DivorcedFemales 46.5% Never married7.9% Now married0.0% Separated4.4% Widowed41.1% DivorcedWomen who gave birth in the past 12 months Now married:
100.0% (9)Unmarried:
0.0% (0)
Women who did not give birth in the past 12 months Now married:
7.5% (71)Unmarried:
92.5% (873)
Marital status - Asian population 15 years and over
Males 25.1% Never married61.3% Now married1.4% Separated7.2% Widowed5.0% DivorcedFemales 12.0% Never married64.3% Now married0.0% Separated7.6% Widowed16.1% DivorcedWomen who gave birth in the past 12 months Now married:
100.0% (7)Unmarried:
0.0% (0)
Women who did not give birth in the past 12 months Now married:
71.5% (211)Unmarried:
28.5% (84)
Marital status - Other race population 15 years and over
Males 15.9% Never married69.3% Now married0.0% Separated4.5% Widowed10.2% DivorcedFemales 12.9% Never married56.5% Now married0.0% Separated0.0% Widowed30.6% DivorcedWomen who did not give birth in the past 12 months Now married:
81.4% (50)Unmarried:
18.6% (11)
Marital status - Two or more races population 15 years and over
Males 17.8% Never married72.1% Now married0.0% Separated0.0% Widowed10.1% DivorcedFemales 21.5% Never married46.0% Now married0.0% Separated7.2% Widowed25.3% DivorcedWomen who gave birth in the past 12 months Now married:
45.8% (13)Unmarried:
54.2% (15)
Women who did not give birth in the past 12 months Now married:
65.0% (203)Unmarried:
35.0% (109)
Marital status - White alone, not Hispanic / Latino population 15 years and over
Males 33.7% Never married48.1% Now married1.8% Separated4.4% Widowed12.0% DivorcedFemales 23.3% Never married41.6% Now married0.8% Separated14.7% Widowed19.5% DivorcedWomen who gave birth in the past 12 months Now married:
96.2% (222)Unmarried:
3.8% (9)
Women who did not give birth in the past 12 months Now married:
43.7% (1,119)Unmarried:
56.3% (1,441)
Marital status - Hispanic or Latino population 15 years and over
Males 13.2% Never married84.0% Now married0.0% Separated0.8% Widowed2.0% DivorcedFemales 14.6% Never married72.8% Now married0.0% Separated0.0% Widowed12.6% DivorcedWomen who gave birth in the past 12 months Now married:
100.0% (11)Unmarried:
0.0% (0)
Women who did not give birth in the past 12 months Now married:
82.6% (223)Unmarried:
17.4% (47)
Ancestries in Mayfield Heights
1,394 13.4% Italian658 6.3% German453 4.3% Irish433 4.2% Russian268 2.6% American239 2.3% Romanian227 2.2% Polish146 1.4% Armenian137 1.3% European132 1.3% Ukrainian126 1.2% Hungarian117 1.1% Eastern European115 1.1% Greek97 0.9% English76 0.7% French70 0.7% Yugoslavian58 0.6% Czech48 0.5% Ghanaian48 0.5% African37 0.4% Swedish35 0.3% Syrian33 0.3% Lebanese33 0.3% French Canadian31 0.3% Swiss30 0.3% Israeli25 0.2% Canadian24 0.2% Croatian24 0.2% Welsh21 0.2% British20 0.2% Slavic19 0.2% Slovene19 0.2% Lithuanian19 0.2% Czechoslovakian19 0.2% Albanian17 0.2% Slovak17 0.2% Nigerian15 0.1% Scottish12 0.1% Scotch-Irish12 0.1% Serbian10 0.10% Iranian9 0.09% Portuguese
Children Nativity (place of birth) in Mayfield Heights
Children under 6 years - Living with two parents Both parents native 779 100.0% NativeBoth parents foreign-born 173 58.7% Native122 41.3% Foreign-bornOne native, one foreign-born parent 83 100.0% NativeChildren under 6 years - Living with one parent Native parent 209 100.0% NativeForeign-born parent 24 100.0% NativeChildren 6 to 17 years - Living with two parents Both parents native 927 100.0% NativeBoth parents foreign-born 97 36.0% Native172 64.0% Foreign-bornOne native, one foreign-born parent 113 100.0% NativeChildren 6 to 17 years - Living with one parent Native parent 623 82.4% Native133 17.6% Foreign-bornForeign-born parent 131 87.4% Native19 12.6% Foreign-born
Grandparents responsible for own grandchildren in Mayfield Heights
Grandparents (30 to 59 years) White / Caucasian 4 30.9% Responsible for grandchildren9 69.1% Not responsible for grandchildrenAsian 31 100.0% Not responsible for grandchildrenWhite alone, not Hispanic / Latino 4 32.2% Responsible for grandchildren9 67.8% Not responsible for grandchildrenGrandparents (60 years and over) White / Caucasian 1 2.8% Responsible for grandchildren41 97.2% Not responsible for grandchildrenAsian 4 31.6% Responsible for grandchildren9 68.4% Not responsible for grandchildrenWhite alone, not Hispanic / Latino 1 2.8% Responsible for grandchildren43 97.2% Not responsible for grandchildren