Races in McKeesport, Pennsylvania (PA) Detailed Stats
Data:
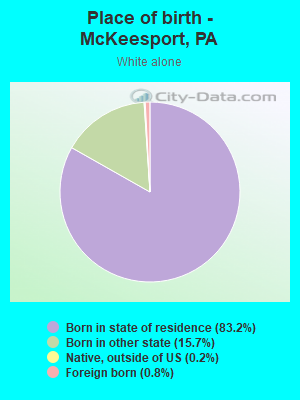
Races - White alone (%)
Races - White alone (% change since 2000)
Races - Black alone (%)
Races - Black alone (% change since 2000)
Races - American Indian alone (%)
Races - American Indian alone (% change since 2000)
Races - Asian alone (%)
Races - Asian alone (% change since 2000)
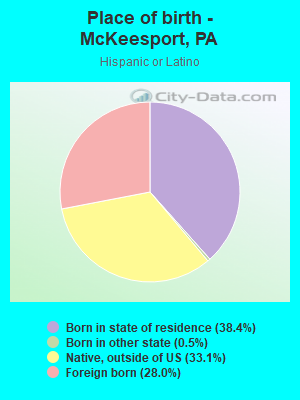
Races - Hispanic (%)
Races - Hispanic (% change since 2000)
Races - Native Hawaiian and Other Pacific Islander alone (%)
Races - Native Hawaiian and Other Pacific Islander alone (% change since 2000)
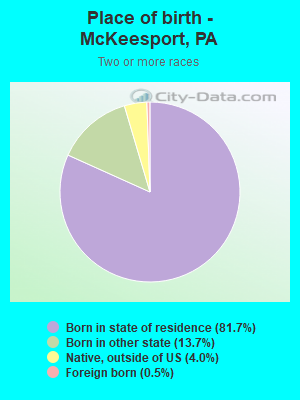
Races - Two or more races(%)
Races - Two or more races(% change since 2000)
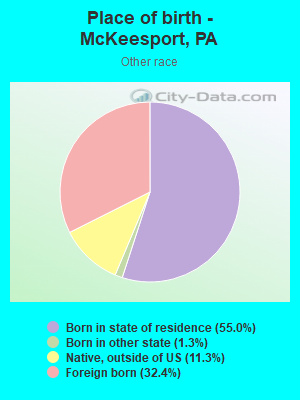
Races - Other race alone (%)
Races - Other race alone (% change since 2000)
Racial diversity
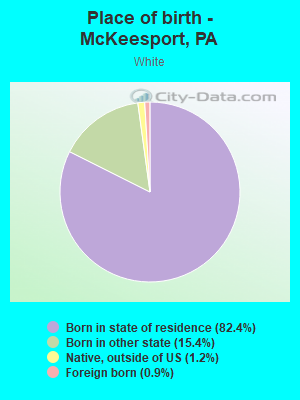
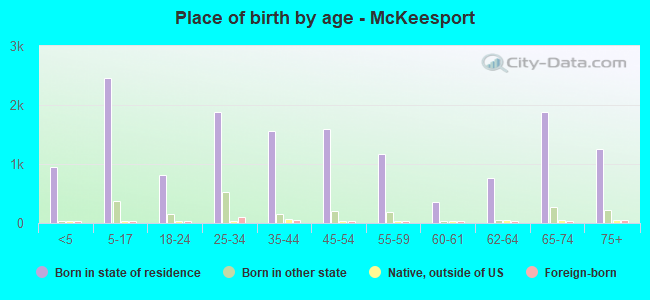
Place of birth - Born in state of residence (%)
Place of birth - Born in state of residence (%) - White
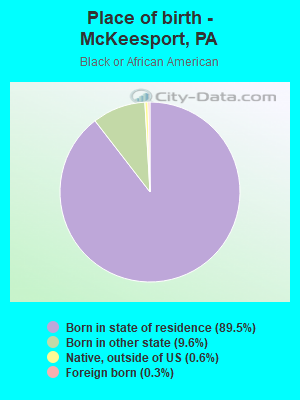
Place of birth - Born in state of residence (%) - Black or African American
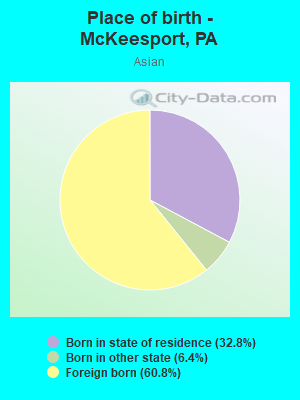
Place of birth - Born in state of residence (%) - Asian
Place of birth - Born in state of residence (%) - Hispanic or Latino
Place of birth - Born in state of residence (%) - American Indian and Alaska Native
Place of birth - Born in state of residence (%) - Multirace
Place of birth - Born in state of residence (%) - Other Race
Place of birth - Born in other state (%)
Place of birth - Born in other state (%) - White
Place of birth - Born in other state (%) - Black or African American
Place of birth - Born in other state (%) - Asian
Place of birth - Born in other state (%) - Hispanic or Latino
Place of birth - Born in other state (%) - American Indian and Alaska Native
Place of birth - Born in other state (%) - Multirace
Place of birth - Born in other state (%) - Other Race
Place of birth - Native, outside of US (%)
Place of birth - Native, outside of US (%) - White
Place of birth - Native, outside of US (%) - Black or African American
Place of birth - Native, outside of US (%) - Asian
Place of birth - Native, outside of US (%) - Hispanic or Latino
Place of birth - Native, outside of US (%) - American Indian and Alaska Native
Place of birth - Native, outside of US (%) - Multirace
Place of birth - Native, outside of US (%) - Other Race
Place of birth - Foreign born (%)
Place of birth - Foreign born (%) - White
Place of birth - Foreign born (%) - Black or African American
Place of birth - Foreign born (%) - Asian
Place of birth - Foreign born (%) - Hispanic or Latino
Place of birth - Foreign born (%) - American Indian and Alaska Native
Place of birth - Foreign born (%) - Multirace
Place of birth - Foreign born (%) - Other Race
Residents speaking English at home (%)
Residents speaking English at home - Born in the United States (%)
Residents speaking English at home - Native, born elsewhere (%)
Residents speaking English at home - Foreign born (%)
Residents speaking Spanish at home (%)
Residents speaking Spanish at home - Born in the United States (%)
Residents speaking Spanish at home - Native, born elsewhere (%)
Residents speaking Spanish at home - Foreign born (%)
Residents speaking other language at home (%)
Residents speaking other language at home - Born in the United States (%)
Residents speaking other language at home - Native, born elsewhere (%)
Residents speaking other language at home - Foreign born (%)
Marital status - Never married (%)
Marital status - Now married (%)
Marital status - Separated (%)
Marital status - Widowed (%)
Marital status - Divorced (%)
Ancestries Reported - Arab (%)
Ancestries Reported - Czech (%)
Ancestries Reported - Danish (%)
Ancestries Reported - Dutch (%)
Ancestries Reported - English (%)
Ancestries Reported - French (%)
Ancestries Reported - French Canadian (%)
Ancestries Reported - German (%)
Ancestries Reported - Greek (%)
Ancestries Reported - Hungarian (%)
Ancestries Reported - Irish (%)
Ancestries Reported - Italian (%)
Ancestries Reported - Lithuanian (%)
Ancestries Reported - Norwegian (%)
Ancestries Reported - Polish (%)
Ancestries Reported - Portuguese (%)
Ancestries Reported - Russian (%)
Ancestries Reported - Scotch-Irish (%)
Ancestries Reported - Scottish (%)
Ancestries Reported - Slovak (%)
Ancestries Reported - Subsaharan African (%)
Ancestries Reported - Swedish (%)
Ancestries Reported - Swiss (%)
Ancestries Reported - Ukrainian (%)
Ancestries Reported - United States (%)
Ancestries Reported - Welsh (%)
Ancestries Reported - West Indian (%)
Ancestries Reported - Other (%)
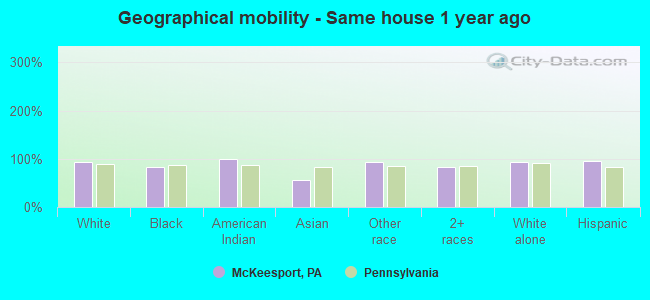
Geographical mobility - Same house 1 year ago (%)
Geographical mobility - Same house 1 year ago (%) - White
Geographical mobility - Same house 1 year ago (%) - Black or African American
Geographical mobility - Same house 1 year ago (%) - Asian
Geographical mobility - Same house 1 year ago (%) - Hispanic or Latino
Geographical mobility - Same house 1 year ago (%) - American Indian and Alaska Native
Geographical mobility - Same house 1 year ago (%) - Multirace
Geographical mobility - Same house 1 year ago (%) - Other Race
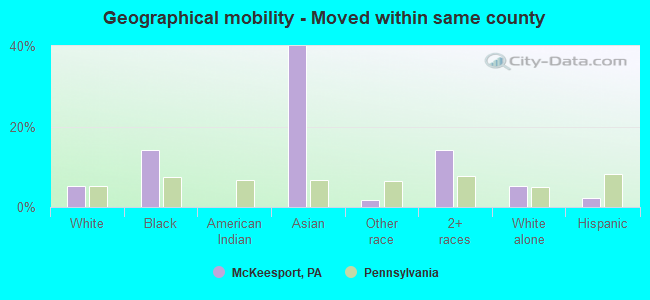
Geographical mobility - Moved within same county (%)
Geographical mobility - Moved within same county (%) - White
Geographical mobility - Moved within same county (%) - Black or African American
Geographical mobility - Moved within same county (%) - Asian
Geographical mobility - Moved within same county (%) - Hispanic or Latino
Geographical mobility - Moved within same county (%) - American Indian and Alaska Native
Geographical mobility - Moved within same county (%) - Multirace
Geographical mobility - Moved within same county (%) - Other Race
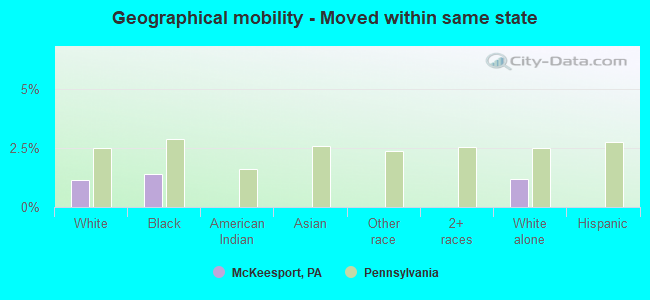
Geographical mobility - Moved from different county within same state (%)
Geographical mobility - Moved from different county within same state (%) - White
Geographical mobility - Moved from different county within same state (%) - Black or African American
Geographical mobility - Moved from different county within same state (%) - Asian
Geographical mobility - Moved from different county within same state (%) - Hispanic or Latino
Geographical mobility - Moved from different county within same state (%) - American Indian and Alaska Native
Geographical mobility - Moved from different county within same state (%) - Multirace
Geographical mobility - Moved from different county within same state (%) - Other Race
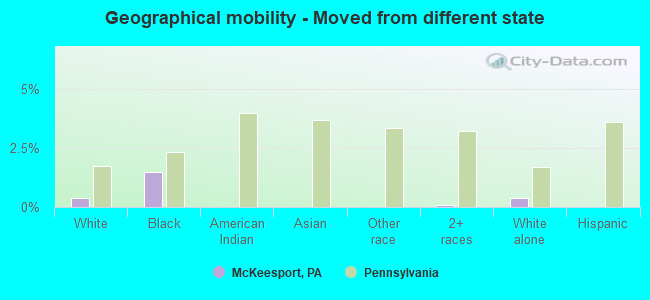
Geographical mobility - Moved from different state (%)
Geographical mobility - Moved from different state (%) - White
Geographical mobility - Moved from different state (%) - Black or African American
Geographical mobility - Moved from different state (%) - Asian
Geographical mobility - Moved from different state (%) - Hispanic or Latino
Geographical mobility - Moved from different state (%) - American Indian and Alaska Native
Geographical mobility - Moved from different state (%) - Multirace
Geographical mobility - Moved from different state (%) - Other Race
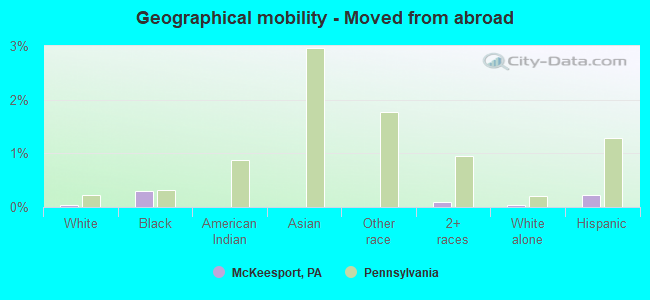
Geographical mobility - Moved from abroad (%)
Geographical mobility - Moved from abroad (%) - White
Geographical mobility - Moved from abroad (%) - Black or African American
Geographical mobility - Moved from abroad (%) - Asian
Geographical mobility - Moved from abroad (%) - Hispanic or Latino
Geographical mobility - Moved from abroad (%) - American Indian and Alaska Native
Geographical mobility - Moved from abroad (%) - Multirace
Geographical mobility - Moved from abroad (%) - Other Race
Place of birth for the foreign-born population - Ireland (%)
Place of birth for the foreign-born population - Denmark (%)
Place of birth for the foreign-born population - Norway (%)
Place of birth for the foreign-born population - Sweden (%)
Place of birth for the foreign-born population - United Kingdom (%)
Place of birth for the foreign-born population - England (%)
Place of birth for the foreign-born population - Scotland (%)
Place of birth for the foreign-born population - Other Northern Europe (%)
Place of birth for the foreign-born population - Austria (%)
Place of birth for the foreign-born population - Belgium (%)
Place of birth for the foreign-born population - France (%)
Place of birth for the foreign-born population - Germany (%)
Place of birth for the foreign-born population - Netherlands (%)
Place of birth for the foreign-born population - Switzerland (%)
Place of birth for the foreign-born population - Other Western Europe (%)
Place of birth for the foreign-born population - Greece (%)
Place of birth for the foreign-born population - Italy (%)
Place of birth for the foreign-born population - Portugal (%)
Place of birth for the foreign-born population - Spain (%)
Place of birth for the foreign-born population - Other Southern Europe (%)
Place of birth for the foreign-born population - Albania (%)
Place of birth for the foreign-born population - Belarus (%)
Place of birth for the foreign-born population - Bosnia and Herzegovina (%)
Place of birth for the foreign-born population - Bulgaria (%)
Place of birth for the foreign-born population - Croatia (%)
Place of birth for the foreign-born population - Czechoslovakia (%)
Place of birth for the foreign-born population - Hungary (%)
Place of birth for the foreign-born population - Latvia (%)
Place of birth for the foreign-born population - Lithuania (%)
Place of birth for the foreign-born population - North Macedonia (Macedonia) (%)
Place of birth for the foreign-born population - Moldova (%)
Place of birth for the foreign-born population - Poland (%)
Place of birth for the foreign-born population - Romania (%)
Place of birth for the foreign-born population - Russia (%)
Place of birth for the foreign-born population - Serbia (%)
Place of birth for the foreign-born population - Ukraine (%)
Place of birth for the foreign-born population - Other Eastern Europe (%)
Place of birth for the foreign-born population - China (%)
Place of birth for the foreign-born population - Hong Kong (%)
Place of birth for the foreign-born population - Taiwan (%)
Place of birth for the foreign-born population - Japan (%)
Place of birth for the foreign-born population - Korea (%)
Place of birth for the foreign-born population - Other Eastern Asia (%)
Place of birth for the foreign-born population - Afghanistan (%)
Place of birth for the foreign-born population - Bangladesh (%)
Place of birth for the foreign-born population - India (%)
Place of birth for the foreign-born population - Iran (%)
Place of birth for the foreign-born population - Kazakhstan (%)
Place of birth for the foreign-born population - Nepal (%)
Place of birth for the foreign-born population - Pakistan (%)
Place of birth for the foreign-born population - Sri Lanka (%)
Place of birth for the foreign-born population - Uzbekistan (%)
Place of birth for the foreign-born population - Other South Central Asia (%)
Place of birth for the foreign-born population - Burma (%)
Place of birth for the foreign-born population - Cambodia (%)
Place of birth for the foreign-born population - Indonesia (%)
Place of birth for the foreign-born population - Laos (%)
Place of birth for the foreign-born population - Malaysia (%)
Place of birth for the foreign-born population - Philippines (%)
Place of birth for the foreign-born population - Singapore (%)
Place of birth for the foreign-born population - Thailand (%)
Place of birth for the foreign-born population - Vietnam (%)
Place of birth for the foreign-born population - Other South Eastern Asia (%)
Place of birth for the foreign-born population - Armenia (%)
Place of birth for the foreign-born population - Iraq (%)
Place of birth for the foreign-born population - Israel (%)
Place of birth for the foreign-born population - Jordan (%)
Place of birth for the foreign-born population - Kuwait (%)
Place of birth for the foreign-born population - Lebanon (%)
Place of birth for the foreign-born population - Saudi Arabia (%)
Place of birth for the foreign-born population - Syria (%)
Place of birth for the foreign-born population - Turkey (%)
Place of birth for the foreign-born population - Yemen (%)
Place of birth for the foreign-born population - Other Western Asia (%)
Place of birth for the foreign-born population - Eritrea (%)
Place of birth for the foreign-born population - Ethiopia (%)
Place of birth for the foreign-born population - Kenya (%)
Place of birth for the foreign-born population - Somalia (%)
Place of birth for the foreign-born population - Uganda (%)
Place of birth for the foreign-born population - Zimbabwe (%)
Place of birth for the foreign-born population - Other Eastern Africa (%)
Place of birth for the foreign-born population - Cameroon (%)
Place of birth for the foreign-born population - Congo (%)
Place of birth for the foreign-born population - Democratic Republic of Congo (Zaire) (%)
Place of birth for the foreign-born population - Other Middle Africa (%)
Place of birth for the foreign-born population - Egypt (%)
Place of birth for the foreign-born population - Morocco (%)
Place of birth for the foreign-born population - Sudan (%)
Place of birth for the foreign-born population - Other Northern Africa (%)
Place of birth for the foreign-born population - South Africa (%)
Place of birth for the foreign-born population - Other Southern Africa (%)
Place of birth for the foreign-born population - Cabo Verde (%)
Place of birth for the foreign-born population - Ghana (%)
Place of birth for the foreign-born population - Liberia (%)
Place of birth for the foreign-born population - Nigeria (%)
Place of birth for the foreign-born population - Senegal (%)
Place of birth for the foreign-born population - Sierra Leone (%)
Place of birth for the foreign-born population - Other Western Africa (%)
Place of birth for the foreign-born population - Australia (%)
Place of birth for the foreign-born population - New Zealand (%)
Place of birth for the foreign-born population - Fiji (%)
Place of birth for the foreign-born population - Micronesia (%)
Place of birth for the foreign-born population - Bahamas (%)
Place of birth for the foreign-born population - Barbados (%)
Place of birth for the foreign-born population - Cuba (%)
Place of birth for the foreign-born population - Dominica (%)
Place of birth for the foreign-born population - Dominican Republic (%)
Place of birth for the foreign-born population - Grenada (%)
Place of birth for the foreign-born population - Haiti (%)
Place of birth for the foreign-born population - Jamaica (%)
Place of birth for the foreign-born population - St. Vincent and the Grenadines (%)
Place of birth for the foreign-born population - Trinidad and Tobago (%)
Place of birth for the foreign-born population - West Indies (%)
Place of birth for the foreign-born population - Other Caribbean (%)
Place of birth for the foreign-born population - Belize (%)
Place of birth for the foreign-born population - Costa Rica (%)
Place of birth for the foreign-born population - El Salvador (%)
Place of birth for the foreign-born population - Guatemala (%)
Place of birth for the foreign-born population - Honduras (%)
Place of birth for the foreign-born population - Mexico (%)
Place of birth for the foreign-born population - Nicaragua (%)
Place of birth for the foreign-born population - Panama (%)
Place of birth for the foreign-born population - Other Central America (%)
Place of birth for the foreign-born population - Argentina (%)
Place of birth for the foreign-born population - Bolivia (%)
Place of birth for the foreign-born population - Brazil (%)
Place of birth for the foreign-born population - Chile (%)
Place of birth for the foreign-born population - Colombia (%)
Place of birth for the foreign-born population - Ecuador (%)
Place of birth for the foreign-born population - Guyana (%)
Place of birth for the foreign-born population - Peru (%)
Place of birth for the foreign-born population - Uruguay (%)
Place of birth for the foreign-born population - Venezuela (%)
Place of birth for the foreign-born population - Other South America (%)
Place of birth for the foreign-born population - Canada (%)
Place of birth for the foreign-born population - Other Northern America (%)
Place of birth for the foreign-born population - Other (%)
Latest news about races in McKeesport, PA collected exclusively by city-data.com from local newspapers, TV, and radio stations
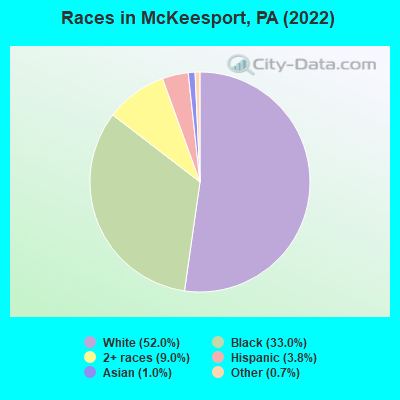
According to 2022 data, the most numerous races in McKeesport, PA are White alone (9,146 residents), Black alone (5,807 residents), and Hispanic (662 residents). 95.4% of McKeesport residents speak English at home. 2.3% of McKeesport, PA residents are foreign-born (1.2% born in Latin America, 0.7% born in Asia, 0.3% born in Europe), which is 199.4% less than the foreign-born rate of 7.0% across the entire state of Pennsylvania.
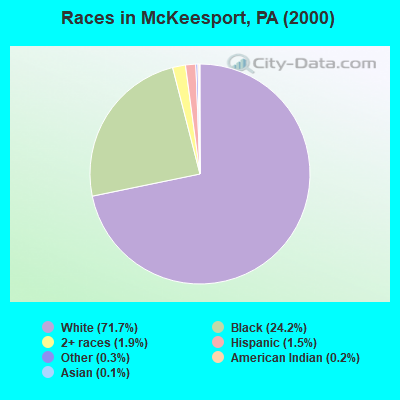
Race distribution in McKeesport
2000 2022
10,322,455 84.1% White alone 1,202,437 9.8% Black alone 394,088 3.2% Hispanic 218,296 1.8% Asian alone 113,097 0.9% Two or more races 13,086 0.1% Other race alone 14,904 0.1% American Indian alone 2,691 0.02% Native Hawaiian and Other
9,487,228 73.1% White alone 1,311,581 10.1% Black alone 1,115,997 8.6% Hispanic 493,942 3.8% Two or more races 487,124 3.8% Asian alone 63,582 0.5% Other race alone 10,130 0.08% American Indian alone 2,424 0.02% Native Hawaiian and Other
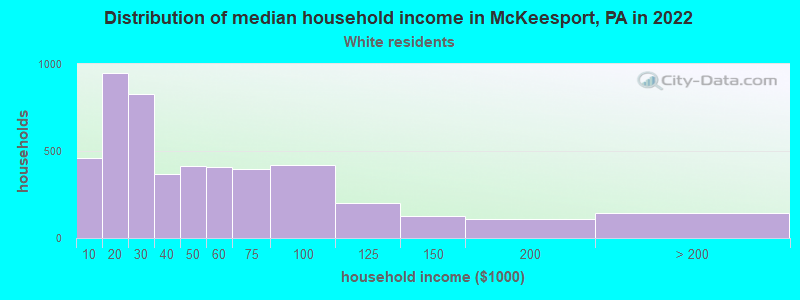
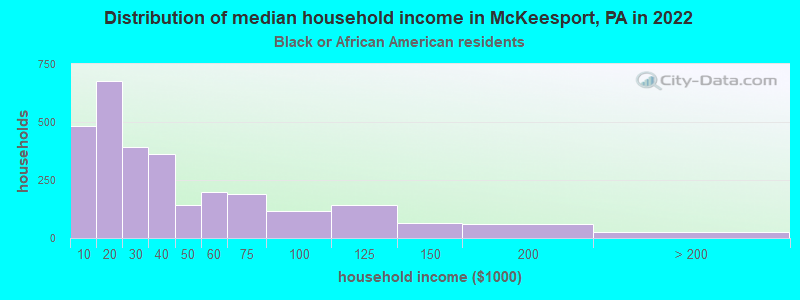
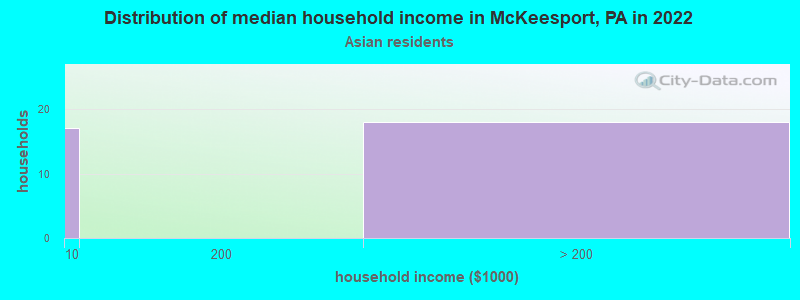
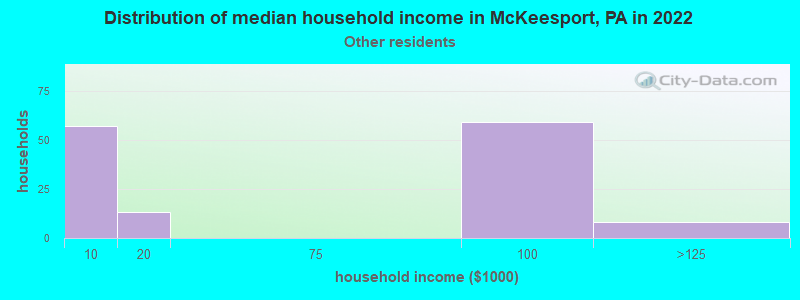
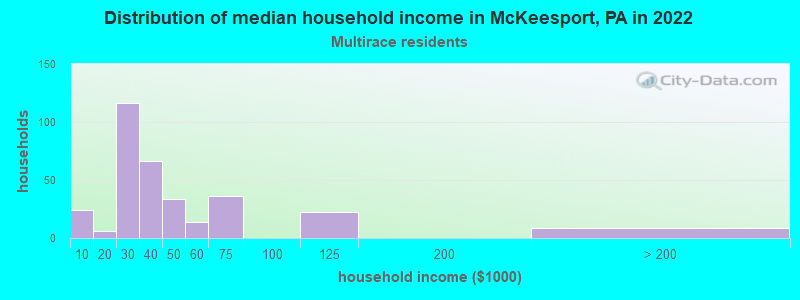
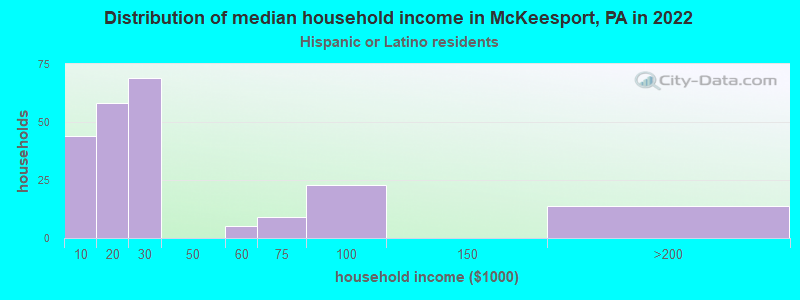
Income and house value in McKeesport Median household income in 2022 $35,481 White non-Hispanic householders$28,943 Black householders$33,972 Two or more races householders$26,913 Hispanic or Latino race householdersMedian 2022 house value $64,782 White Non-Hispanic householders$63,925 Black or African American householders$77,121 American Indian or Alaska Native householders $29,991 Asian householders$72,837 Some other race householders$64,268 Two or more races householders$111,398 Hispanic or Latino householders
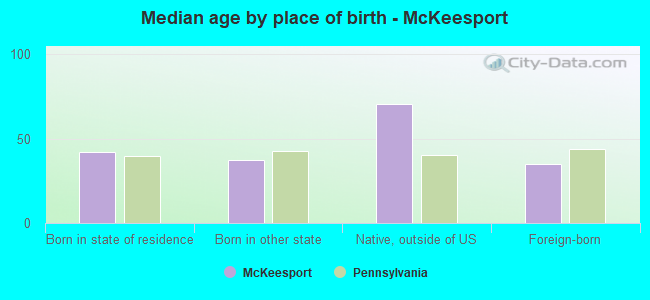
Median age by race in McKeesport
53.4 Median age for White residents54.0 52.8 36.8 Median age for Black or African American residents34.9 36.8 -642,857,142.2 Median age for American Indian / Alaska Native residents-714,583,332.6 -577,519,379.3 23.1 Median age for Asian residents22.2 23.4 -656,534,953.8 Median age for Native Hawaiian / Pacific Islander residents-919,148,935.3 -747,474,746.7 16.8 Median age for Other race residents34.1 13.2 22.6 Median age for Two or more races residents19.9 21.8 53.1 Median age for White alone residents53.6 52.3 35.0 Median age for Hispanic or Latino residents41.0 30.8
Owner/renter occupied households by race in McKeesport
House owners and renters - White residents 3,096 65.1% Owner occupied1,663 34.9% Renter occupiedHouse owners and renters - Black or African American residents 752 27.6% Owner occupied1,971 72.4% Renter occupiedHouse owners and renters - Asian residents 14 46.5% Owner occupied17 53.5% Renter occupiedHouse owners and renters - Other race residents 119 92.0% Owner occupied10 8.0% Renter occupiedHouse owners and renters - Two or more races residents 88 21.0% Owner occupied330 79.0% Renter occupiedHouse owners and renters - White alone residents 3,029 64.6% Owner occupied1,661 35.4% Renter occupiedHouse owners and renters - Hispanic or Latino residents 188 70.9% Owner occupied77 29.1% Renter occupied
Language usage in McKeesport
English speakers - Total 95.4% of residents of McKeesport speak English at home.
2.9% of residents speak Spanish at home 149 31.2% Speak English very well328 68.8% Speak English less than very well1.6% of residents speak other language at home 162 62.3% Speak English very well98 37.7% Speak English less than very well
English speakers - Born in the United States 97.2% of residents of McKeesport speak English at home.
1.3% of residents speak Spanish at home 30 100.0% Speak English very well
English speakers - Native, born elsewhere 17.5% of residents of McKeesport speak English at home.
91.1% of residents speak Spanish at home 224 100.0% Speak English less than very well
English speakers - Foreign-born 24.3% of residents of McKeesport speak English at home.
44.5% of residents speak Spanish at home 68 41.7% Speak English very well95 58.3% Speak English less than very well36.1% of residents speak other language at home 61 46.2% Speak English very well71 53.8% Speak English less than very well
White (Caucasian) - Speak only English Native:
97.2% (8,670)Foreign-born:
43.8% (38)
White (Caucasian) - Speak another language Native:
2.8% (248)Foreign-born:
56.7% (49)
Black or African American - Speak only English Native:
98.6% (5,417)Foreign-born:
100.0% (20)
Black or African American - Speak another language Native:
1.4% (75)Foreign-born:
15.4% (3)
Asian - Speak only English Native:
69.9% (53)Foreign-born:
21.7% (22)
Other race - Speak only English Native:
70.5% (124)Foreign-born:
3.3% (5)
Other race - Speak another language Native:
29.5% (52)Foreign-born:
98.5% (139)
Two or more races - Speak another language Native:
3.9% (63)Foreign-born:
100.0% (10)
White alone - Speak only English Native:
98.3% (8,658)Foreign-born:
49.7% (38)
White alone - Speak another language Native:
1.7% (152)Foreign-born:
50.2% (39)
Hispanic or Latino - Speak only English Native:
29.4% (100)Foreign-born:
4.6% (10)
Hispanic or Latino - Speak another language Native:
78.0% (266)Foreign-born:
96.9% (199)
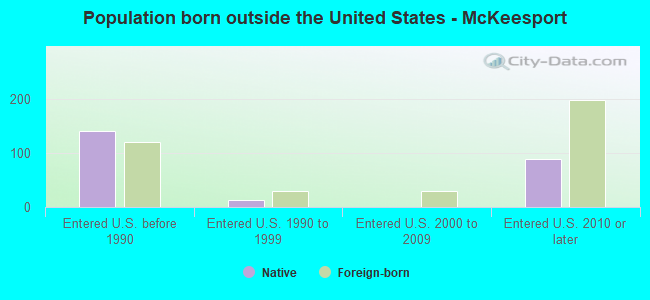
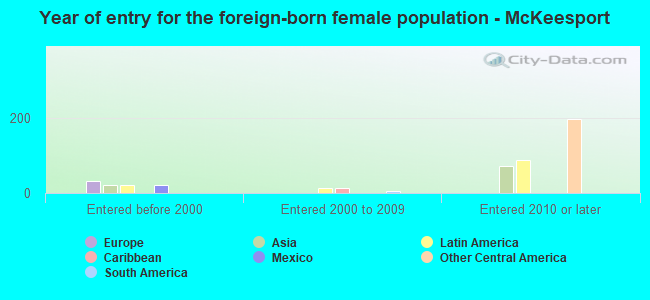
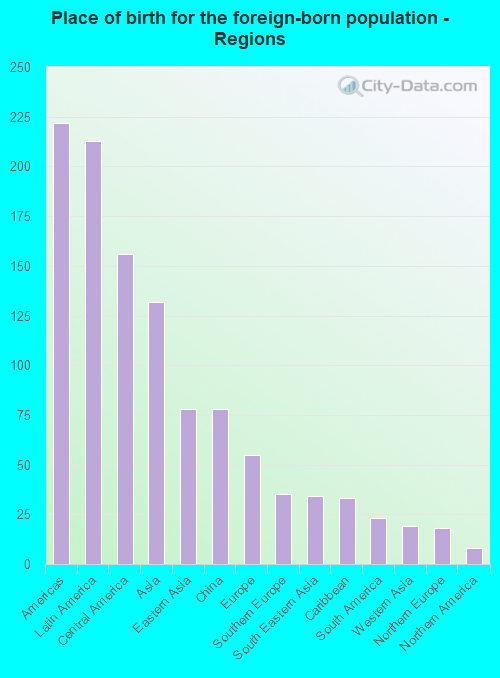
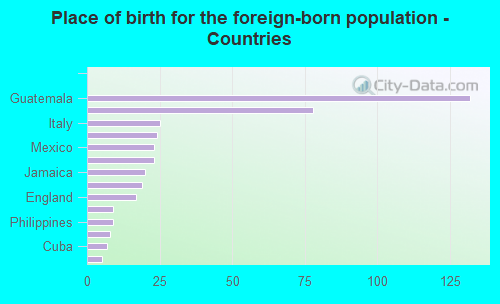
Foreign-born residents in McKeesport 411 residents are foreign born (1.2% Latin America , 0.7% Asia , 0.3% Europe ).
This city:
2.3%Pennsylvania:
7.3%
Marital status for residents in McKeesport Marital status - White (Caucasian) population 15 years and over
Males 41.4% Never married32.4% Now married3.0% Separated9.5% Widowed13.8% DivorcedFemales 34.3% Never married31.1% Now married5.4% Separated18.8% Widowed10.4% DivorcedWomen who gave birth in the past 12 months Now married:
8.5% (4)Unmarried:
91.5% (42)
Women who did not give birth in the past 12 months Now married:
38.5% (666)Unmarried:
61.5% (1,064)
Marital status - Black or African American population 15 years and over
Males 61.3% Never married25.8% Now married1.3% Separated2.3% Widowed9.3% DivorcedFemales 45.6% Never married19.4% Now married3.9% Separated3.3% Widowed27.8% DivorcedWomen who gave birth in the past 12 months Now married:
25.9% (34)Unmarried:
74.1% (96)
Women who did not give birth in the past 12 months Now married:
23.3% (296)Unmarried:
76.7% (974)
Marital status - Asian population 15 years and over
Males 60.6% Never married39.4% Now married0.0% Separated0.0% Widowed0.0% DivorcedFemales 50.0% Never married46.1% Now married0.0% Separated3.9% Widowed0.0% DivorcedWomen who did not give birth in the past 12 months Now married:
41.4% (38)Unmarried:
58.6% (53)
Marital status - Other race population 15 years and over
Males 42.2% Never married57.8% Now married0.0% Separated0.0% Widowed0.0% DivorcedFemales 10.9% Never married75.0% Now married14.1% Separated0.0% Widowed0.0% DivorcedWomen who gave birth in the past 12 months Now married:
100.0% (14)Unmarried:
0.0% (0)
Women who did not give birth in the past 12 months Now married:
84.1% (92)Unmarried:
15.9% (17)
Marital status - Two or more races population 15 years and over
Males 84.5% Never married9.7% Now married0.0% Separated0.0% Widowed5.8% DivorcedFemales 71.0% Never married8.6% Now married14.9% Separated5.0% Widowed0.6% DivorcedWomen who did not give birth in the past 12 months Now married:
22.0% (133)Unmarried:
78.0% (470)
Marital status - White alone, not Hispanic / Latino population 15 years and over
Males 42.0% Never married31.3% Now married3.0% Separated9.6% Widowed14.1% DivorcedFemales 34.9% Never married30.2% Now married5.5% Separated19.1% Widowed10.4% DivorcedWomen who gave birth in the past 12 months Now married:
8.5% (4)Unmarried:
91.5% (42)
Women who did not give birth in the past 12 months Now married:
38.0% (655)Unmarried:
62.0% (1,067)
Marital status - Hispanic or Latino population 15 years and over
Males 30.6% Never married69.4% Now married0.0% Separated0.0% Widowed0.0% DivorcedFemales 5.4% Never married90.3% Now married0.0% Separated0.0% Widowed4.3% DivorcedWomen who gave birth in the past 12 months Now married:
100.0% (12)Unmarried:
0.0% (0)
Women who did not give birth in the past 12 months Now married:
89.0% (86)Unmarried:
11.0% (11)
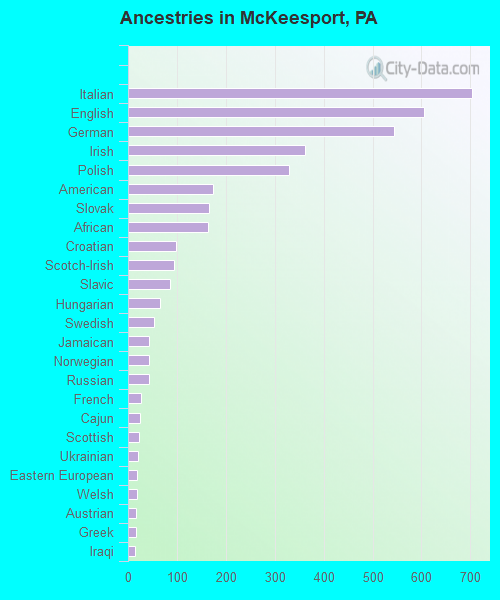
Ancestries in McKeesport
703 9.2% Italian606 7.9% English544 7.1% German361 4.7% Irish330 4.3% Polish173 2.3% American165 2.2% Slovak163 2.1% African99 1.3% Croatian94 1.2% Scotch-Irish86 1.1% Slavic66 0.9% Hungarian53 0.7% Swedish43 0.6% Jamaican42 0.5% Norwegian42 0.5% Russian27 0.4% French24 0.3% Cajun22 0.3% Scottish20 0.3% Ukrainian19 0.2% Eastern European18 0.2% Welsh16 0.2% Austrian16 0.2% Greek15 0.2% Iraqi11 0.1% Czechoslovakian11 0.1% Slovene10 0.1% Serbian9 0.1% Dutch8 0.1% Brazilian6 0.08% Romanian5 0.07% European1 0.01% Bulgarian
Children Nativity (place of birth) in McKeesport
Children under 6 years - Living with two parents Both parents native 297 100.0% NativeBoth parents foreign-born 29 100.0% NativeOne native, one foreign-born parent 22 100.0% NativeChildren under 6 years - Living with one parent Native parent 709 100.0% Native
Children 6 to 17 years - Living with two parents Both parents native 439 99.8% Native1 0.2% Foreign-bornBoth parents foreign-born 29 100.0% Foreign-bornOne native, one foreign-born parent 41 100.0% NativeChildren 6 to 17 years - Living with one parent Native parent 1,815 100.0% Native
Grandparents responsible for own grandchildren in McKeesport
Grandparents (30 to 59 years) White / Caucasian 4 15.5% Responsible for grandchildren23 84.5% Not responsible for grandchildrenBlack or African American 30 29.3% Responsible for grandchildren71 70.7% Not responsible for grandchildrenWhite alone, not Hispanic / Latino 4 15.6% Responsible for grandchildren24 84.4% Not responsible for grandchildrenGrandparents (60 years and over) White / Caucasian 20 16.7% Responsible for grandchildren102 83.3% Not responsible for grandchildrenBlack or African American 46 87.4% Responsible for grandchildren7 12.6% Not responsible for grandchildrenWhite alone, not Hispanic / Latino 21 16.6% Responsible for grandchildren103 83.4% Not responsible for grandchildren