Races in McPherson, Kansas (KS) Detailed Stats
Data:
Races - White alone (%)
Races - White alone (% change since 2000)
Races - Black alone (%)
Races - Black alone (% change since 2000)
Races - American Indian alone (%)
Races - American Indian alone (% change since 2000)
Races - Asian alone (%)
Races - Asian alone (% change since 2000)
Races - Hispanic (%)
Races - Hispanic (% change since 2000)
Races - Native Hawaiian and Other Pacific Islander alone (%)
Races - Native Hawaiian and Other Pacific Islander alone (% change since 2000)
Races - Two or more races(%)
Races - Two or more races(% change since 2000)
Races - Other race alone (%)
Races - Other race alone (% change since 2000)
Racial diversity
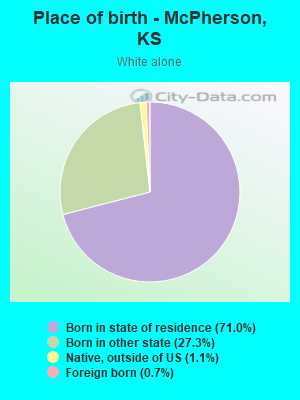
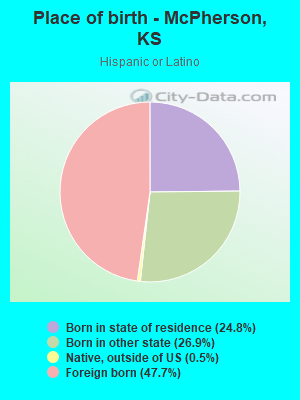
Place of birth - Born in state of residence (%)
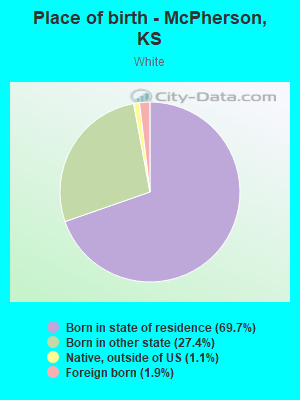
Place of birth - Born in state of residence (%) - White
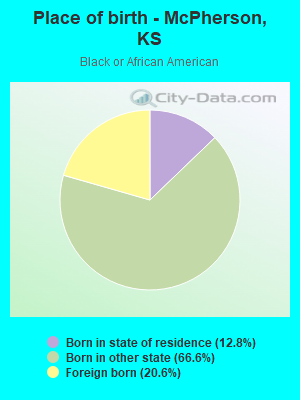
Place of birth - Born in state of residence (%) - Black or African American
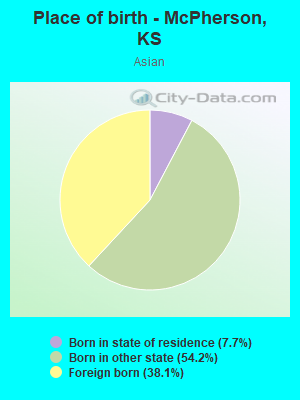
Place of birth - Born in state of residence (%) - Asian
Place of birth - Born in state of residence (%) - Hispanic or Latino
Place of birth - Born in state of residence (%) - American Indian and Alaska Native
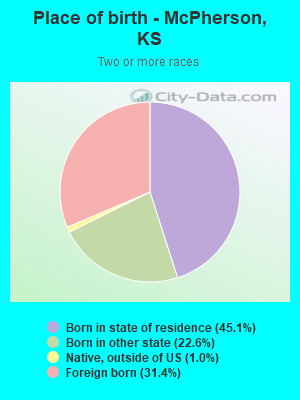
Place of birth - Born in state of residence (%) - Multirace
Place of birth - Born in state of residence (%) - Other Race
Place of birth - Born in other state (%)
Place of birth - Born in other state (%) - White
Place of birth - Born in other state (%) - Black or African American
Place of birth - Born in other state (%) - Asian
Place of birth - Born in other state (%) - Hispanic or Latino
Place of birth - Born in other state (%) - American Indian and Alaska Native
Place of birth - Born in other state (%) - Multirace
Place of birth - Born in other state (%) - Other Race
Place of birth - Native, outside of US (%)
Place of birth - Native, outside of US (%) - White
Place of birth - Native, outside of US (%) - Black or African American
Place of birth - Native, outside of US (%) - Asian
Place of birth - Native, outside of US (%) - Hispanic or Latino
Place of birth - Native, outside of US (%) - American Indian and Alaska Native
Place of birth - Native, outside of US (%) - Multirace
Place of birth - Native, outside of US (%) - Other Race
Place of birth - Foreign born (%)
Place of birth - Foreign born (%) - White
Place of birth - Foreign born (%) - Black or African American
Place of birth - Foreign born (%) - Asian
Place of birth - Foreign born (%) - Hispanic or Latino
Place of birth - Foreign born (%) - American Indian and Alaska Native
Place of birth - Foreign born (%) - Multirace
Place of birth - Foreign born (%) - Other Race
Residents speaking English at home (%)
Residents speaking English at home - Born in the United States (%)
Residents speaking English at home - Native, born elsewhere (%)
Residents speaking English at home - Foreign born (%)
Residents speaking Spanish at home (%)
Residents speaking Spanish at home - Born in the United States (%)
Residents speaking Spanish at home - Native, born elsewhere (%)
Residents speaking Spanish at home - Foreign born (%)
Residents speaking other language at home (%)
Residents speaking other language at home - Born in the United States (%)
Residents speaking other language at home - Native, born elsewhere (%)
Residents speaking other language at home - Foreign born (%)
Marital status - Never married (%)
Marital status - Now married (%)
Marital status - Separated (%)
Marital status - Widowed (%)
Marital status - Divorced (%)
Ancestries Reported - Arab (%)
Ancestries Reported - Czech (%)
Ancestries Reported - Danish (%)
Ancestries Reported - Dutch (%)
Ancestries Reported - English (%)
Ancestries Reported - French (%)
Ancestries Reported - French Canadian (%)
Ancestries Reported - German (%)
Ancestries Reported - Greek (%)
Ancestries Reported - Hungarian (%)
Ancestries Reported - Irish (%)
Ancestries Reported - Italian (%)
Ancestries Reported - Lithuanian (%)
Ancestries Reported - Norwegian (%)
Ancestries Reported - Polish (%)
Ancestries Reported - Portuguese (%)
Ancestries Reported - Russian (%)
Ancestries Reported - Scotch-Irish (%)
Ancestries Reported - Scottish (%)
Ancestries Reported - Slovak (%)
Ancestries Reported - Subsaharan African (%)
Ancestries Reported - Swedish (%)
Ancestries Reported - Swiss (%)
Ancestries Reported - Ukrainian (%)
Ancestries Reported - United States (%)
Ancestries Reported - Welsh (%)
Ancestries Reported - West Indian (%)
Ancestries Reported - Other (%)
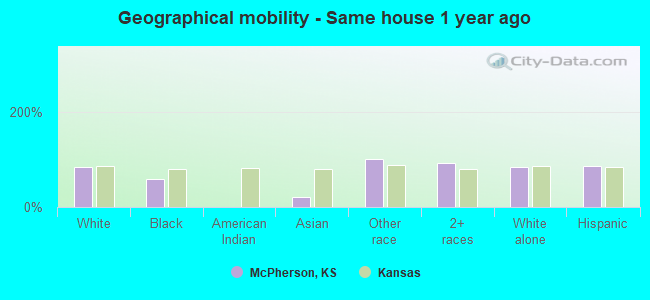
Geographical mobility - Same house 1 year ago (%)
Geographical mobility - Same house 1 year ago (%) - White
Geographical mobility - Same house 1 year ago (%) - Black or African American
Geographical mobility - Same house 1 year ago (%) - Asian
Geographical mobility - Same house 1 year ago (%) - Hispanic or Latino
Geographical mobility - Same house 1 year ago (%) - American Indian and Alaska Native
Geographical mobility - Same house 1 year ago (%) - Multirace
Geographical mobility - Same house 1 year ago (%) - Other Race
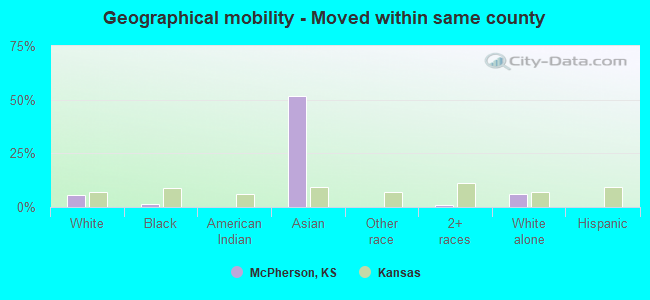
Geographical mobility - Moved within same county (%)
Geographical mobility - Moved within same county (%) - White
Geographical mobility - Moved within same county (%) - Black or African American
Geographical mobility - Moved within same county (%) - Asian
Geographical mobility - Moved within same county (%) - Hispanic or Latino
Geographical mobility - Moved within same county (%) - American Indian and Alaska Native
Geographical mobility - Moved within same county (%) - Multirace
Geographical mobility - Moved within same county (%) - Other Race
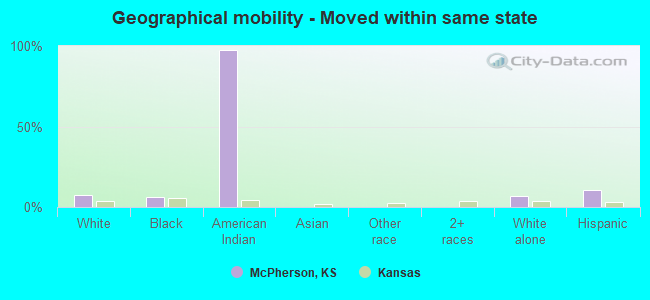
Geographical mobility - Moved from different county within same state (%)
Geographical mobility - Moved from different county within same state (%) - White
Geographical mobility - Moved from different county within same state (%) - Black or African American
Geographical mobility - Moved from different county within same state (%) - Asian
Geographical mobility - Moved from different county within same state (%) - Hispanic or Latino
Geographical mobility - Moved from different county within same state (%) - American Indian and Alaska Native
Geographical mobility - Moved from different county within same state (%) - Multirace
Geographical mobility - Moved from different county within same state (%) - Other Race
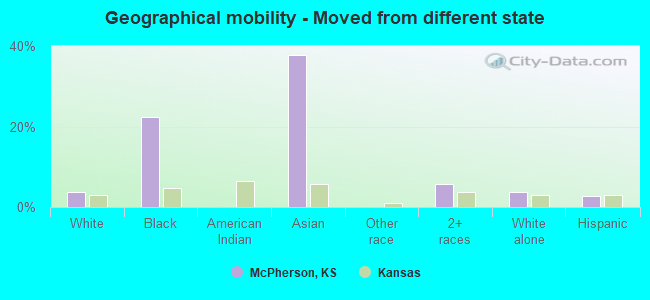
Geographical mobility - Moved from different state (%)
Geographical mobility - Moved from different state (%) - White
Geographical mobility - Moved from different state (%) - Black or African American
Geographical mobility - Moved from different state (%) - Asian
Geographical mobility - Moved from different state (%) - Hispanic or Latino
Geographical mobility - Moved from different state (%) - American Indian and Alaska Native
Geographical mobility - Moved from different state (%) - Multirace
Geographical mobility - Moved from different state (%) - Other Race
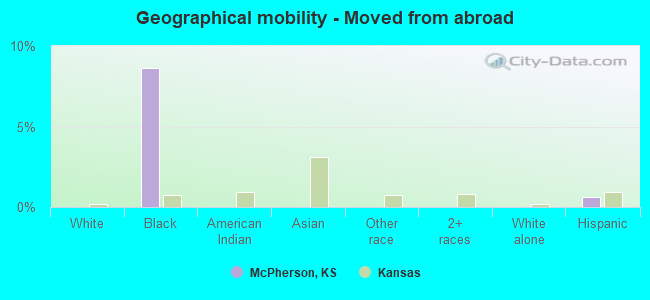
Geographical mobility - Moved from abroad (%)
Geographical mobility - Moved from abroad (%) - White
Geographical mobility - Moved from abroad (%) - Black or African American
Geographical mobility - Moved from abroad (%) - Asian
Geographical mobility - Moved from abroad (%) - Hispanic or Latino
Geographical mobility - Moved from abroad (%) - American Indian and Alaska Native
Geographical mobility - Moved from abroad (%) - Multirace
Geographical mobility - Moved from abroad (%) - Other Race
Place of birth for the foreign-born population - Ireland (%)
Place of birth for the foreign-born population - Denmark (%)
Place of birth for the foreign-born population - Norway (%)
Place of birth for the foreign-born population - Sweden (%)
Place of birth for the foreign-born population - United Kingdom (%)
Place of birth for the foreign-born population - England (%)
Place of birth for the foreign-born population - Scotland (%)
Place of birth for the foreign-born population - Other Northern Europe (%)
Place of birth for the foreign-born population - Austria (%)
Place of birth for the foreign-born population - Belgium (%)
Place of birth for the foreign-born population - France (%)
Place of birth for the foreign-born population - Germany (%)
Place of birth for the foreign-born population - Netherlands (%)
Place of birth for the foreign-born population - Switzerland (%)
Place of birth for the foreign-born population - Other Western Europe (%)
Place of birth for the foreign-born population - Greece (%)
Place of birth for the foreign-born population - Italy (%)
Place of birth for the foreign-born population - Portugal (%)
Place of birth for the foreign-born population - Spain (%)
Place of birth for the foreign-born population - Other Southern Europe (%)
Place of birth for the foreign-born population - Albania (%)
Place of birth for the foreign-born population - Belarus (%)
Place of birth for the foreign-born population - Bosnia and Herzegovina (%)
Place of birth for the foreign-born population - Bulgaria (%)
Place of birth for the foreign-born population - Croatia (%)
Place of birth for the foreign-born population - Czechoslovakia (%)
Place of birth for the foreign-born population - Hungary (%)
Place of birth for the foreign-born population - Latvia (%)
Place of birth for the foreign-born population - Lithuania (%)
Place of birth for the foreign-born population - North Macedonia (Macedonia) (%)
Place of birth for the foreign-born population - Moldova (%)
Place of birth for the foreign-born population - Poland (%)
Place of birth for the foreign-born population - Romania (%)
Place of birth for the foreign-born population - Russia (%)
Place of birth for the foreign-born population - Serbia (%)
Place of birth for the foreign-born population - Ukraine (%)
Place of birth for the foreign-born population - Other Eastern Europe (%)
Place of birth for the foreign-born population - China (%)
Place of birth for the foreign-born population - Hong Kong (%)
Place of birth for the foreign-born population - Taiwan (%)
Place of birth for the foreign-born population - Japan (%)
Place of birth for the foreign-born population - Korea (%)
Place of birth for the foreign-born population - Other Eastern Asia (%)
Place of birth for the foreign-born population - Afghanistan (%)
Place of birth for the foreign-born population - Bangladesh (%)
Place of birth for the foreign-born population - India (%)
Place of birth for the foreign-born population - Iran (%)
Place of birth for the foreign-born population - Kazakhstan (%)
Place of birth for the foreign-born population - Nepal (%)
Place of birth for the foreign-born population - Pakistan (%)
Place of birth for the foreign-born population - Sri Lanka (%)
Place of birth for the foreign-born population - Uzbekistan (%)
Place of birth for the foreign-born population - Other South Central Asia (%)
Place of birth for the foreign-born population - Burma (%)
Place of birth for the foreign-born population - Cambodia (%)
Place of birth for the foreign-born population - Indonesia (%)
Place of birth for the foreign-born population - Laos (%)
Place of birth for the foreign-born population - Malaysia (%)
Place of birth for the foreign-born population - Philippines (%)
Place of birth for the foreign-born population - Singapore (%)
Place of birth for the foreign-born population - Thailand (%)
Place of birth for the foreign-born population - Vietnam (%)
Place of birth for the foreign-born population - Other South Eastern Asia (%)
Place of birth for the foreign-born population - Armenia (%)
Place of birth for the foreign-born population - Iraq (%)
Place of birth for the foreign-born population - Israel (%)
Place of birth for the foreign-born population - Jordan (%)
Place of birth for the foreign-born population - Kuwait (%)
Place of birth for the foreign-born population - Lebanon (%)
Place of birth for the foreign-born population - Saudi Arabia (%)
Place of birth for the foreign-born population - Syria (%)
Place of birth for the foreign-born population - Turkey (%)
Place of birth for the foreign-born population - Yemen (%)
Place of birth for the foreign-born population - Other Western Asia (%)
Place of birth for the foreign-born population - Eritrea (%)
Place of birth for the foreign-born population - Ethiopia (%)
Place of birth for the foreign-born population - Kenya (%)
Place of birth for the foreign-born population - Somalia (%)
Place of birth for the foreign-born population - Uganda (%)
Place of birth for the foreign-born population - Zimbabwe (%)
Place of birth for the foreign-born population - Other Eastern Africa (%)
Place of birth for the foreign-born population - Cameroon (%)
Place of birth for the foreign-born population - Congo (%)
Place of birth for the foreign-born population - Democratic Republic of Congo (Zaire) (%)
Place of birth for the foreign-born population - Other Middle Africa (%)
Place of birth for the foreign-born population - Egypt (%)
Place of birth for the foreign-born population - Morocco (%)
Place of birth for the foreign-born population - Sudan (%)
Place of birth for the foreign-born population - Other Northern Africa (%)
Place of birth for the foreign-born population - South Africa (%)
Place of birth for the foreign-born population - Other Southern Africa (%)
Place of birth for the foreign-born population - Cabo Verde (%)
Place of birth for the foreign-born population - Ghana (%)
Place of birth for the foreign-born population - Liberia (%)
Place of birth for the foreign-born population - Nigeria (%)
Place of birth for the foreign-born population - Senegal (%)
Place of birth for the foreign-born population - Sierra Leone (%)
Place of birth for the foreign-born population - Other Western Africa (%)
Place of birth for the foreign-born population - Australia (%)
Place of birth for the foreign-born population - New Zealand (%)
Place of birth for the foreign-born population - Fiji (%)
Place of birth for the foreign-born population - Micronesia (%)
Place of birth for the foreign-born population - Bahamas (%)
Place of birth for the foreign-born population - Barbados (%)
Place of birth for the foreign-born population - Cuba (%)
Place of birth for the foreign-born population - Dominica (%)
Place of birth for the foreign-born population - Dominican Republic (%)
Place of birth for the foreign-born population - Grenada (%)
Place of birth for the foreign-born population - Haiti (%)
Place of birth for the foreign-born population - Jamaica (%)
Place of birth for the foreign-born population - St. Vincent and the Grenadines (%)
Place of birth for the foreign-born population - Trinidad and Tobago (%)
Place of birth for the foreign-born population - West Indies (%)
Place of birth for the foreign-born population - Other Caribbean (%)
Place of birth for the foreign-born population - Belize (%)
Place of birth for the foreign-born population - Costa Rica (%)
Place of birth for the foreign-born population - El Salvador (%)
Place of birth for the foreign-born population - Guatemala (%)
Place of birth for the foreign-born population - Honduras (%)
Place of birth for the foreign-born population - Mexico (%)
Place of birth for the foreign-born population - Nicaragua (%)
Place of birth for the foreign-born population - Panama (%)
Place of birth for the foreign-born population - Other Central America (%)
Place of birth for the foreign-born population - Argentina (%)
Place of birth for the foreign-born population - Bolivia (%)
Place of birth for the foreign-born population - Brazil (%)
Place of birth for the foreign-born population - Chile (%)
Place of birth for the foreign-born population - Colombia (%)
Place of birth for the foreign-born population - Ecuador (%)
Place of birth for the foreign-born population - Guyana (%)
Place of birth for the foreign-born population - Peru (%)
Place of birth for the foreign-born population - Uruguay (%)
Place of birth for the foreign-born population - Venezuela (%)
Place of birth for the foreign-born population - Other South America (%)
Place of birth for the foreign-born population - Canada (%)
Place of birth for the foreign-born population - Other Northern America (%)
Place of birth for the foreign-born population - Other (%)
Latest news about races in McPherson, KS collected exclusively by city-data.com from local newspapers, TV, and radio stations
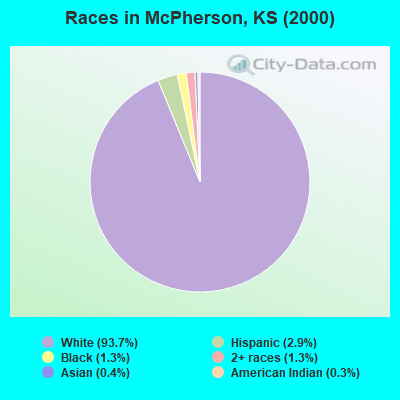
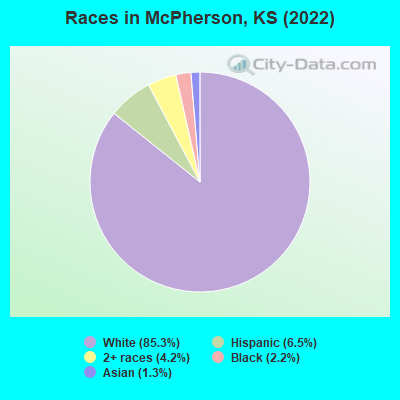
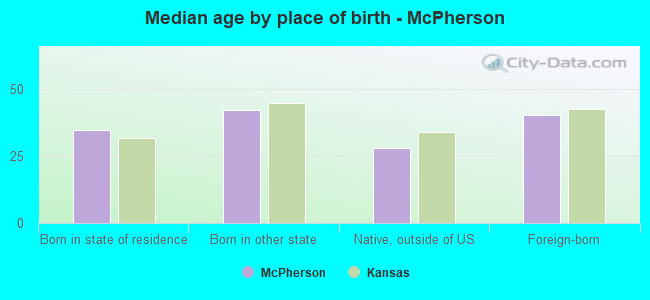
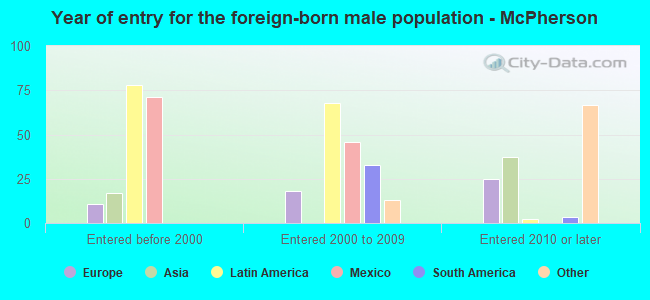
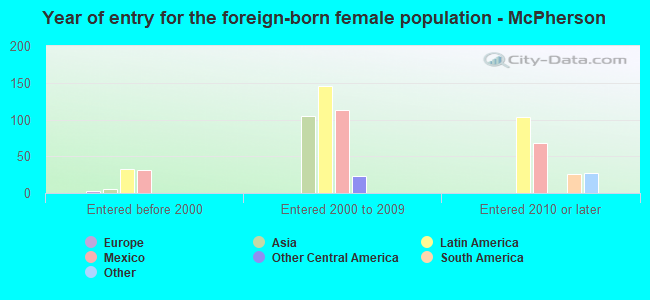
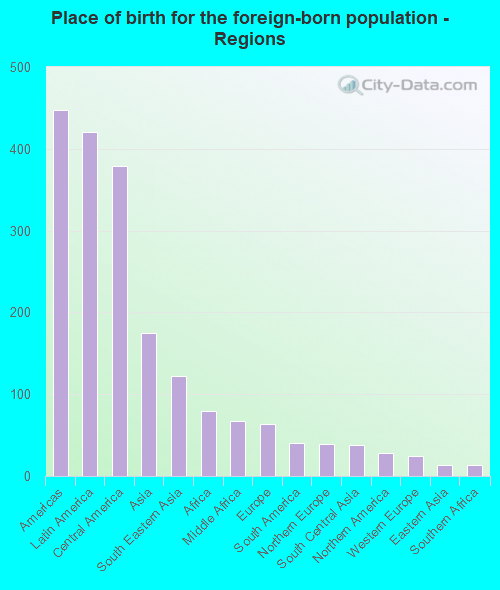
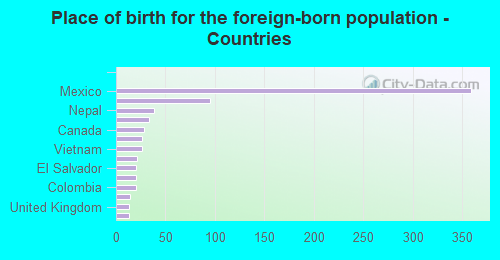
According to 2022 data, the most numerous races in McPherson, KS are White alone (11,903 residents), Hispanic (904 residents), and Black alone (310 residents). 93.6% of McPherson residents speak English at home. 5.5% of McPherson, KS residents are foreign-born (3.0% born in Latin America, 1.2% born in Asia, 0.6% born in Africa), which is 27.1% less than the foreign-born rate of 7.0% across the entire state of Kansas.
Race distribution in McPherson
2000 2022
2,233,997 83.1% White alone 188,252 7.0% Hispanic 151,407 5.6% Black alone 46,301 1.7% Asian alone 42,508 1.6% Two or more races 22,322 0.8% American Indian alone 2,477 0.09% Other race alone 1,154 0.04% Native Hawaiian and Other
2,147,943 73.1% White alone 381,746 13.0% Hispanic 147,666 5.0% Black alone 145,362 4.9% Two or more races 85,085 2.9% Asian alone 13,263 0.5% Other race alone 12,065 0.4% American Indian alone 4,020 0.1% Native Hawaiian and Other
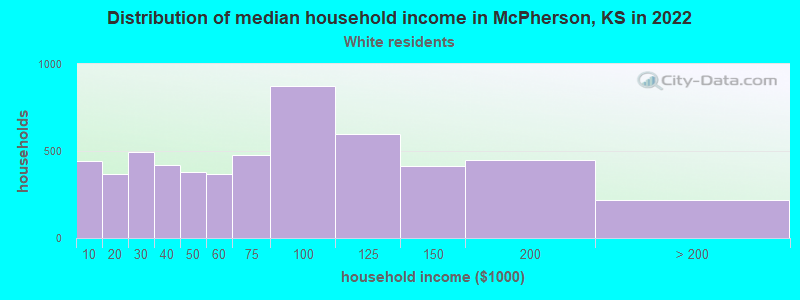
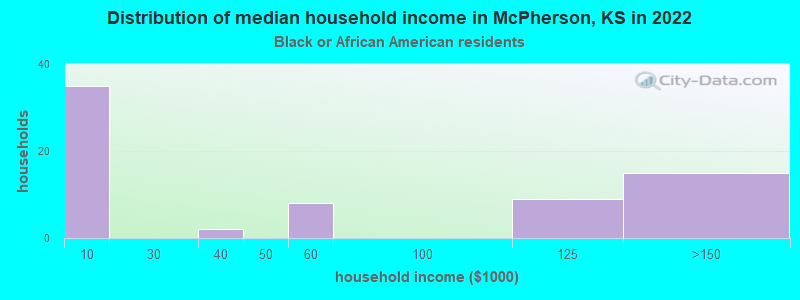
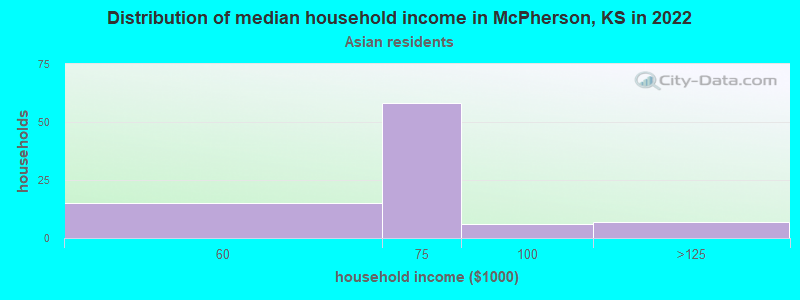
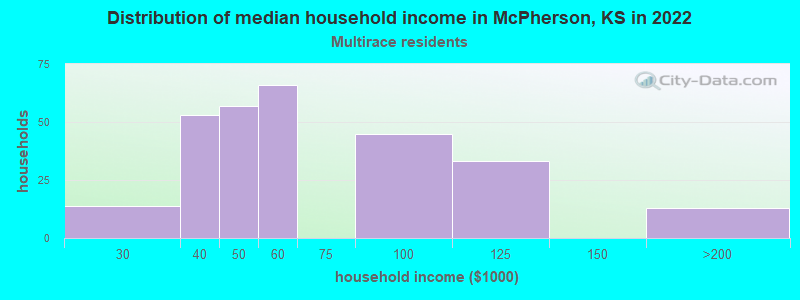
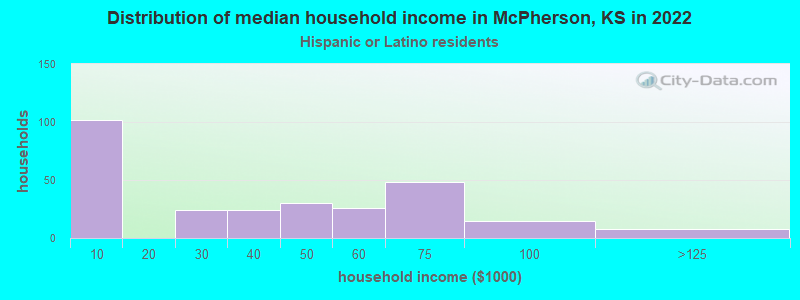
Income and house value in McPherson Median household income in 2022 $72,264 White non-Hispanic householders$67,423 Asian householders$59,143 Two or more races householders$36,231 Hispanic or Latino race householdersMedian 2022 house value $206,561 White Non-Hispanic householders$125,722 Black or African American householders$45,607 Some other race householders$84,458 Two or more races householders$134,168 Hispanic or Latino householders
Median age by race in McPherson
37.7 Median age for White residents35.3 39.7 21.8 Median age for Black or African American residents23.3 20.4 -744,725,737.7 Median age for American Indian / Alaska Native residents-781,078,107.0 -654,797,229.8 26.2 Median age for Asian residents23.0 26.9 -627,039,626.4 Median age for Native Hawaiian / Pacific Islander residents-669,240,668.6 -641,269,840.6 -675,438,595.8 Median age for Other race residents-673,224,043.0 -675,438,595.8 40.9 Median age for Two or more races residents37.6 42.0 37.9 Median age for White alone residents36.3 39.8 26.2 Median age for Hispanic or Latino residents26.4 25.8
Owner/renter occupied households by race in McPherson
House owners and renters - White residents 3,853 70.8% Owner occupied1,592 29.2% Renter occupiedHouse owners and renters - Black or African American residents 24 37.8% Owner occupied40 62.2% Renter occupiedHouse owners and renters - American Indian / Alaska Native residents 7 100.0% Renter occupiedHouse owners and renters - Asian residents 7 7.9% Owner occupied76 92.1% Renter occupiedHouse owners and renters - Other race residents 87 100.0% Owner occupiedHouse owners and renters - Two or more races residents 140 52.1% Owner occupied129 47.9% Renter occupiedHouse owners and renters - White alone residents 3,804 70.8% Owner occupied1,572 29.2% Renter occupiedHouse owners and renters - Hispanic or Latino residents 205 70.0% Owner occupied88 30.0% Renter occupied
Language usage in McPherson
English speakers - Total 93.6% of residents of McPherson speak English at home.
4.6% of residents speak Spanish at home 322 51.5% Speak English very well303 48.5% Speak English less than very well1.8% of residents speak other language at home 198 81.8% Speak English very well44 18.2% Speak English less than very well
English speakers - Born in the United States 95.6% of residents of McPherson speak English at home.
1.4% of residents speak Spanish at home 53 100.0% Speak English very well2.9% of residents speak other language at home 114 100.0% Speak English very well
All residents speak only English at home
English speakers - Foreign-born 29.3% of residents of McPherson speak English at home.
57.1% of residents speak Spanish at home 201 46.6% Speak English very well230 53.4% Speak English less than very well15.2% of residents speak other language at home 73 63.5% Speak English very well42 36.5% Speak English less than very well
White (Caucasian) - Speak only English Native:
98.7% (11,347)Foreign-born:
27.6% (62)
White (Caucasian) - Speak another language Native:
1.6% (187)Foreign-born:
70.9% (160)
Black or African American - Speak another language Native:
2.5% (6)Foreign-born:
98.2% (64)
Asian - Speak only English Native:
97.4% (112)Foreign-born:
56.8% (42)
Asian - Speak another language Native:
11.3% (13)Foreign-born:
41.3% (30)
Two or more races - Speak only English Native:
92.5% (544)Foreign-born:
55.3% (149)
Two or more races - Speak another language Native:
3.9% (23)Foreign-born:
37.8% (102)
White alone - Speak only English Native:
99.2% (11,235)Foreign-born:
46.8% (38)
White alone - Speak another language Native:
0.8% (95)Foreign-born:
52.4% (42)
Hispanic or Latino - Speak only English Native:
57.1% (268)Foreign-born:
9.6% (41)
Hispanic or Latino - Speak another language Native:
42.9% (202)Foreign-born:
90.9% (394)
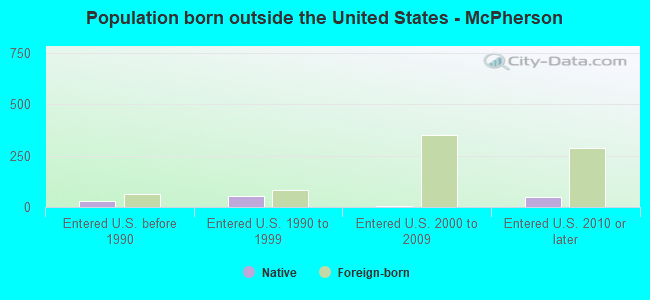
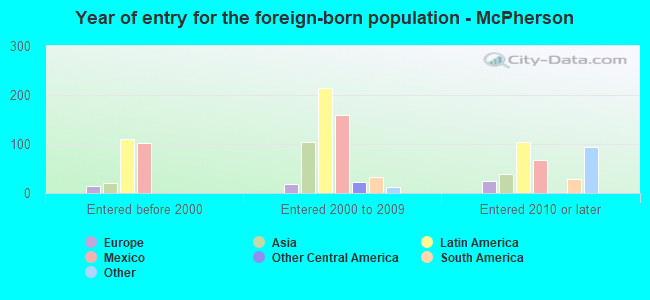
Foreign-born residents in McPherson 769 residents are foreign born (3.0% Latin America , 1.2% Asia , 0.6% Africa ).
This city:
5.5%Kansas:
7.1%
Marital status for residents in McPherson Marital status - White (Caucasian) population 15 years and over
Males 33.5% Never married54.7% Now married0.9% Separated2.1% Widowed8.7% DivorcedFemales 24.8% Never married50.8% Now married0.3% Separated9.2% Widowed14.9% DivorcedWomen who gave birth in the past 12 months Now married:
100.0% (100)Unmarried:
0.0% (0)
Women who did not give birth in the past 12 months Now married:
44.5% (1,234)Unmarried:
55.5% (1,537)
Marital status - Black or African American population 15 years and over
Males 64.8% Never married16.1% Now married0.0% Separated0.0% Widowed19.2% DivorcedFemales 71.4% Never married28.6% Now married0.0% Separated0.0% Widowed0.0% DivorcedWomen who did not give birth in the past 12 months Now married:
13.8% (8)Unmarried:
86.2% (51)
Marital status - Asian population 15 years and over
Males 66.7% Never married33.3% Now married0.0% Separated0.0% Widowed0.0% DivorcedFemales 11.6% Never married68.1% Now married0.0% Separated0.0% Widowed20.3% DivorcedWomen who did not give birth in the past 12 months Now married:
68.1% (47)Unmarried:
31.9% (22)
Marital status - Two or more races population 15 years and over
Males 39.4% Never married51.7% Now married0.0% Separated0.0% Widowed8.9% DivorcedFemales 42.3% Never married47.0% Now married0.0% Separated0.9% Widowed9.9% DivorcedWomen who gave birth in the past 12 months Now married:
0.0% (0)Unmarried:
100.0% (16)
Women who did not give birth in the past 12 months Now married:
45.2% (168)Unmarried:
54.8% (204)
Marital status - White alone, not Hispanic / Latino population 15 years and over
Males 33.3% Never married55.4% Now married0.6% Separated2.2% Widowed8.6% DivorcedFemales 24.3% Never married51.4% Now married0.3% Separated9.6% Widowed14.3% DivorcedWomen who gave birth in the past 12 months Now married:
100.0% (103)Unmarried:
0.0% (0)
Women who did not give birth in the past 12 months Now married:
45.5% (1,206)Unmarried:
54.5% (1,445)
Marital status - Hispanic or Latino population 15 years and over
Males 39.5% Never married44.2% Now married5.4% Separated0.0% Widowed10.9% DivorcedFemales 56.2% Never married27.6% Now married0.0% Separated0.0% Widowed16.3% DivorcedWomen who gave birth in the past 12 months Now married:
0.0% (0)Unmarried:
100.0% (13)
Women who did not give birth in the past 12 months Now married:
25.0% (99)Unmarried:
75.0% (297)
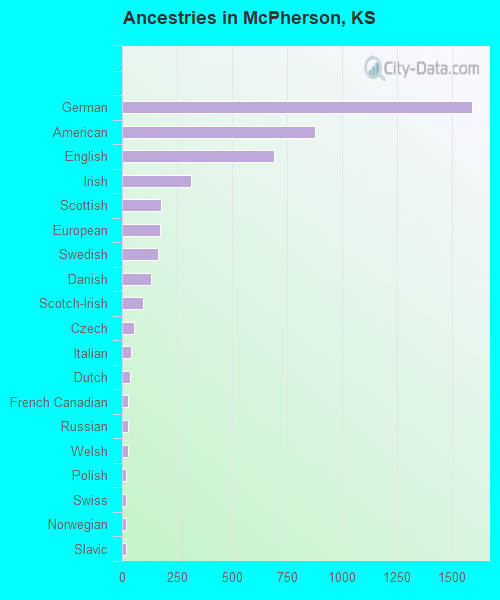
Ancestries in McPherson
1,589 27.8% German878 15.4% American689 12.0% English313 5.5% Irish178 3.1% Scottish172 3.0% European163 2.9% Swedish131 2.3% Danish96 1.7% Scotch-Irish56 1.0% Czech43 0.8% Italian38 0.7% Dutch29 0.5% French Canadian29 0.5% Russian26 0.5% Welsh18 0.3% Polish18 0.3% Swiss16 0.3% Norwegian16 0.3% Slavic14 0.2% South African11 0.2% French10 0.2% Greek8 0.1% Eastern European7 0.1% Haitian6 0.1% British2 0.03% Bahamian1 0.02% Brazilian
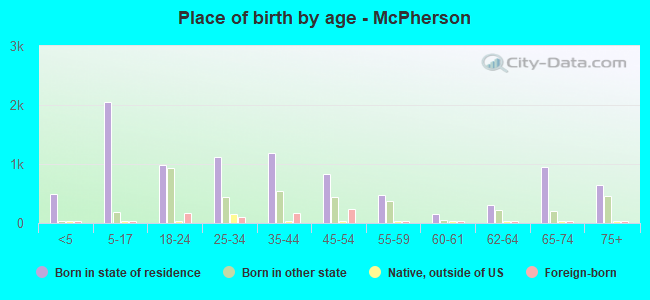
Children Nativity (place of birth) in McPherson
Children under 6 years - Living with two parents Both parents native 479 100.0% NativeOne native, one foreign-born parent 43 100.0% NativeChildren under 6 years - Living with one parent Native parent 30 100.0% NativeChildren 6 to 17 years - Living with two parents Both parents native 1,469 100.0% NativeBoth parents foreign-born 89 75.9% Native28 24.1% Foreign-bornOne native, one foreign-born parent 72 100.0% NativeChildren 6 to 17 years - Living with one parent Native parent 516 100.0% NativeForeign-born parent 43 50.2% Native43 49.8% Foreign-born
Grandparents responsible for own grandchildren in McPherson
Grandparents (30 to 59 years) White / Caucasian 30 100.0% Not responsible for grandchildrenWhite alone, not Hispanic / Latino 32 100.0% Not responsible for grandchildren
Grandparents (60 years and over) White / Caucasian 27 100.0% Not responsible for grandchildrenWhite alone, not Hispanic / Latino 29 100.0% Not responsible for grandchildren