Races in Mechanicstown, New York (NY) Detailed Stats
Data:
Races - White alone (%)
Races - White alone (% change since 2000)
Races - Black alone (%)
Races - Black alone (% change since 2000)
Races - American Indian alone (%)
Races - American Indian alone (% change since 2000)
Races - Asian alone (%)
Races - Asian alone (% change since 2000)
Races - Hispanic (%)
Races - Hispanic (% change since 2000)
Races - Native Hawaiian and Other Pacific Islander alone (%)
Races - Native Hawaiian and Other Pacific Islander alone (% change since 2000)
Races - Two or more races(%)
Races - Two or more races(% change since 2000)
Races - Other race alone (%)
Races - Other race alone (% change since 2000)
Racial diversity
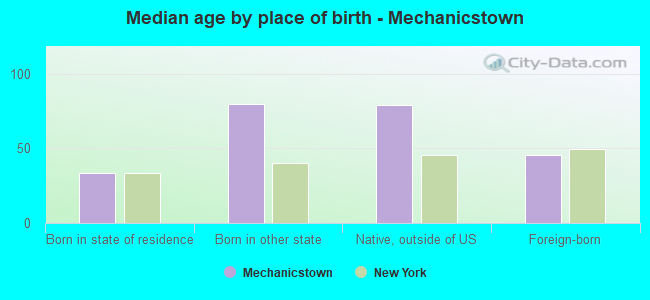
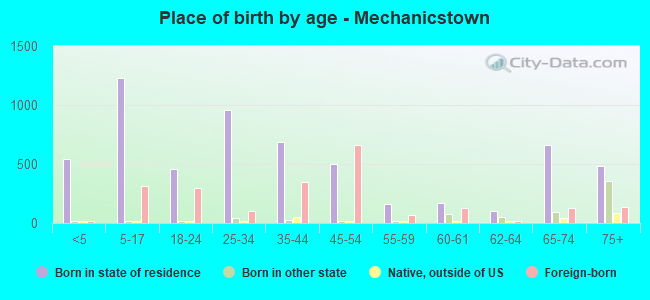
Place of birth - Born in state of residence (%)
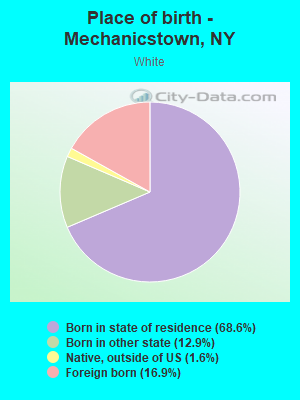
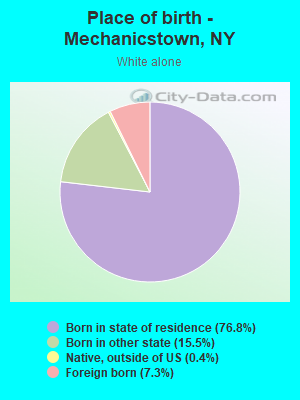
Place of birth - Born in state of residence (%) - White
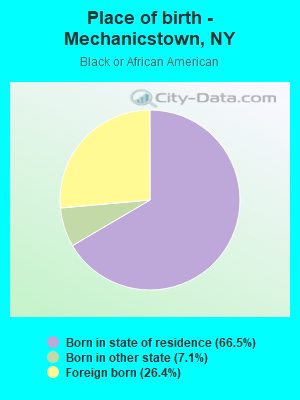
Place of birth - Born in state of residence (%) - Black or African American
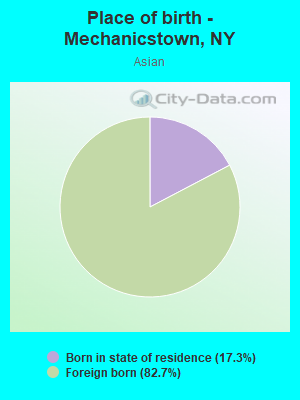
Place of birth - Born in state of residence (%) - Asian
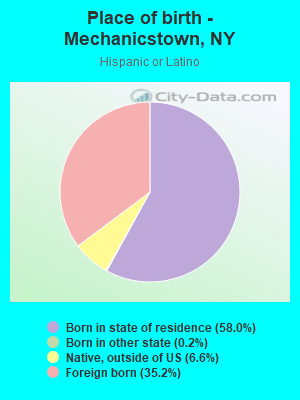
Place of birth - Born in state of residence (%) - Hispanic or Latino
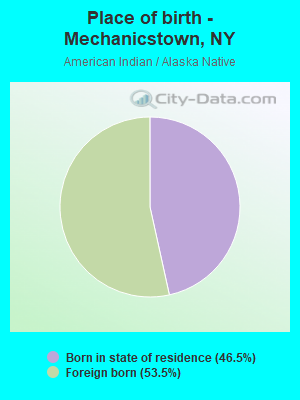
Place of birth - Born in state of residence (%) - American Indian and Alaska Native
Place of birth - Born in state of residence (%) - Multirace
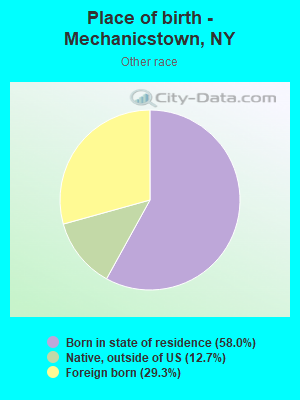
Place of birth - Born in state of residence (%) - Other Race
Place of birth - Born in other state (%)
Place of birth - Born in other state (%) - White
Place of birth - Born in other state (%) - Black or African American
Place of birth - Born in other state (%) - Asian
Place of birth - Born in other state (%) - Hispanic or Latino
Place of birth - Born in other state (%) - American Indian and Alaska Native
Place of birth - Born in other state (%) - Multirace
Place of birth - Born in other state (%) - Other Race
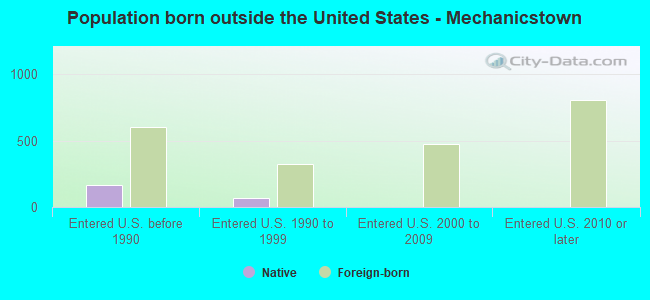
Place of birth - Native, outside of US (%)
Place of birth - Native, outside of US (%) - White
Place of birth - Native, outside of US (%) - Black or African American
Place of birth - Native, outside of US (%) - Asian
Place of birth - Native, outside of US (%) - Hispanic or Latino
Place of birth - Native, outside of US (%) - American Indian and Alaska Native
Place of birth - Native, outside of US (%) - Multirace
Place of birth - Native, outside of US (%) - Other Race
Place of birth - Foreign born (%)
Place of birth - Foreign born (%) - White
Place of birth - Foreign born (%) - Black or African American
Place of birth - Foreign born (%) - Asian
Place of birth - Foreign born (%) - Hispanic or Latino
Place of birth - Foreign born (%) - American Indian and Alaska Native
Place of birth - Foreign born (%) - Multirace
Place of birth - Foreign born (%) - Other Race
Residents speaking English at home (%)
Residents speaking English at home - Born in the United States (%)
Residents speaking English at home - Native, born elsewhere (%)
Residents speaking English at home - Foreign born (%)
Residents speaking Spanish at home (%)
Residents speaking Spanish at home - Born in the United States (%)
Residents speaking Spanish at home - Native, born elsewhere (%)
Residents speaking Spanish at home - Foreign born (%)
Residents speaking other language at home (%)
Residents speaking other language at home - Born in the United States (%)
Residents speaking other language at home - Native, born elsewhere (%)
Residents speaking other language at home - Foreign born (%)
Marital status - Never married (%)
Marital status - Now married (%)
Marital status - Separated (%)
Marital status - Widowed (%)
Marital status - Divorced (%)
Ancestries Reported - Arab (%)
Ancestries Reported - Czech (%)
Ancestries Reported - Danish (%)
Ancestries Reported - Dutch (%)
Ancestries Reported - English (%)
Ancestries Reported - French (%)
Ancestries Reported - French Canadian (%)
Ancestries Reported - German (%)
Ancestries Reported - Greek (%)
Ancestries Reported - Hungarian (%)
Ancestries Reported - Irish (%)
Ancestries Reported - Italian (%)
Ancestries Reported - Lithuanian (%)
Ancestries Reported - Norwegian (%)
Ancestries Reported - Polish (%)
Ancestries Reported - Portuguese (%)
Ancestries Reported - Russian (%)
Ancestries Reported - Scotch-Irish (%)
Ancestries Reported - Scottish (%)
Ancestries Reported - Slovak (%)
Ancestries Reported - Subsaharan African (%)
Ancestries Reported - Swedish (%)
Ancestries Reported - Swiss (%)
Ancestries Reported - Ukrainian (%)
Ancestries Reported - United States (%)
Ancestries Reported - Welsh (%)
Ancestries Reported - West Indian (%)
Ancestries Reported - Other (%)
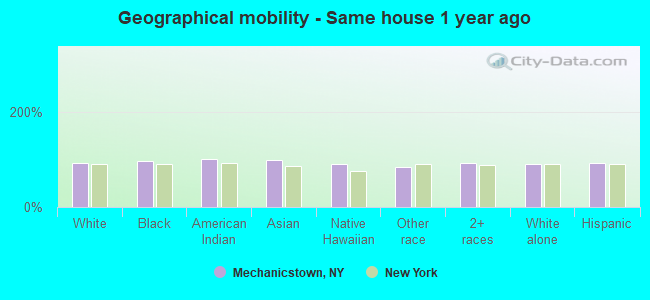
Geographical mobility - Same house 1 year ago (%)
Geographical mobility - Same house 1 year ago (%) - White
Geographical mobility - Same house 1 year ago (%) - Black or African American
Geographical mobility - Same house 1 year ago (%) - Asian
Geographical mobility - Same house 1 year ago (%) - Hispanic or Latino
Geographical mobility - Same house 1 year ago (%) - American Indian and Alaska Native
Geographical mobility - Same house 1 year ago (%) - Multirace
Geographical mobility - Same house 1 year ago (%) - Other Race
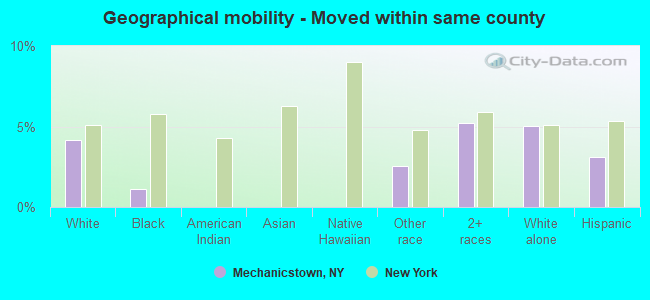
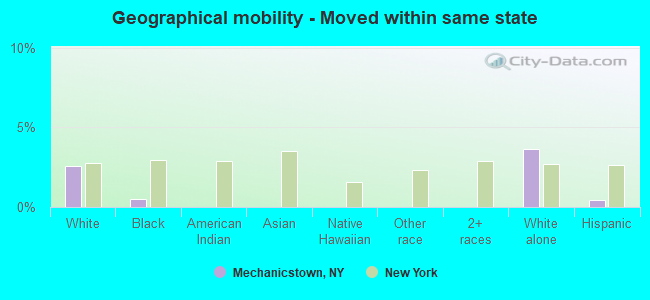
Geographical mobility - Moved within same county (%)
Geographical mobility - Moved within same county (%) - White
Geographical mobility - Moved within same county (%) - Black or African American
Geographical mobility - Moved within same county (%) - Asian
Geographical mobility - Moved within same county (%) - Hispanic or Latino
Geographical mobility - Moved within same county (%) - American Indian and Alaska Native
Geographical mobility - Moved within same county (%) - Multirace
Geographical mobility - Moved within same county (%) - Other Race
Geographical mobility - Moved from different county within same state (%)
Geographical mobility - Moved from different county within same state (%) - White
Geographical mobility - Moved from different county within same state (%) - Black or African American
Geographical mobility - Moved from different county within same state (%) - Asian
Geographical mobility - Moved from different county within same state (%) - Hispanic or Latino
Geographical mobility - Moved from different county within same state (%) - American Indian and Alaska Native
Geographical mobility - Moved from different county within same state (%) - Multirace
Geographical mobility - Moved from different county within same state (%) - Other Race
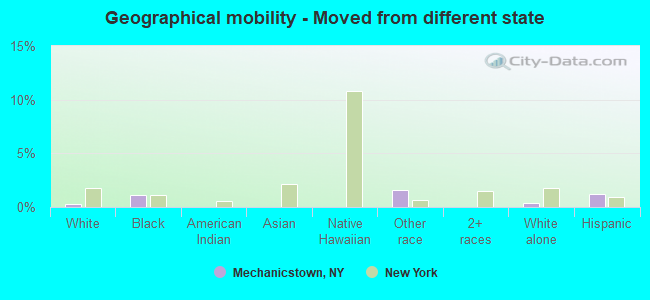
Geographical mobility - Moved from different state (%)
Geographical mobility - Moved from different state (%) - White
Geographical mobility - Moved from different state (%) - Black or African American
Geographical mobility - Moved from different state (%) - Asian
Geographical mobility - Moved from different state (%) - Hispanic or Latino
Geographical mobility - Moved from different state (%) - American Indian and Alaska Native
Geographical mobility - Moved from different state (%) - Multirace
Geographical mobility - Moved from different state (%) - Other Race
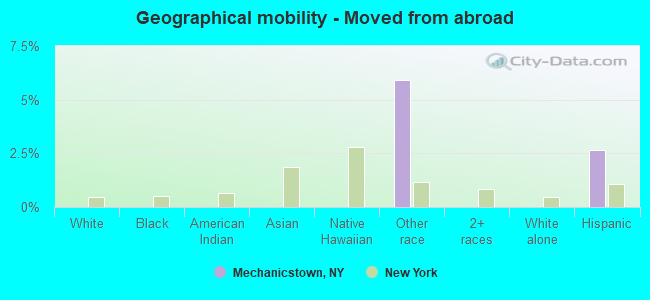
Geographical mobility - Moved from abroad (%)
Geographical mobility - Moved from abroad (%) - White
Geographical mobility - Moved from abroad (%) - Black or African American
Geographical mobility - Moved from abroad (%) - Asian
Geographical mobility - Moved from abroad (%) - Hispanic or Latino
Geographical mobility - Moved from abroad (%) - American Indian and Alaska Native
Geographical mobility - Moved from abroad (%) - Multirace
Geographical mobility - Moved from abroad (%) - Other Race
Place of birth for the foreign-born population - Ireland (%)
Place of birth for the foreign-born population - Denmark (%)
Place of birth for the foreign-born population - Norway (%)
Place of birth for the foreign-born population - Sweden (%)
Place of birth for the foreign-born population - United Kingdom (%)
Place of birth for the foreign-born population - England (%)
Place of birth for the foreign-born population - Scotland (%)
Place of birth for the foreign-born population - Other Northern Europe (%)
Place of birth for the foreign-born population - Austria (%)
Place of birth for the foreign-born population - Belgium (%)
Place of birth for the foreign-born population - France (%)
Place of birth for the foreign-born population - Germany (%)
Place of birth for the foreign-born population - Netherlands (%)
Place of birth for the foreign-born population - Switzerland (%)
Place of birth for the foreign-born population - Other Western Europe (%)
Place of birth for the foreign-born population - Greece (%)
Place of birth for the foreign-born population - Italy (%)
Place of birth for the foreign-born population - Portugal (%)
Place of birth for the foreign-born population - Spain (%)
Place of birth for the foreign-born population - Other Southern Europe (%)
Place of birth for the foreign-born population - Albania (%)
Place of birth for the foreign-born population - Belarus (%)
Place of birth for the foreign-born population - Bosnia and Herzegovina (%)
Place of birth for the foreign-born population - Bulgaria (%)
Place of birth for the foreign-born population - Croatia (%)
Place of birth for the foreign-born population - Czechoslovakia (%)
Place of birth for the foreign-born population - Hungary (%)
Place of birth for the foreign-born population - Latvia (%)
Place of birth for the foreign-born population - Lithuania (%)
Place of birth for the foreign-born population - North Macedonia (Macedonia) (%)
Place of birth for the foreign-born population - Moldova (%)
Place of birth for the foreign-born population - Poland (%)
Place of birth for the foreign-born population - Romania (%)
Place of birth for the foreign-born population - Russia (%)
Place of birth for the foreign-born population - Serbia (%)
Place of birth for the foreign-born population - Ukraine (%)
Place of birth for the foreign-born population - Other Eastern Europe (%)
Place of birth for the foreign-born population - China (%)
Place of birth for the foreign-born population - Hong Kong (%)
Place of birth for the foreign-born population - Taiwan (%)
Place of birth for the foreign-born population - Japan (%)
Place of birth for the foreign-born population - Korea (%)
Place of birth for the foreign-born population - Other Eastern Asia (%)
Place of birth for the foreign-born population - Afghanistan (%)
Place of birth for the foreign-born population - Bangladesh (%)
Place of birth for the foreign-born population - India (%)
Place of birth for the foreign-born population - Iran (%)
Place of birth for the foreign-born population - Kazakhstan (%)
Place of birth for the foreign-born population - Nepal (%)
Place of birth for the foreign-born population - Pakistan (%)
Place of birth for the foreign-born population - Sri Lanka (%)
Place of birth for the foreign-born population - Uzbekistan (%)
Place of birth for the foreign-born population - Other South Central Asia (%)
Place of birth for the foreign-born population - Burma (%)
Place of birth for the foreign-born population - Cambodia (%)
Place of birth for the foreign-born population - Indonesia (%)
Place of birth for the foreign-born population - Laos (%)
Place of birth for the foreign-born population - Malaysia (%)
Place of birth for the foreign-born population - Philippines (%)
Place of birth for the foreign-born population - Singapore (%)
Place of birth for the foreign-born population - Thailand (%)
Place of birth for the foreign-born population - Vietnam (%)
Place of birth for the foreign-born population - Other South Eastern Asia (%)
Place of birth for the foreign-born population - Armenia (%)
Place of birth for the foreign-born population - Iraq (%)
Place of birth for the foreign-born population - Israel (%)
Place of birth for the foreign-born population - Jordan (%)
Place of birth for the foreign-born population - Kuwait (%)
Place of birth for the foreign-born population - Lebanon (%)
Place of birth for the foreign-born population - Saudi Arabia (%)
Place of birth for the foreign-born population - Syria (%)
Place of birth for the foreign-born population - Turkey (%)
Place of birth for the foreign-born population - Yemen (%)
Place of birth for the foreign-born population - Other Western Asia (%)
Place of birth for the foreign-born population - Eritrea (%)
Place of birth for the foreign-born population - Ethiopia (%)
Place of birth for the foreign-born population - Kenya (%)
Place of birth for the foreign-born population - Somalia (%)
Place of birth for the foreign-born population - Uganda (%)
Place of birth for the foreign-born population - Zimbabwe (%)
Place of birth for the foreign-born population - Other Eastern Africa (%)
Place of birth for the foreign-born population - Cameroon (%)
Place of birth for the foreign-born population - Congo (%)
Place of birth for the foreign-born population - Democratic Republic of Congo (Zaire) (%)
Place of birth for the foreign-born population - Other Middle Africa (%)
Place of birth for the foreign-born population - Egypt (%)
Place of birth for the foreign-born population - Morocco (%)
Place of birth for the foreign-born population - Sudan (%)
Place of birth for the foreign-born population - Other Northern Africa (%)
Place of birth for the foreign-born population - South Africa (%)
Place of birth for the foreign-born population - Other Southern Africa (%)
Place of birth for the foreign-born population - Cabo Verde (%)
Place of birth for the foreign-born population - Ghana (%)
Place of birth for the foreign-born population - Liberia (%)
Place of birth for the foreign-born population - Nigeria (%)
Place of birth for the foreign-born population - Senegal (%)
Place of birth for the foreign-born population - Sierra Leone (%)
Place of birth for the foreign-born population - Other Western Africa (%)
Place of birth for the foreign-born population - Australia (%)
Place of birth for the foreign-born population - New Zealand (%)
Place of birth for the foreign-born population - Fiji (%)
Place of birth for the foreign-born population - Micronesia (%)
Place of birth for the foreign-born population - Bahamas (%)
Place of birth for the foreign-born population - Barbados (%)
Place of birth for the foreign-born population - Cuba (%)
Place of birth for the foreign-born population - Dominica (%)
Place of birth for the foreign-born population - Dominican Republic (%)
Place of birth for the foreign-born population - Grenada (%)
Place of birth for the foreign-born population - Haiti (%)
Place of birth for the foreign-born population - Jamaica (%)
Place of birth for the foreign-born population - St. Vincent and the Grenadines (%)
Place of birth for the foreign-born population - Trinidad and Tobago (%)
Place of birth for the foreign-born population - West Indies (%)
Place of birth for the foreign-born population - Other Caribbean (%)
Place of birth for the foreign-born population - Belize (%)
Place of birth for the foreign-born population - Costa Rica (%)
Place of birth for the foreign-born population - El Salvador (%)
Place of birth for the foreign-born population - Guatemala (%)
Place of birth for the foreign-born population - Honduras (%)
Place of birth for the foreign-born population - Mexico (%)
Place of birth for the foreign-born population - Nicaragua (%)
Place of birth for the foreign-born population - Panama (%)
Place of birth for the foreign-born population - Other Central America (%)
Place of birth for the foreign-born population - Argentina (%)
Place of birth for the foreign-born population - Bolivia (%)
Place of birth for the foreign-born population - Brazil (%)
Place of birth for the foreign-born population - Chile (%)
Place of birth for the foreign-born population - Colombia (%)
Place of birth for the foreign-born population - Ecuador (%)
Place of birth for the foreign-born population - Guyana (%)
Place of birth for the foreign-born population - Peru (%)
Place of birth for the foreign-born population - Uruguay (%)
Place of birth for the foreign-born population - Venezuela (%)
Place of birth for the foreign-born population - Other South America (%)
Place of birth for the foreign-born population - Canada (%)
Place of birth for the foreign-born population - Other Northern America (%)
Place of birth for the foreign-born population - Other (%)
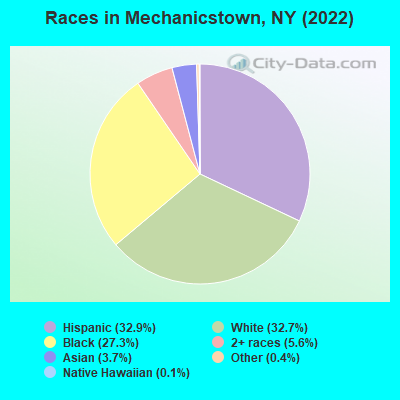
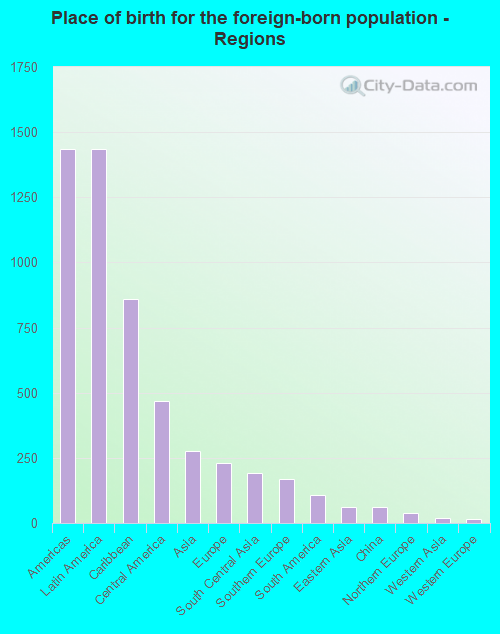
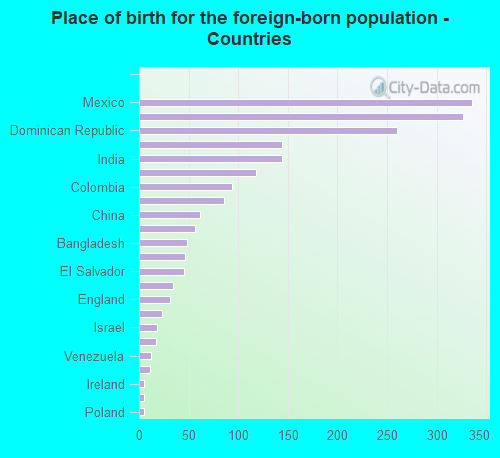
According to 2022 data, the most numerous races in Mechanicstown, NY are White alone (2,856 residents), Hispanic (2,865 residents), and Black alone (2,385 residents). 70.3% of Mechanicstown residents speak English at home. 22.3% of Mechanicstown, NY residents are foreign-born (16.9% born in Latin America, 3.3% born in Asia, 2.7% born in Europe), which is about the same as the foreign-born rate of 22.0% across the entire state of New York.
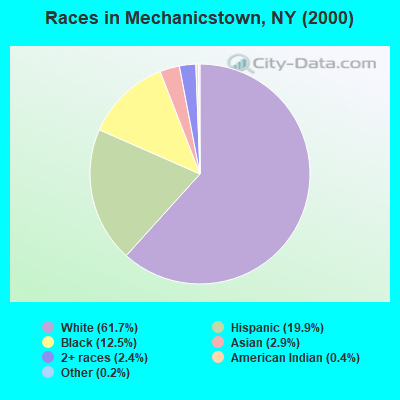
Race distribution in Mechanicstown
2000 2022
11,760,981 62.0% White alone 2,867,583 15.1% Hispanic 2,812,623 14.8% Black alone 1,035,926 5.5% Asian alone 366,116 1.9% Two or more races 75,499 0.4% Other race alone 52,499 0.3% American Indian alone 5,230 0.03% Native Hawaiian and Other
10,408,933 52.9% White alone 3,867,299 19.7% Hispanic 2,633,840 13.4% Black alone 1,776,286 9.0% Asian alone 732,670 3.7% Two or more races 216,110 1.1% Other race alone 35,082 0.2% American Indian alone 6,931 0.04% Native Hawaiian and Other
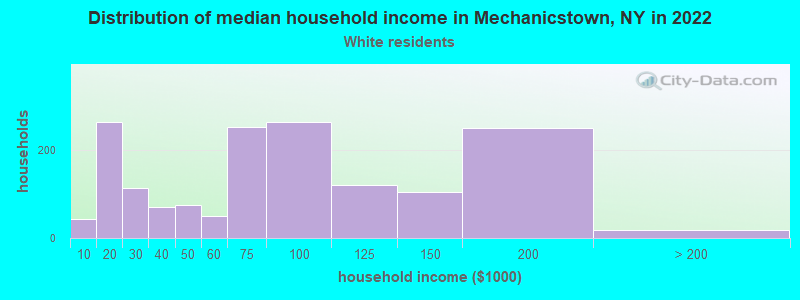
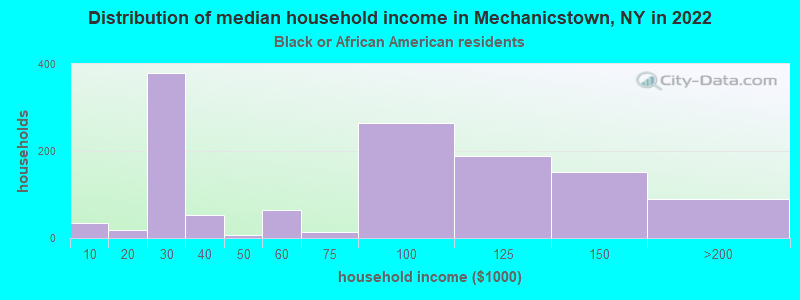
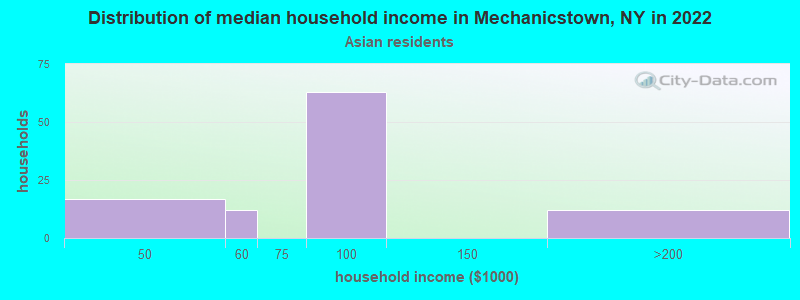
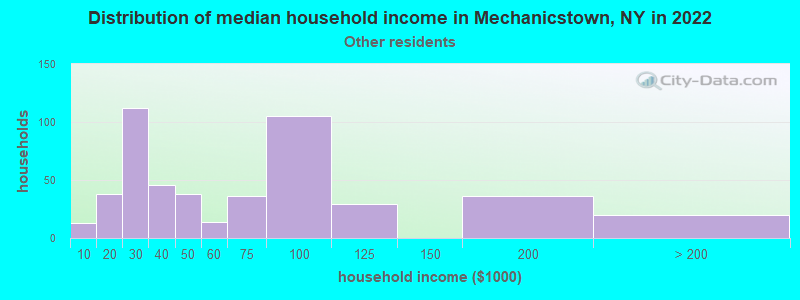
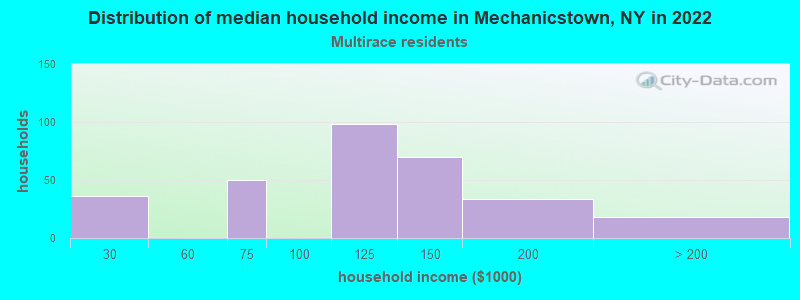
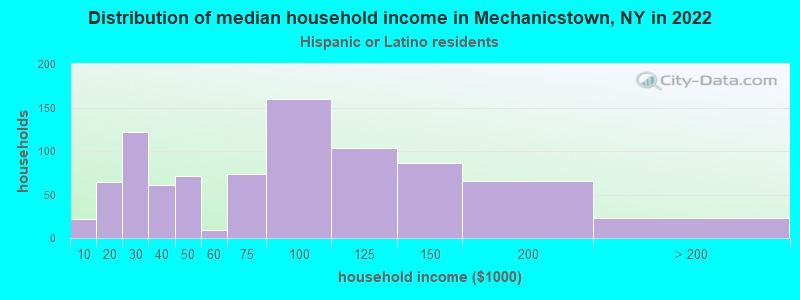
Income and house value in Mechanicstown Median household income in 2022 $63,234 White non-Hispanic householders$80,467 Black householders$74,289 Asian householders$50,262 Some other race householders$119,988 Two or more races householders$83,236 Hispanic or Latino race householdersMedian 2022 house value $267,157 White Non-Hispanic householders$267,705 Black or African American householders $339,021 Asian householders$325,855 Some other race householders$274,288 Two or more races householders$289,100 Hispanic or Latino householders
Median age by race in Mechanicstown
48.9 Median age for White residents44.9 60.5 41.5 Median age for Black or African American residents39.9 45.5 -671,929,823.9 Median age for American Indian / Alaska Native residents-677,083,332.7 -603,603,603.0 36.3 Median age for Asian residents39.8 34.5 -487,992,314.6 Median age for Native Hawaiian / Pacific Islander residents-477,502,295.2 -497,387,669.3 29.2 Median age for Other race residents23.0 39.9 11.6 Median age for Two or more races residents23.3 11.7 53.8 Median age for White alone residents44.4 63.2 24.5 Median age for Hispanic or Latino residents22.0 32.9
Owner/renter occupied households by race in Mechanicstown
House owners and renters - White residents 983 59.3% Owner occupied676 40.7% Renter occupiedHouse owners and renters - Black or African American residents 456 39.5% Owner occupied697 60.5% Renter occupiedHouse owners and renters - Asian residents 54 48.2% Owner occupied58 51.8% Renter occupiedHouse owners and renters - Other race residents 154 33.6% Owner occupied304 66.4% Renter occupiedHouse owners and renters - Two or more races residents 169 53.7% Owner occupied146 46.3% Renter occupiedHouse owners and renters - White alone residents 983 64.1% Owner occupied551 35.9% Renter occupiedHouse owners and renters - Hispanic or Latino residents 292 35.6% Owner occupied527 64.4% Renter occupied
Language usage in Mechanicstown
English speakers - Total 70.3% of residents of Mechanicstown speak English at home.
21.2% of residents speak Spanish at home 1,014 58.5% Speak English very well718 41.5% Speak English less than very well8.0% of residents speak other language at home 391 60.1% Speak English very well260 39.9% Speak English less than very well
English speakers - Born in the United States 98.8% of residents of Mechanicstown speak English at home.
2.5% of residents speak Spanish at home 15 100.0% Speak English less than very well
English speakers - Native, born elsewhere 0.0% of residents of Mechanicstown speak English at home.
96.0% of residents speak Spanish at home 182 85.0% Speak English very well32 15.0% Speak English less than very well5.4% of residents speak other language at home 12 100.0% Speak English very well
English speakers - Foreign-born 29.3% of residents of Mechanicstown speak English at home.
48.6% of residents speak Spanish at home 400 38.4% Speak English very well642 61.6% Speak English less than very well22.1% of residents speak other language at home 276 58.4% Speak English very well197 41.6% Speak English less than very well
White (Caucasian) - Speak only English Native:
90.0% (2,493)Foreign-born:
35.3% (201)
White (Caucasian) - Speak another language Native:
7.6% (209)Foreign-born:
62.6% (357)
Black or African American - Speak only English Native:
95.9% (1,517)Foreign-born:
48.2% (325)
Black or African American - Speak another language Native:
1.3% (20)Foreign-born:
48.0% (323)
American Indian / Alaska Native - Speak another language Native:
100.0% (17)Foreign-born:
100.0% (20)
Asian - Speak another language Native:
62.6% (23)Foreign-born:
82.3% (225)
Other race - Speak another language Native:
52.3% (492)Foreign-born:
97.2% (433)
White alone - Speak only English Native:
92.0% (2,424)Foreign-born:
96.0% (199)
White alone - Speak another language Native:
3.2% (85)Foreign-born:
13.8% (29)
Hispanic or Latino - Speak another language Native:
38.7% (686)Foreign-born:
100.0% (1,040)
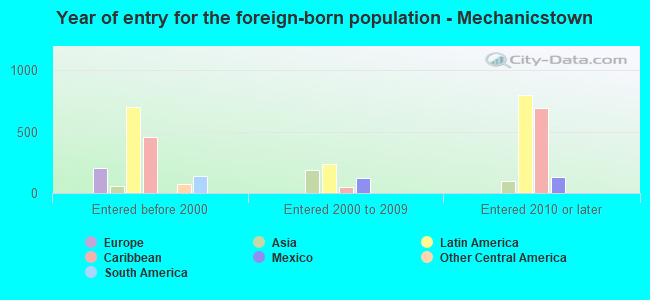
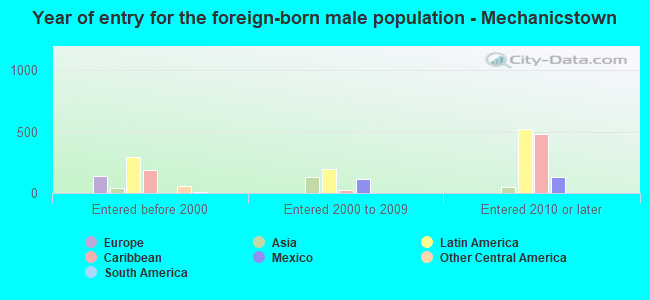
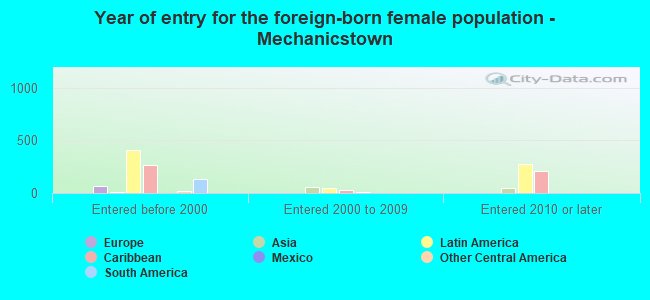
Foreign-born residents in Mechanicstown 1,944 residents are foreign born (16.9% Latin America , 3.3% Asia , 2.7% Europe ).
This city:
22.3%New York:
22.6%
Marital status for residents in Mechanicstown Marital status - White (Caucasian) population 15 years and over
Males 45.9% Never married37.7% Now married0.9% Separated3.1% Widowed12.4% DivorcedFemales 18.4% Never married32.9% Now married3.3% Separated20.2% Widowed25.1% DivorcedWomen who gave birth in the past 12 months Now married:
27.5% (12)Unmarried:
72.5% (32)
Women who did not give birth in the past 12 months Now married:
28.4% (143)Unmarried:
71.6% (360)
Marital status - Black or African American population 15 years and over
Males 22.1% Never married69.9% Now married0.0% Separated6.1% Widowed2.0% DivorcedFemales 30.0% Never married43.0% Now married1.2% Separated8.7% Widowed17.1% DivorcedWomen who gave birth in the past 12 months Now married:
100.0% (173)Unmarried:
0.0% (0)
Women who did not give birth in the past 12 months Now married:
31.8% (163)Unmarried:
68.2% (350)
Marital status - American Indian / Alaska Native population 15 years and over
Males 100.0% Never married0.0% Now married0.0% Separated0.0% Widowed0.0% DivorcedFemales 0.0% Never married100.0% Now married0.0% Separated0.0% Widowed0.0% DivorcedMarital status - Asian population 15 years and over
Males 46.4% Never married53.6% Now married0.0% Separated0.0% Widowed0.0% DivorcedFemales 0.0% Never married80.5% Now married0.0% Separated19.5% Widowed0.0% DivorcedWomen who gave birth in the past 12 months Now married:
100.0% (13)Unmarried:
0.0% (0)
Women who did not give birth in the past 12 months Now married:
100.0% (68)Unmarried:
0.0% (0)
Marital status - Other race population 15 years and over
Males 54.8% Never married19.3% Now married16.6% Separated0.0% Widowed9.3% DivorcedFemales 45.8% Never married22.1% Now married11.3% Separated7.2% Widowed13.6% DivorcedWomen who gave birth in the past 12 months Now married:
0.0% (0)Unmarried:
100.0% (25)
Women who did not give birth in the past 12 months Now married:
36.8% (136)Unmarried:
63.2% (234)
Marital status - Two or more races population 15 years and over
Males 60.3% Never married31.6% Now married8.1% Separated0.0% Widowed0.0% DivorcedFemales 39.5% Never married36.4% Now married11.2% Separated0.4% Widowed12.4% DivorcedWomen who gave birth in the past 12 months Now married:
27.3% (17)Unmarried:
72.7% (44)
Women who did not give birth in the past 12 months Now married:
48.4% (83)Unmarried:
51.6% (89)
Marital status - White alone, not Hispanic / Latino population 15 years and over
Males 35.4% Never married43.6% Now married1.2% Separated4.4% Widowed15.5% DivorcedFemales 17.0% Never married29.7% Now married2.8% Separated20.8% Widowed29.7% DivorcedWomen who gave birth in the past 12 months Now married:
27.5% (13)Unmarried:
72.5% (35)
Women who did not give birth in the past 12 months Now married:
27.1% (120)Unmarried:
72.9% (322)
Marital status - Hispanic or Latino population 15 years and over
Males 66.1% Never married20.7% Now married7.7% Separated0.0% Widowed5.5% DivorcedFemales 41.1% Never married29.0% Now married10.3% Separated9.6% Widowed10.0% DivorcedWomen who gave birth in the past 12 months Now married:
0.0% (0)Unmarried:
100.0% (54)
Women who did not give birth in the past 12 months Now married:
30.5% (157)Unmarried:
69.5% (358)
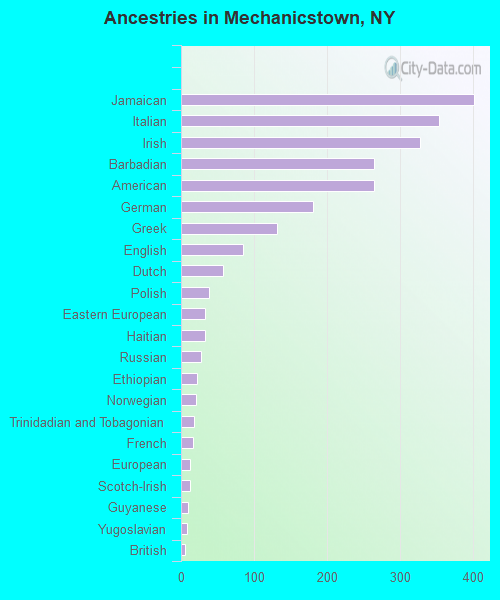
Ancestries in Mechanicstown
402 8.7% Jamaican353 7.6% Italian328 7.1% Irish265 5.7% Barbadian264 5.7% American181 3.9% German131 2.8% Greek85 1.8% English58 1.3% Dutch39 0.8% Polish33 0.7% Eastern European33 0.7% Haitian27 0.6% Russian22 0.5% Ethiopian20 0.4% Norwegian18 0.4% Trinidadian and Tobagonian16 0.3% French13 0.3% European13 0.3% Scotch-Irish10 0.2% Guyanese8 0.2% Yugoslavian5 0.1% British
Geographical mobility in Mechanicstown Same house 1 year ago 3,172 92.0% White (Caucasian)2,331 95.7% Black or African American37 100.0% American Indian / Alaska Native312 99.1% Asian10 89.7% Native Hawaiian / Pacific Islander1,253 84.3% Other race1,280 93.3% Two or more races2,564 89.8% White alone, not Hispanic / Latino2,651 92.3% Hispanic or LatinoMoved within same county 144 4.2% White / Caucasian27 1.1% Black or African American38 2.6% Other race72 5.2% Two or more races144 5.0% White alone, not Hispanic / Latino89 3.1% Hispanic or LatinoMoved within same state 89 2.6% White / Caucasian13 0.5% Black or African American104 3.6% White alone, not Hispanic / Latino13 0.5% Hispanic or LatinoMoved from different state 10 0.3% White / Caucasian28 1.2% Black or African American23 1.6% Other race12 0.4% White alone, not Hispanic / Latino35 1.2% Hispanic or LatinoMoved from abroad 88 5.9% Other race77 2.7% Hispanic or Latino
Children Nativity (place of birth) in Mechanicstown
Children under 6 years - Living with two parents Both parents native 334 100.0% NativeBoth parents foreign-born 11 100.0% NativeOne native, one foreign-born parent 123 100.0% NativeChildren under 6 years - Living with one parent Native parent 158 100.0% NativeForeign-born parent 68 100.0% NativeChildren 6 to 17 years - Living with two parents Both parents native 261 100.0% NativeBoth parents foreign-born 57 21.3% Native210 78.7% Foreign-bornOne native, one foreign-born parent 35 100.0% NativeChildren 6 to 17 years - Living with one parent Native parent 423 100.0% NativeForeign-born parent 298 62.2% Native181 37.8% Foreign-born
Grandparents responsible for own grandchildren in Mechanicstown
Grandparents (30 to 59 years) White / Caucasian 12 100.0% Not responsible for grandchildrenBlack or African American 60 100.0% Not responsible for grandchildrenWhite alone, not Hispanic / Latino 15 100.0% Not responsible for grandchildren
Grandparents (60 years and over) Black or African American 20 100.0% Not responsible for grandchildren