Races in Medford, New York (NY) Detailed Stats
Data:
Races - White alone (%)
Races - White alone (% change since 2000)
Races - Black alone (%)
Races - Black alone (% change since 2000)
Races - American Indian alone (%)
Races - American Indian alone (% change since 2000)
Races - Asian alone (%)
Races - Asian alone (% change since 2000)
Races - Hispanic (%)
Races - Hispanic (% change since 2000)
Races - Native Hawaiian and Other Pacific Islander alone (%)
Races - Native Hawaiian and Other Pacific Islander alone (% change since 2000)
Races - Two or more races(%)
Races - Two or more races(% change since 2000)
Races - Other race alone (%)
Races - Other race alone (% change since 2000)
Racial diversity
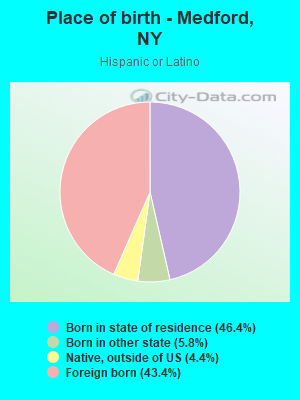
Place of birth - Born in state of residence (%)
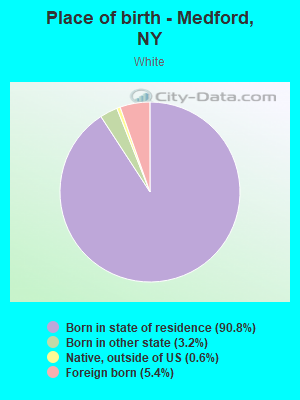
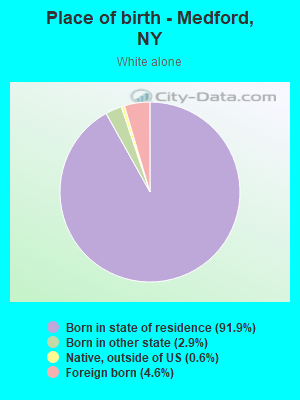
Place of birth - Born in state of residence (%) - White
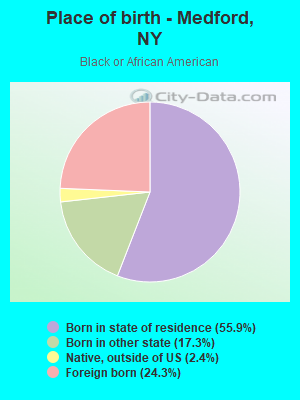
Place of birth - Born in state of residence (%) - Black or African American
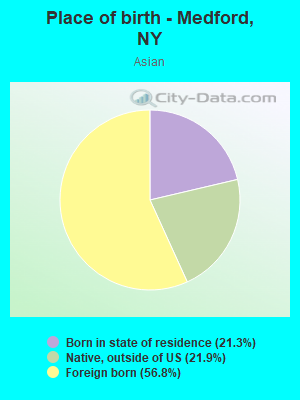
Place of birth - Born in state of residence (%) - Asian
Place of birth - Born in state of residence (%) - Hispanic or Latino
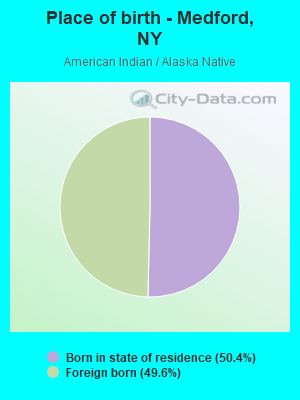
Place of birth - Born in state of residence (%) - American Indian and Alaska Native
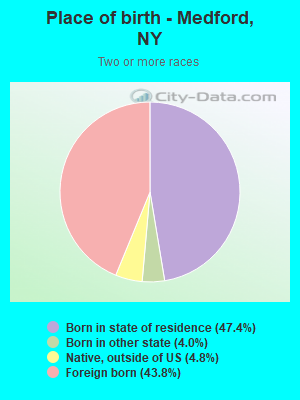
Place of birth - Born in state of residence (%) - Multirace
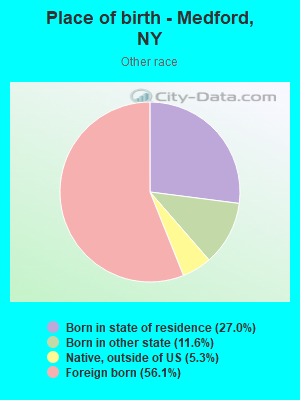
Place of birth - Born in state of residence (%) - Other Race
Place of birth - Born in other state (%)
Place of birth - Born in other state (%) - White
Place of birth - Born in other state (%) - Black or African American
Place of birth - Born in other state (%) - Asian
Place of birth - Born in other state (%) - Hispanic or Latino
Place of birth - Born in other state (%) - American Indian and Alaska Native
Place of birth - Born in other state (%) - Multirace
Place of birth - Born in other state (%) - Other Race
Place of birth - Native, outside of US (%)
Place of birth - Native, outside of US (%) - White
Place of birth - Native, outside of US (%) - Black or African American
Place of birth - Native, outside of US (%) - Asian
Place of birth - Native, outside of US (%) - Hispanic or Latino
Place of birth - Native, outside of US (%) - American Indian and Alaska Native
Place of birth - Native, outside of US (%) - Multirace
Place of birth - Native, outside of US (%) - Other Race
Place of birth - Foreign born (%)
Place of birth - Foreign born (%) - White
Place of birth - Foreign born (%) - Black or African American
Place of birth - Foreign born (%) - Asian
Place of birth - Foreign born (%) - Hispanic or Latino
Place of birth - Foreign born (%) - American Indian and Alaska Native
Place of birth - Foreign born (%) - Multirace
Place of birth - Foreign born (%) - Other Race
Residents speaking English at home (%)
Residents speaking English at home - Born in the United States (%)
Residents speaking English at home - Native, born elsewhere (%)
Residents speaking English at home - Foreign born (%)
Residents speaking Spanish at home (%)
Residents speaking Spanish at home - Born in the United States (%)
Residents speaking Spanish at home - Native, born elsewhere (%)
Residents speaking Spanish at home - Foreign born (%)
Residents speaking other language at home (%)
Residents speaking other language at home - Born in the United States (%)
Residents speaking other language at home - Native, born elsewhere (%)
Residents speaking other language at home - Foreign born (%)
Marital status - Never married (%)
Marital status - Now married (%)
Marital status - Separated (%)
Marital status - Widowed (%)
Marital status - Divorced (%)
Ancestries Reported - Arab (%)
Ancestries Reported - Czech (%)
Ancestries Reported - Danish (%)
Ancestries Reported - Dutch (%)
Ancestries Reported - English (%)
Ancestries Reported - French (%)
Ancestries Reported - French Canadian (%)
Ancestries Reported - German (%)
Ancestries Reported - Greek (%)
Ancestries Reported - Hungarian (%)
Ancestries Reported - Irish (%)
Ancestries Reported - Italian (%)
Ancestries Reported - Lithuanian (%)
Ancestries Reported - Norwegian (%)
Ancestries Reported - Polish (%)
Ancestries Reported - Portuguese (%)
Ancestries Reported - Russian (%)
Ancestries Reported - Scotch-Irish (%)
Ancestries Reported - Scottish (%)
Ancestries Reported - Slovak (%)
Ancestries Reported - Subsaharan African (%)
Ancestries Reported - Swedish (%)
Ancestries Reported - Swiss (%)
Ancestries Reported - Ukrainian (%)
Ancestries Reported - United States (%)
Ancestries Reported - Welsh (%)
Ancestries Reported - West Indian (%)
Ancestries Reported - Other (%)
Geographical mobility - Same house 1 year ago (%)
Geographical mobility - Same house 1 year ago (%) - White
Geographical mobility - Same house 1 year ago (%) - Black or African American
Geographical mobility - Same house 1 year ago (%) - Asian
Geographical mobility - Same house 1 year ago (%) - Hispanic or Latino
Geographical mobility - Same house 1 year ago (%) - American Indian and Alaska Native
Geographical mobility - Same house 1 year ago (%) - Multirace
Geographical mobility - Same house 1 year ago (%) - Other Race
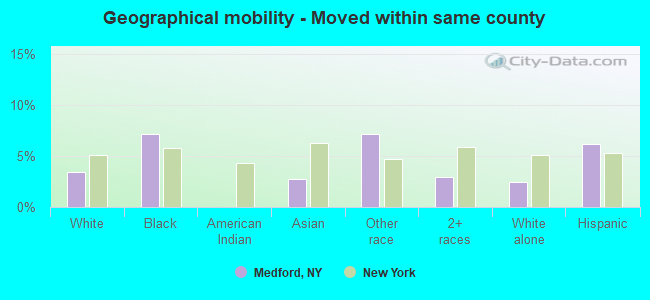
Geographical mobility - Moved within same county (%)
Geographical mobility - Moved within same county (%) - White
Geographical mobility - Moved within same county (%) - Black or African American
Geographical mobility - Moved within same county (%) - Asian
Geographical mobility - Moved within same county (%) - Hispanic or Latino
Geographical mobility - Moved within same county (%) - American Indian and Alaska Native
Geographical mobility - Moved within same county (%) - Multirace
Geographical mobility - Moved within same county (%) - Other Race
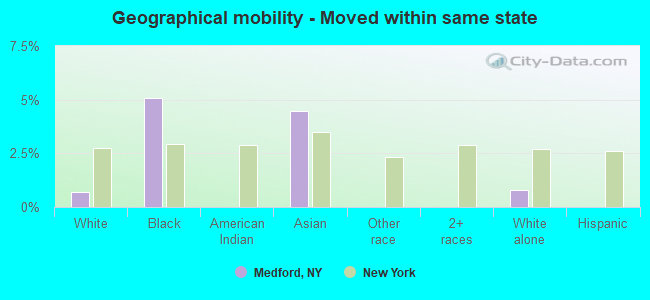
Geographical mobility - Moved from different county within same state (%)
Geographical mobility - Moved from different county within same state (%) - White
Geographical mobility - Moved from different county within same state (%) - Black or African American
Geographical mobility - Moved from different county within same state (%) - Asian
Geographical mobility - Moved from different county within same state (%) - Hispanic or Latino
Geographical mobility - Moved from different county within same state (%) - American Indian and Alaska Native
Geographical mobility - Moved from different county within same state (%) - Multirace
Geographical mobility - Moved from different county within same state (%) - Other Race
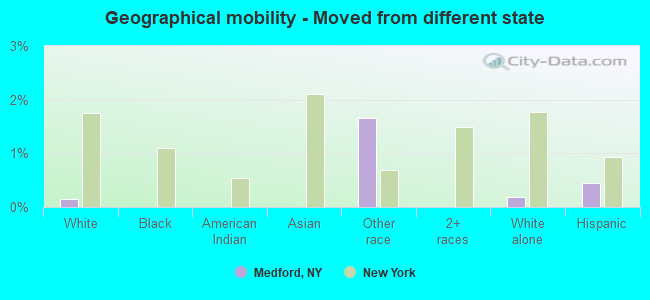
Geographical mobility - Moved from different state (%)
Geographical mobility - Moved from different state (%) - White
Geographical mobility - Moved from different state (%) - Black or African American
Geographical mobility - Moved from different state (%) - Asian
Geographical mobility - Moved from different state (%) - Hispanic or Latino
Geographical mobility - Moved from different state (%) - American Indian and Alaska Native
Geographical mobility - Moved from different state (%) - Multirace
Geographical mobility - Moved from different state (%) - Other Race
Geographical mobility - Moved from abroad (%)
Geographical mobility - Moved from abroad (%) - White
Geographical mobility - Moved from abroad (%) - Black or African American
Geographical mobility - Moved from abroad (%) - Asian
Geographical mobility - Moved from abroad (%) - Hispanic or Latino
Geographical mobility - Moved from abroad (%) - American Indian and Alaska Native
Geographical mobility - Moved from abroad (%) - Multirace
Geographical mobility - Moved from abroad (%) - Other Race
Place of birth for the foreign-born population - Ireland (%)
Place of birth for the foreign-born population - Denmark (%)
Place of birth for the foreign-born population - Norway (%)
Place of birth for the foreign-born population - Sweden (%)
Place of birth for the foreign-born population - United Kingdom (%)
Place of birth for the foreign-born population - England (%)
Place of birth for the foreign-born population - Scotland (%)
Place of birth for the foreign-born population - Other Northern Europe (%)
Place of birth for the foreign-born population - Austria (%)
Place of birth for the foreign-born population - Belgium (%)
Place of birth for the foreign-born population - France (%)
Place of birth for the foreign-born population - Germany (%)
Place of birth for the foreign-born population - Netherlands (%)
Place of birth for the foreign-born population - Switzerland (%)
Place of birth for the foreign-born population - Other Western Europe (%)
Place of birth for the foreign-born population - Greece (%)
Place of birth for the foreign-born population - Italy (%)
Place of birth for the foreign-born population - Portugal (%)
Place of birth for the foreign-born population - Spain (%)
Place of birth for the foreign-born population - Other Southern Europe (%)
Place of birth for the foreign-born population - Albania (%)
Place of birth for the foreign-born population - Belarus (%)
Place of birth for the foreign-born population - Bosnia and Herzegovina (%)
Place of birth for the foreign-born population - Bulgaria (%)
Place of birth for the foreign-born population - Croatia (%)
Place of birth for the foreign-born population - Czechoslovakia (%)
Place of birth for the foreign-born population - Hungary (%)
Place of birth for the foreign-born population - Latvia (%)
Place of birth for the foreign-born population - Lithuania (%)
Place of birth for the foreign-born population - North Macedonia (Macedonia) (%)
Place of birth for the foreign-born population - Moldova (%)
Place of birth for the foreign-born population - Poland (%)
Place of birth for the foreign-born population - Romania (%)
Place of birth for the foreign-born population - Russia (%)
Place of birth for the foreign-born population - Serbia (%)
Place of birth for the foreign-born population - Ukraine (%)
Place of birth for the foreign-born population - Other Eastern Europe (%)
Place of birth for the foreign-born population - China (%)
Place of birth for the foreign-born population - Hong Kong (%)
Place of birth for the foreign-born population - Taiwan (%)
Place of birth for the foreign-born population - Japan (%)
Place of birth for the foreign-born population - Korea (%)
Place of birth for the foreign-born population - Other Eastern Asia (%)
Place of birth for the foreign-born population - Afghanistan (%)
Place of birth for the foreign-born population - Bangladesh (%)
Place of birth for the foreign-born population - India (%)
Place of birth for the foreign-born population - Iran (%)
Place of birth for the foreign-born population - Kazakhstan (%)
Place of birth for the foreign-born population - Nepal (%)
Place of birth for the foreign-born population - Pakistan (%)
Place of birth for the foreign-born population - Sri Lanka (%)
Place of birth for the foreign-born population - Uzbekistan (%)
Place of birth for the foreign-born population - Other South Central Asia (%)
Place of birth for the foreign-born population - Burma (%)
Place of birth for the foreign-born population - Cambodia (%)
Place of birth for the foreign-born population - Indonesia (%)
Place of birth for the foreign-born population - Laos (%)
Place of birth for the foreign-born population - Malaysia (%)
Place of birth for the foreign-born population - Philippines (%)
Place of birth for the foreign-born population - Singapore (%)
Place of birth for the foreign-born population - Thailand (%)
Place of birth for the foreign-born population - Vietnam (%)
Place of birth for the foreign-born population - Other South Eastern Asia (%)
Place of birth for the foreign-born population - Armenia (%)
Place of birth for the foreign-born population - Iraq (%)
Place of birth for the foreign-born population - Israel (%)
Place of birth for the foreign-born population - Jordan (%)
Place of birth for the foreign-born population - Kuwait (%)
Place of birth for the foreign-born population - Lebanon (%)
Place of birth for the foreign-born population - Saudi Arabia (%)
Place of birth for the foreign-born population - Syria (%)
Place of birth for the foreign-born population - Turkey (%)
Place of birth for the foreign-born population - Yemen (%)
Place of birth for the foreign-born population - Other Western Asia (%)
Place of birth for the foreign-born population - Eritrea (%)
Place of birth for the foreign-born population - Ethiopia (%)
Place of birth for the foreign-born population - Kenya (%)
Place of birth for the foreign-born population - Somalia (%)
Place of birth for the foreign-born population - Uganda (%)
Place of birth for the foreign-born population - Zimbabwe (%)
Place of birth for the foreign-born population - Other Eastern Africa (%)
Place of birth for the foreign-born population - Cameroon (%)
Place of birth for the foreign-born population - Congo (%)
Place of birth for the foreign-born population - Democratic Republic of Congo (Zaire) (%)
Place of birth for the foreign-born population - Other Middle Africa (%)
Place of birth for the foreign-born population - Egypt (%)
Place of birth for the foreign-born population - Morocco (%)
Place of birth for the foreign-born population - Sudan (%)
Place of birth for the foreign-born population - Other Northern Africa (%)
Place of birth for the foreign-born population - South Africa (%)
Place of birth for the foreign-born population - Other Southern Africa (%)
Place of birth for the foreign-born population - Cabo Verde (%)
Place of birth for the foreign-born population - Ghana (%)
Place of birth for the foreign-born population - Liberia (%)
Place of birth for the foreign-born population - Nigeria (%)
Place of birth for the foreign-born population - Senegal (%)
Place of birth for the foreign-born population - Sierra Leone (%)
Place of birth for the foreign-born population - Other Western Africa (%)
Place of birth for the foreign-born population - Australia (%)
Place of birth for the foreign-born population - New Zealand (%)
Place of birth for the foreign-born population - Fiji (%)
Place of birth for the foreign-born population - Micronesia (%)
Place of birth for the foreign-born population - Bahamas (%)
Place of birth for the foreign-born population - Barbados (%)
Place of birth for the foreign-born population - Cuba (%)
Place of birth for the foreign-born population - Dominica (%)
Place of birth for the foreign-born population - Dominican Republic (%)
Place of birth for the foreign-born population - Grenada (%)
Place of birth for the foreign-born population - Haiti (%)
Place of birth for the foreign-born population - Jamaica (%)
Place of birth for the foreign-born population - St. Vincent and the Grenadines (%)
Place of birth for the foreign-born population - Trinidad and Tobago (%)
Place of birth for the foreign-born population - West Indies (%)
Place of birth for the foreign-born population - Other Caribbean (%)
Place of birth for the foreign-born population - Belize (%)
Place of birth for the foreign-born population - Costa Rica (%)
Place of birth for the foreign-born population - El Salvador (%)
Place of birth for the foreign-born population - Guatemala (%)
Place of birth for the foreign-born population - Honduras (%)
Place of birth for the foreign-born population - Mexico (%)
Place of birth for the foreign-born population - Nicaragua (%)
Place of birth for the foreign-born population - Panama (%)
Place of birth for the foreign-born population - Other Central America (%)
Place of birth for the foreign-born population - Argentina (%)
Place of birth for the foreign-born population - Bolivia (%)
Place of birth for the foreign-born population - Brazil (%)
Place of birth for the foreign-born population - Chile (%)
Place of birth for the foreign-born population - Colombia (%)
Place of birth for the foreign-born population - Ecuador (%)
Place of birth for the foreign-born population - Guyana (%)
Place of birth for the foreign-born population - Peru (%)
Place of birth for the foreign-born population - Uruguay (%)
Place of birth for the foreign-born population - Venezuela (%)
Place of birth for the foreign-born population - Other South America (%)
Place of birth for the foreign-born population - Canada (%)
Place of birth for the foreign-born population - Other Northern America (%)
Place of birth for the foreign-born population - Other (%)
Latest news about races in Medford, NY collected exclusively by city-data.com from local newspapers, TV, and radio stations
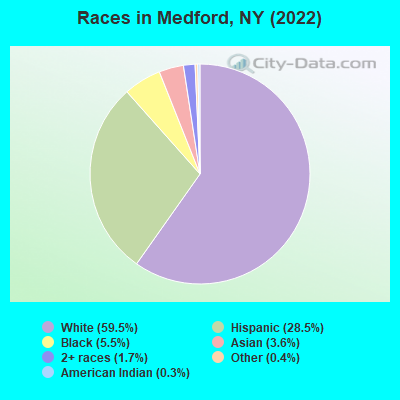
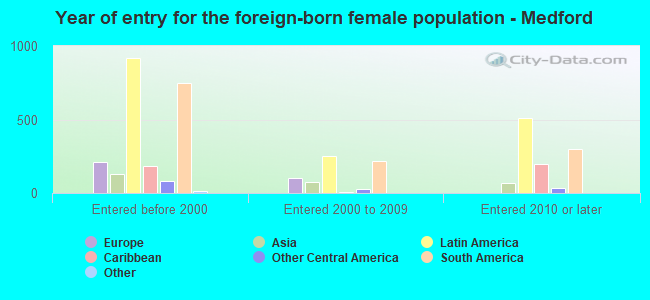
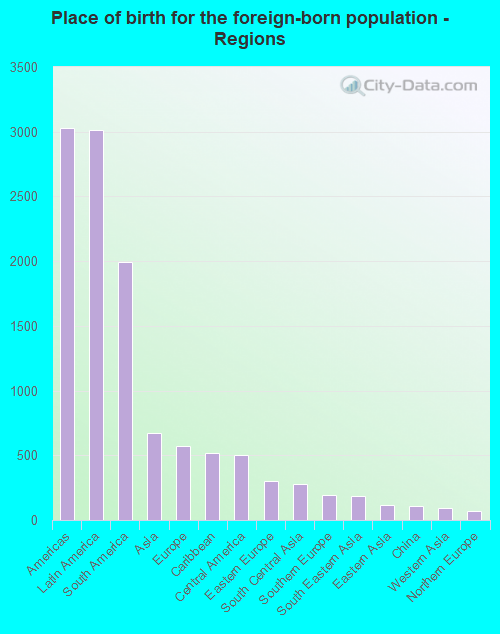
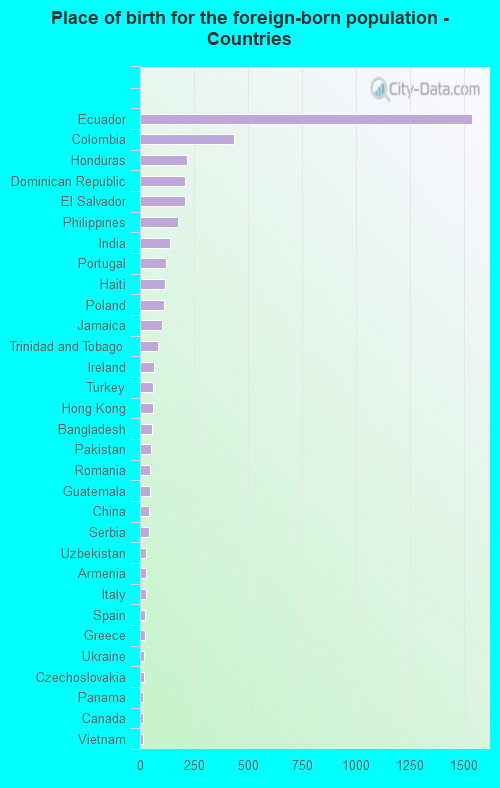
According to 2022 data, the most numerous races in Medford, NY are White alone (14,728 residents), Hispanic (7,051 residents), and Black alone (1,370 residents). 72.3% of Medford residents speak English at home. 17.3% of Medford, NY residents are foreign-born (12.3% born in Latin America, 2.8% born in Asia, 2.3% born in Europe), which is 27.4% less than the foreign-born rate of 22.0% across the entire state of New York.
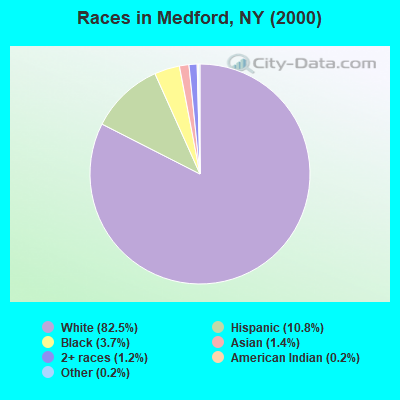
Race distribution in Medford
2000 2022
11,760,981 62.0% White alone 2,867,583 15.1% Hispanic 2,812,623 14.8% Black alone 1,035,926 5.5% Asian alone 366,116 1.9% Two or more races 75,499 0.4% Other race alone 52,499 0.3% American Indian alone 5,230 0.03% Native Hawaiian and Other
10,408,933 52.9% White alone 3,867,299 19.7% Hispanic 2,633,840 13.4% Black alone 1,776,286 9.0% Asian alone 732,670 3.7% Two or more races 216,110 1.1% Other race alone 35,082 0.2% American Indian alone 6,931 0.04% Native Hawaiian and Other
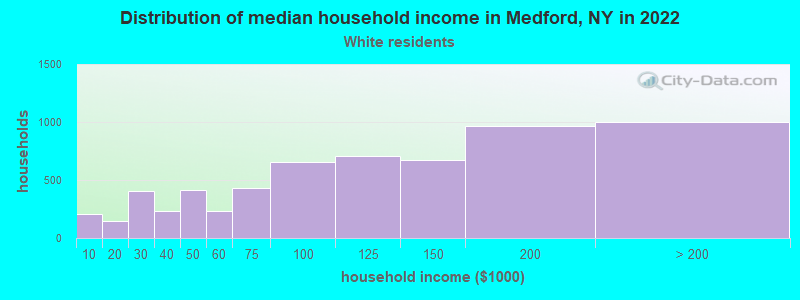
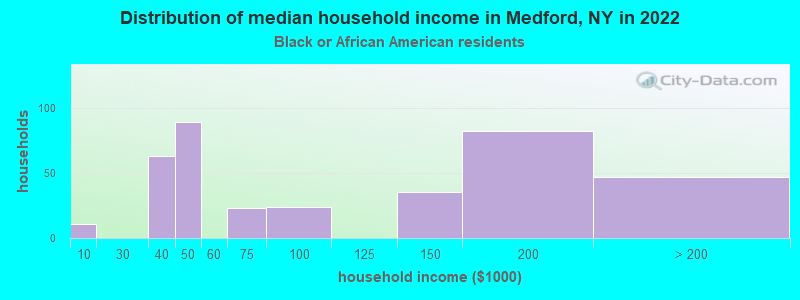
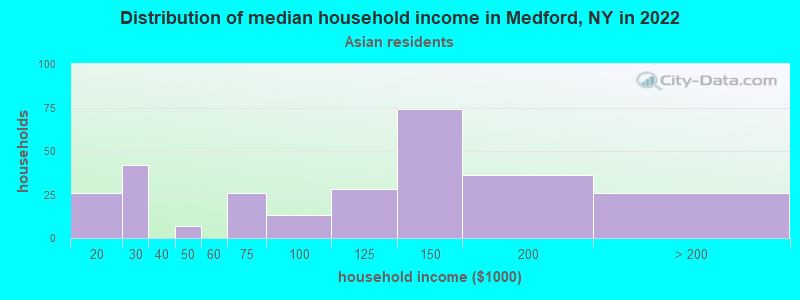
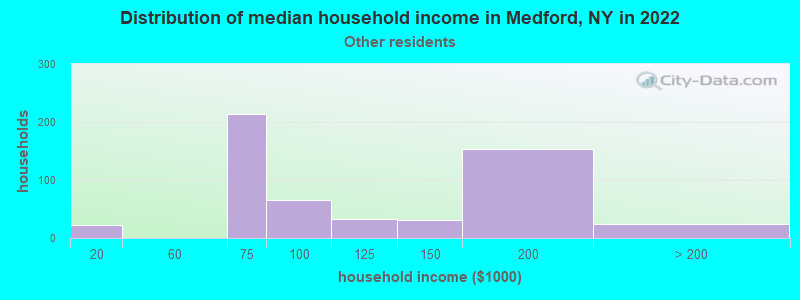
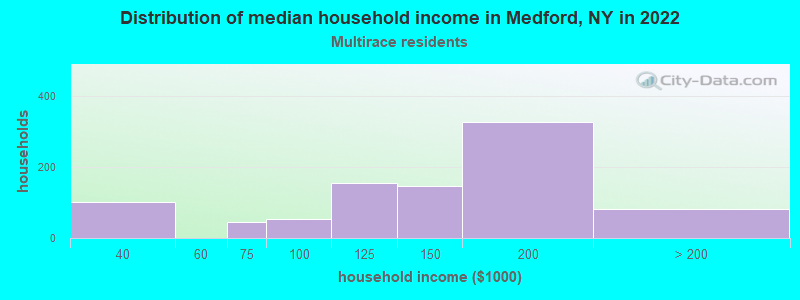
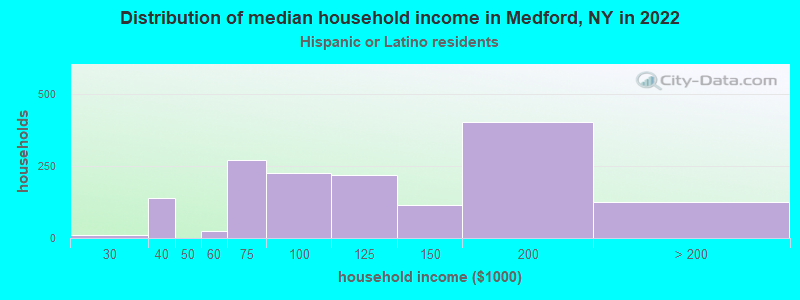
Income and house value in Medford Median household income in 2022 $114,580 White non-Hispanic householders$124,789 Asian householders$81,483 Some other race householders$142,417 Two or more races householders$106,183 Hispanic or Latino race householdersMedian 2022 house value $457,782 White Non-Hispanic householders$468,472 Black or African American householders$412,822 American Indian or Alaska Native householders $516,892 Asian householders$447,407 Some other race householders$485,451 Two or more races householders$447,407 Hispanic or Latino householders
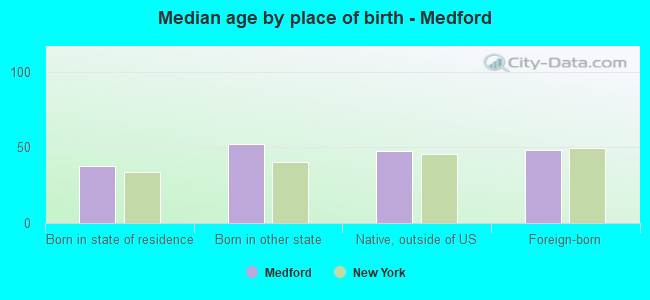
Median age by race in Medford
47.3 Median age for White residents43.8 50.7 38.5 Median age for Black or African American residents35.9 44.0 24.1 Median age for American Indian / Alaska Native residents25.8 -513,692,161.9 43.0 Median age for Asian residents49.5 42.9 -742,816,091.2 Median age for Native Hawaiian / Pacific Islander residents-831,187,409.8 -771,300,447.7 28.7 Median age for Other race residents33.2 23.2 44.7 Median age for Two or more races residents44.3 25.9 49.8 Median age for White alone residents48.4 51.2 33.0 Median age for Hispanic or Latino residents35.8 26.5
Owner/renter occupied households by race in Medford
House owners and renters - White residents 5,591 91.1% Owner occupied546 8.9% Renter occupiedHouse owners and renters - Black or African American residents 334 97.3% Owner occupied9 2.7% Renter occupiedHouse owners and renters - American Indian / Alaska Native residents 49 100.0% Owner occupiedHouse owners and renters - Asian residents 251 100.0% Owner occupiedHouse owners and renters - Other race residents 466 86.6% Owner occupied72 13.4% Renter occupiedHouse owners and renters - Two or more races residents 803 94.7% Owner occupied45 5.3% Renter occupiedHouse owners and renters - White alone residents 5,324 90.1% Owner occupied586 9.9% Renter occupiedHouse owners and renters - Hispanic or Latino residents 1,378 95.1% Owner occupied71 4.9% Renter occupied
Language usage in Medford
English speakers - Total 72.3% of residents of Medford speak English at home.
20.7% of residents speak Spanish at home 2,902 58.9% Speak English very well2,027 41.1% Speak English less than very well7.0% of residents speak other language at home 1,208 72.9% Speak English very well449 27.1% Speak English less than very well
English speakers - Born in the United States 81.9% of residents of Medford speak English at home.
14.9% of residents speak Spanish at home 169 100.0% Speak English very well2.6% of residents speak other language at home 29 100.0% Speak English less than very well
English speakers - Native, born elsewhere 35.0% of residents of Medford speak English at home.
41.3% of residents speak Spanish at home 221 96.9% Speak English very well7 3.1% Speak English less than very well34.4% of residents speak other language at home 190 100.0% Speak English very well
English speakers - Foreign-born 14.0% of residents of Medford speak English at home.
64.9% of residents speak Spanish at home 941 31.3% Speak English very well2,069 68.7% Speak English less than very well22.5% of residents speak other language at home 664 63.6% Speak English very well380 36.4% Speak English less than very well
White (Caucasian) - Speak only English Native:
95.7% (13,901)Foreign-born:
33.8% (289)
White (Caucasian) - Speak another language Native:
4.5% (653)Foreign-born:
67.5% (577)
Black or African American - Speak only English Native:
96.8% (1,047)Foreign-born:
74.7% (260)
Black or African American - Speak another language Native:
0.2% (3)Foreign-born:
29.3% (102)
Asian - Speak only English Native:
49.2% (170)Foreign-born:
3.9% (21)
Asian - Speak another language Native:
50.2% (173)Foreign-born:
100.0% (541)
Other race - Speak another language Native:
69.5% (529)Foreign-born:
100.0% (1,130)
Two or more races - Speak only English Native:
39.3% (984)Foreign-born:
5.0% (99)
Two or more races - Speak another language Native:
59.7% (1,494)Foreign-born:
96.0% (1,918)
White alone - Speak only English Native:
96.5% (13,179)Foreign-born:
46.8% (315)
White alone - Speak another language Native:
3.5% (479)Foreign-born:
53.3% (359)
Hispanic or Latino - Speak only English Native:
46.3% (1,615)Foreign-born:
2.5% (76)
Hispanic or Latino - Speak another language Native:
53.5% (1,864)Foreign-born:
98.0% (3,001)
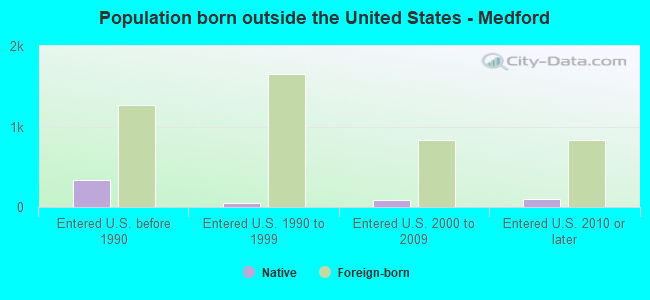
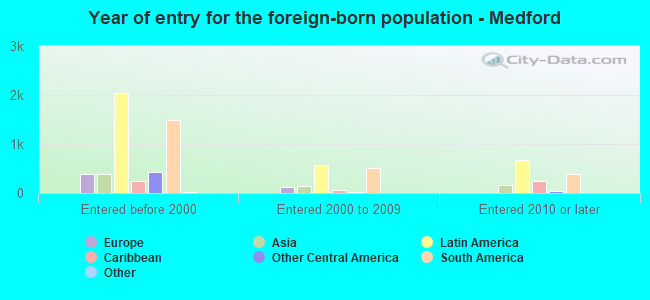
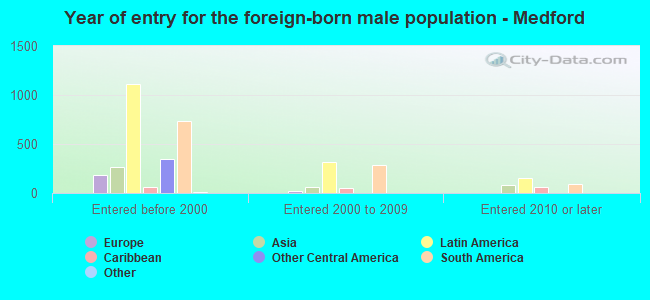
Foreign-born residents in Medford 4,276 residents are foreign born (12.3% Latin America , 2.8% Asia , 2.3% Europe ).
This city:
17.3%New York:
22.6%
Marital status for residents in Medford Marital status - White (Caucasian) population 15 years and over
Males 31.7% Never married58.1% Now married0.2% Separated4.1% Widowed6.0% DivorcedFemales 25.9% Never married53.9% Now married0.3% Separated9.7% Widowed10.2% DivorcedWomen who gave birth in the past 12 months Now married:
68.9% (36)Unmarried:
31.1% (16)
Women who did not give birth in the past 12 months Now married:
51.0% (1,523)Unmarried:
49.0% (1,464)
Marital status - Black or African American population 15 years and over
Males 44.0% Never married40.9% Now married0.0% Separated11.6% Widowed3.5% DivorcedFemales 64.2% Never married22.6% Now married1.2% Separated3.5% Widowed8.6% DivorcedWomen who did not give birth in the past 12 months Now married:
14.1% (59)Unmarried:
85.9% (356)
Marital status - American Indian / Alaska Native population 15 years and over
Males 67.2% Never married32.8% Now married0.0% Separated0.0% Widowed0.0% DivorcedFemales 40.6% Never married59.4% Now married0.0% Separated0.0% Widowed0.0% DivorcedWomen who did not give birth in the past 12 months Now married:
59.4% (59)Unmarried:
40.6% (40)
Marital status - Asian population 15 years and over
Males 31.1% Never married68.9% Now married0.0% Separated0.0% Widowed0.0% DivorcedFemales 37.7% Never married53.4% Now married0.0% Separated0.0% Widowed8.9% DivorcedWomen who did not give birth in the past 12 months Now married:
29.7% (66)Unmarried:
70.3% (155)
Marital status - Other race population 15 years and over
Males 46.4% Never married48.2% Now married0.0% Separated0.0% Widowed5.4% DivorcedFemales 70.9% Never married15.7% Now married0.0% Separated0.0% Widowed13.4% DivorcedWomen who did not give birth in the past 12 months Now married:
19.5% (143)Unmarried:
80.5% (591)
Marital status - Two or more races population 15 years and over
Males 41.9% Never married46.3% Now married4.5% Separated0.0% Widowed7.4% DivorcedFemales 26.8% Never married68.3% Now married1.2% Separated1.9% Widowed1.8% DivorcedWomen who did not give birth in the past 12 months Now married:
39.2% (236)Unmarried:
60.8% (366)
Marital status - White alone, not Hispanic / Latino population 15 years and over
Males 30.8% Never married57.4% Now married0.3% Separated4.7% Widowed6.9% DivorcedFemales 25.2% Never married53.2% Now married0.2% Separated10.2% Widowed11.2% DivorcedWomen who gave birth in the past 12 months Now married:
52.5% (20)Unmarried:
47.5% (18)
Women who did not give birth in the past 12 months Now married:
51.0% (1,445)Unmarried:
49.0% (1,388)
Marital status - Hispanic or Latino population 15 years and over
Males 38.6% Never married56.8% Now married0.0% Separated0.0% Widowed4.6% DivorcedFemales 40.8% Never married51.9% Now married0.9% Separated1.8% Widowed4.7% DivorcedWomen who gave birth in the past 12 months Now married:
100.0% (22)Unmarried:
0.0% (0)
Women who did not give birth in the past 12 months Now married:
35.9% (484)Unmarried:
64.1% (865)
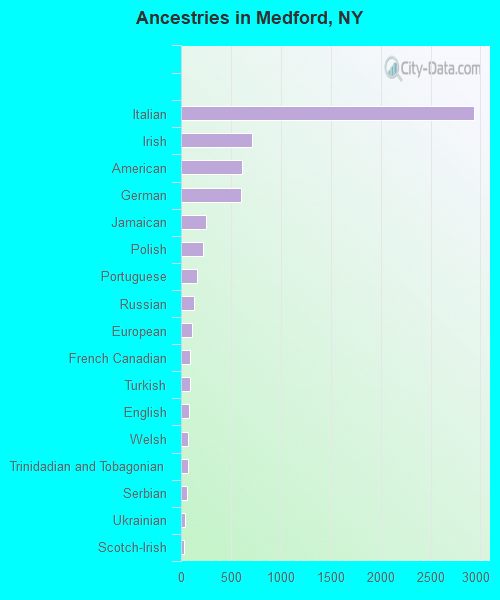
Ancestries in Medford
2,939 24.5% Italian710 5.9% Irish616 5.1% American606 5.0% German251 2.1% Jamaican217 1.8% Polish157 1.3% Portuguese129 1.1% Russian110 0.9% European95 0.8% French Canadian93 0.8% Turkish76 0.6% English74 0.6% Welsh70 0.6% Trinidadian and Tobagonian56 0.5% Serbian38 0.3% Ukrainian35 0.3% Scotch-Irish24 0.2% Austrian23 0.2% Romanian23 0.2% Slovak22 0.2% Hungarian21 0.2% Greek19 0.2% Haitian15 0.1% French7 0.06% Danish1 0.01% African
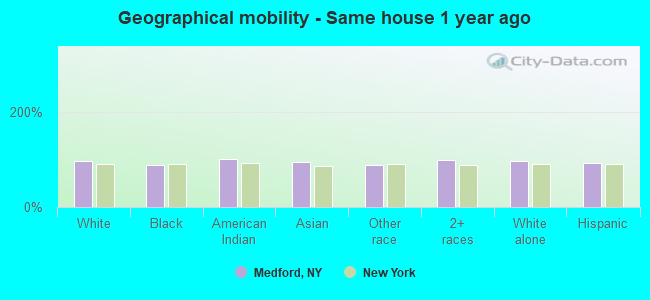
Geographical mobility in Medford Same house 1 year ago 15,299 95.8% White (Caucasian)1,251 87.1% Black or African American278 100.0% American Indian / Alaska Native840 93.9% Asian1,798 87.3% Other race4,468 97.8% Two or more races14,201 96.5% White alone, not Hispanic / Latino6,534 92.6% Hispanic or LatinoMoved within same county 543 3.4% White / Caucasian103 7.2% Black or African American25 2.8% Asian147 7.1% Other race137 3.0% Two or more races367 2.5% White alone, not Hispanic / Latino435 6.2% Hispanic or LatinoMoved within same state 110 0.7% White / Caucasian73 5.1% Black or African American40 4.5% Asian115 0.8% White alone, not Hispanic / LatinoMoved from different state 25 0.2% White / Caucasian34 1.7% Other race26 0.2% White alone, not Hispanic / Latino31 0.4% Hispanic or Latino
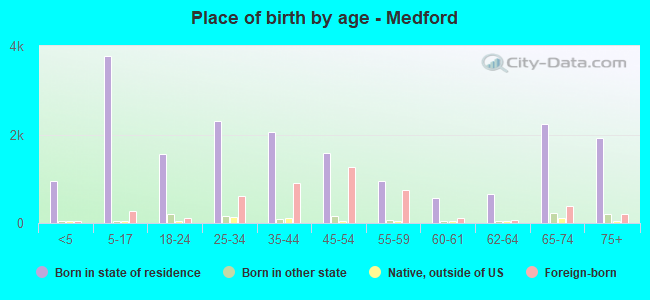
Children Nativity (place of birth) in Medford
Children under 6 years - Living with two parents Both parents native 803 100.0% NativeBoth parents foreign-born 191 100.0% NativeOne native, one foreign-born parent 23 100.0% NativeChildren under 6 years - Living with one parent Native parent 211 100.0% NativeForeign-born parent 77 100.0% NativeChildren 6 to 17 years - Living with two parents Both parents native 1,417 100.0% Native0 0.0% Foreign-bornBoth parents foreign-born 659 89.6% Native77 10.4% Foreign-bornOne native, one foreign-born parent 353 100.0% NativeChildren 6 to 17 years - Living with one parent Native parent 221 100.0% NativeForeign-born parent 421 52.2% Native385 47.8% Foreign-born
Grandparents responsible for own grandchildren in Medford
Grandparents (30 to 59 years) Other race 66 100.0% Not responsible for grandchildrenHispanic or Latino 67 100.0% Not responsible for grandchildrenGrandparents (60 years and over) Other race 73 100.0% Not responsible for grandchildrenHispanic or Latino 6 5.0% Responsible for grandchildren111 95.0% Not responsible for grandchildren