Races in Medina, Ohio (OH) Detailed Stats
Data:
Races - White alone (%)
Races - White alone (% change since 2000)
Races - Black alone (%)
Races - Black alone (% change since 2000)
Races - American Indian alone (%)
Races - American Indian alone (% change since 2000)
Races - Asian alone (%)
Races - Asian alone (% change since 2000)
Races - Hispanic (%)
Races - Hispanic (% change since 2000)
Races - Native Hawaiian and Other Pacific Islander alone (%)
Races - Native Hawaiian and Other Pacific Islander alone (% change since 2000)
Races - Two or more races(%)
Races - Two or more races(% change since 2000)
Races - Other race alone (%)
Races - Other race alone (% change since 2000)
Racial diversity
Place of birth - Born in state of residence (%)
Place of birth - Born in state of residence (%) - White
Place of birth - Born in state of residence (%) - Black or African American
Place of birth - Born in state of residence (%) - Asian
Place of birth - Born in state of residence (%) - Hispanic or Latino
Place of birth - Born in state of residence (%) - American Indian and Alaska Native
Place of birth - Born in state of residence (%) - Multirace
Place of birth - Born in state of residence (%) - Other Race
Place of birth - Born in other state (%)
Place of birth - Born in other state (%) - White
Place of birth - Born in other state (%) - Black or African American
Place of birth - Born in other state (%) - Asian
Place of birth - Born in other state (%) - Hispanic or Latino
Place of birth - Born in other state (%) - American Indian and Alaska Native
Place of birth - Born in other state (%) - Multirace
Place of birth - Born in other state (%) - Other Race
Place of birth - Native, outside of US (%)
Place of birth - Native, outside of US (%) - White
Place of birth - Native, outside of US (%) - Black or African American
Place of birth - Native, outside of US (%) - Asian
Place of birth - Native, outside of US (%) - Hispanic or Latino
Place of birth - Native, outside of US (%) - American Indian and Alaska Native
Place of birth - Native, outside of US (%) - Multirace
Place of birth - Native, outside of US (%) - Other Race
Place of birth - Foreign born (%)
Place of birth - Foreign born (%) - White
Place of birth - Foreign born (%) - Black or African American
Place of birth - Foreign born (%) - Asian
Place of birth - Foreign born (%) - Hispanic or Latino
Place of birth - Foreign born (%) - American Indian and Alaska Native
Place of birth - Foreign born (%) - Multirace
Place of birth - Foreign born (%) - Other Race
Residents speaking English at home (%)
Residents speaking English at home - Born in the United States (%)
Residents speaking English at home - Native, born elsewhere (%)
Residents speaking English at home - Foreign born (%)
Residents speaking Spanish at home (%)
Residents speaking Spanish at home - Born in the United States (%)
Residents speaking Spanish at home - Native, born elsewhere (%)
Residents speaking Spanish at home - Foreign born (%)
Residents speaking other language at home (%)
Residents speaking other language at home - Born in the United States (%)
Residents speaking other language at home - Native, born elsewhere (%)
Residents speaking other language at home - Foreign born (%)
Marital status - Never married (%)
Marital status - Now married (%)
Marital status - Separated (%)
Marital status - Widowed (%)
Marital status - Divorced (%)
Ancestries Reported - Arab (%)
Ancestries Reported - Czech (%)
Ancestries Reported - Danish (%)
Ancestries Reported - Dutch (%)
Ancestries Reported - English (%)
Ancestries Reported - French (%)
Ancestries Reported - French Canadian (%)
Ancestries Reported - German (%)
Ancestries Reported - Greek (%)
Ancestries Reported - Hungarian (%)
Ancestries Reported - Irish (%)
Ancestries Reported - Italian (%)
Ancestries Reported - Lithuanian (%)
Ancestries Reported - Norwegian (%)
Ancestries Reported - Polish (%)
Ancestries Reported - Portuguese (%)
Ancestries Reported - Russian (%)
Ancestries Reported - Scotch-Irish (%)
Ancestries Reported - Scottish (%)
Ancestries Reported - Slovak (%)
Ancestries Reported - Subsaharan African (%)
Ancestries Reported - Swedish (%)
Ancestries Reported - Swiss (%)
Ancestries Reported - Ukrainian (%)
Ancestries Reported - United States (%)
Ancestries Reported - Welsh (%)
Ancestries Reported - West Indian (%)
Ancestries Reported - Other (%)
Geographical mobility - Same house 1 year ago (%)
Geographical mobility - Same house 1 year ago (%) - White
Geographical mobility - Same house 1 year ago (%) - Black or African American
Geographical mobility - Same house 1 year ago (%) - Asian
Geographical mobility - Same house 1 year ago (%) - Hispanic or Latino
Geographical mobility - Same house 1 year ago (%) - American Indian and Alaska Native
Geographical mobility - Same house 1 year ago (%) - Multirace
Geographical mobility - Same house 1 year ago (%) - Other Race
Geographical mobility - Moved within same county (%)
Geographical mobility - Moved within same county (%) - White
Geographical mobility - Moved within same county (%) - Black or African American
Geographical mobility - Moved within same county (%) - Asian
Geographical mobility - Moved within same county (%) - Hispanic or Latino
Geographical mobility - Moved within same county (%) - American Indian and Alaska Native
Geographical mobility - Moved within same county (%) - Multirace
Geographical mobility - Moved within same county (%) - Other Race
Geographical mobility - Moved from different county within same state (%)
Geographical mobility - Moved from different county within same state (%) - White
Geographical mobility - Moved from different county within same state (%) - Black or African American
Geographical mobility - Moved from different county within same state (%) - Asian
Geographical mobility - Moved from different county within same state (%) - Hispanic or Latino
Geographical mobility - Moved from different county within same state (%) - American Indian and Alaska Native
Geographical mobility - Moved from different county within same state (%) - Multirace
Geographical mobility - Moved from different county within same state (%) - Other Race
Geographical mobility - Moved from different state (%)
Geographical mobility - Moved from different state (%) - White
Geographical mobility - Moved from different state (%) - Black or African American
Geographical mobility - Moved from different state (%) - Asian
Geographical mobility - Moved from different state (%) - Hispanic or Latino
Geographical mobility - Moved from different state (%) - American Indian and Alaska Native
Geographical mobility - Moved from different state (%) - Multirace
Geographical mobility - Moved from different state (%) - Other Race
Geographical mobility - Moved from abroad (%)
Geographical mobility - Moved from abroad (%) - White
Geographical mobility - Moved from abroad (%) - Black or African American
Geographical mobility - Moved from abroad (%) - Asian
Geographical mobility - Moved from abroad (%) - Hispanic or Latino
Geographical mobility - Moved from abroad (%) - American Indian and Alaska Native
Geographical mobility - Moved from abroad (%) - Multirace
Geographical mobility - Moved from abroad (%) - Other Race
Place of birth for the foreign-born population - Ireland (%)
Place of birth for the foreign-born population - Denmark (%)
Place of birth for the foreign-born population - Norway (%)
Place of birth for the foreign-born population - Sweden (%)
Place of birth for the foreign-born population - United Kingdom (%)
Place of birth for the foreign-born population - England (%)
Place of birth for the foreign-born population - Scotland (%)
Place of birth for the foreign-born population - Other Northern Europe (%)
Place of birth for the foreign-born population - Austria (%)
Place of birth for the foreign-born population - Belgium (%)
Place of birth for the foreign-born population - France (%)
Place of birth for the foreign-born population - Germany (%)
Place of birth for the foreign-born population - Netherlands (%)
Place of birth for the foreign-born population - Switzerland (%)
Place of birth for the foreign-born population - Other Western Europe (%)
Place of birth for the foreign-born population - Greece (%)
Place of birth for the foreign-born population - Italy (%)
Place of birth for the foreign-born population - Portugal (%)
Place of birth for the foreign-born population - Spain (%)
Place of birth for the foreign-born population - Other Southern Europe (%)
Place of birth for the foreign-born population - Albania (%)
Place of birth for the foreign-born population - Belarus (%)
Place of birth for the foreign-born population - Bosnia and Herzegovina (%)
Place of birth for the foreign-born population - Bulgaria (%)
Place of birth for the foreign-born population - Croatia (%)
Place of birth for the foreign-born population - Czechoslovakia (%)
Place of birth for the foreign-born population - Hungary (%)
Place of birth for the foreign-born population - Latvia (%)
Place of birth for the foreign-born population - Lithuania (%)
Place of birth for the foreign-born population - North Macedonia (Macedonia) (%)
Place of birth for the foreign-born population - Moldova (%)
Place of birth for the foreign-born population - Poland (%)
Place of birth for the foreign-born population - Romania (%)
Place of birth for the foreign-born population - Russia (%)
Place of birth for the foreign-born population - Serbia (%)
Place of birth for the foreign-born population - Ukraine (%)
Place of birth for the foreign-born population - Other Eastern Europe (%)
Place of birth for the foreign-born population - China (%)
Place of birth for the foreign-born population - Hong Kong (%)
Place of birth for the foreign-born population - Taiwan (%)
Place of birth for the foreign-born population - Japan (%)
Place of birth for the foreign-born population - Korea (%)
Place of birth for the foreign-born population - Other Eastern Asia (%)
Place of birth for the foreign-born population - Afghanistan (%)
Place of birth for the foreign-born population - Bangladesh (%)
Place of birth for the foreign-born population - India (%)
Place of birth for the foreign-born population - Iran (%)
Place of birth for the foreign-born population - Kazakhstan (%)
Place of birth for the foreign-born population - Nepal (%)
Place of birth for the foreign-born population - Pakistan (%)
Place of birth for the foreign-born population - Sri Lanka (%)
Place of birth for the foreign-born population - Uzbekistan (%)
Place of birth for the foreign-born population - Other South Central Asia (%)
Place of birth for the foreign-born population - Burma (%)
Place of birth for the foreign-born population - Cambodia (%)
Place of birth for the foreign-born population - Indonesia (%)
Place of birth for the foreign-born population - Laos (%)
Place of birth for the foreign-born population - Malaysia (%)
Place of birth for the foreign-born population - Philippines (%)
Place of birth for the foreign-born population - Singapore (%)
Place of birth for the foreign-born population - Thailand (%)
Place of birth for the foreign-born population - Vietnam (%)
Place of birth for the foreign-born population - Other South Eastern Asia (%)
Place of birth for the foreign-born population - Armenia (%)
Place of birth for the foreign-born population - Iraq (%)
Place of birth for the foreign-born population - Israel (%)
Place of birth for the foreign-born population - Jordan (%)
Place of birth for the foreign-born population - Kuwait (%)
Place of birth for the foreign-born population - Lebanon (%)
Place of birth for the foreign-born population - Saudi Arabia (%)
Place of birth for the foreign-born population - Syria (%)
Place of birth for the foreign-born population - Turkey (%)
Place of birth for the foreign-born population - Yemen (%)
Place of birth for the foreign-born population - Other Western Asia (%)
Place of birth for the foreign-born population - Eritrea (%)
Place of birth for the foreign-born population - Ethiopia (%)
Place of birth for the foreign-born population - Kenya (%)
Place of birth for the foreign-born population - Somalia (%)
Place of birth for the foreign-born population - Uganda (%)
Place of birth for the foreign-born population - Zimbabwe (%)
Place of birth for the foreign-born population - Other Eastern Africa (%)
Place of birth for the foreign-born population - Cameroon (%)
Place of birth for the foreign-born population - Congo (%)
Place of birth for the foreign-born population - Democratic Republic of Congo (Zaire) (%)
Place of birth for the foreign-born population - Other Middle Africa (%)
Place of birth for the foreign-born population - Egypt (%)
Place of birth for the foreign-born population - Morocco (%)
Place of birth for the foreign-born population - Sudan (%)
Place of birth for the foreign-born population - Other Northern Africa (%)
Place of birth for the foreign-born population - South Africa (%)
Place of birth for the foreign-born population - Other Southern Africa (%)
Place of birth for the foreign-born population - Cabo Verde (%)
Place of birth for the foreign-born population - Ghana (%)
Place of birth for the foreign-born population - Liberia (%)
Place of birth for the foreign-born population - Nigeria (%)
Place of birth for the foreign-born population - Senegal (%)
Place of birth for the foreign-born population - Sierra Leone (%)
Place of birth for the foreign-born population - Other Western Africa (%)
Place of birth for the foreign-born population - Australia (%)
Place of birth for the foreign-born population - New Zealand (%)
Place of birth for the foreign-born population - Fiji (%)
Place of birth for the foreign-born population - Micronesia (%)
Place of birth for the foreign-born population - Bahamas (%)
Place of birth for the foreign-born population - Barbados (%)
Place of birth for the foreign-born population - Cuba (%)
Place of birth for the foreign-born population - Dominica (%)
Place of birth for the foreign-born population - Dominican Republic (%)
Place of birth for the foreign-born population - Grenada (%)
Place of birth for the foreign-born population - Haiti (%)
Place of birth for the foreign-born population - Jamaica (%)
Place of birth for the foreign-born population - St. Vincent and the Grenadines (%)
Place of birth for the foreign-born population - Trinidad and Tobago (%)
Place of birth for the foreign-born population - West Indies (%)
Place of birth for the foreign-born population - Other Caribbean (%)
Place of birth for the foreign-born population - Belize (%)
Place of birth for the foreign-born population - Costa Rica (%)
Place of birth for the foreign-born population - El Salvador (%)
Place of birth for the foreign-born population - Guatemala (%)
Place of birth for the foreign-born population - Honduras (%)
Place of birth for the foreign-born population - Mexico (%)
Place of birth for the foreign-born population - Nicaragua (%)
Place of birth for the foreign-born population - Panama (%)
Place of birth for the foreign-born population - Other Central America (%)
Place of birth for the foreign-born population - Argentina (%)
Place of birth for the foreign-born population - Bolivia (%)
Place of birth for the foreign-born population - Brazil (%)
Place of birth for the foreign-born population - Chile (%)
Place of birth for the foreign-born population - Colombia (%)
Place of birth for the foreign-born population - Ecuador (%)
Place of birth for the foreign-born population - Guyana (%)
Place of birth for the foreign-born population - Peru (%)
Place of birth for the foreign-born population - Uruguay (%)
Place of birth for the foreign-born population - Venezuela (%)
Place of birth for the foreign-born population - Other South America (%)
Place of birth for the foreign-born population - Canada (%)
Place of birth for the foreign-born population - Other Northern America (%)
Place of birth for the foreign-born population - Other (%)
Latest news about races in Medina, OH collected exclusively by city-data.com from local newspapers, TV, and radio stations
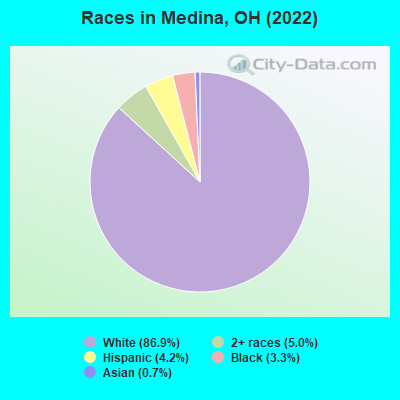
According to 2022 data, the most numerous races in Medina, OH are White alone (22,829 residents), Black alone (864 residents), and Two or more races (1,302 residents). 95.9% of Medina residents speak English at home. 2.3% of Medina, OH residents are foreign-born (0.8% born in Latin America, 0.7% born in Europe, 0.3% born in Asia, 0.3% born in Africa, 0.2% born in North America), which is 73.9% less than the foreign-born rate of 4.0% across the entire state of Ohio.
Race distribution in Medina
2000 2022
9,538,111 84.0% White alone 1,290,662 11.4% Black alone 217,123 1.9% Hispanic 137,770 1.2% Two or more races 131,670 1.2% Asian alone 21,985 0.2% American Indian alone 13,483 0.1% Other race alone 2,336 0.02% Native Hawaiian and Other
8,948,793 76.1% White alone 1,401,403 11.9% Black alone 529,291 4.5% Two or more races 517,232 4.4% Hispanic 293,387 2.5% Asian alone 52,805 0.4% Other race alone 9,785 0.08% American Indian alone 3,362 0.03% Native Hawaiian and Other
Income and house value in Medina Median household income in 2022 $75,346 White non-Hispanic householders$42,033 Black householders$23,120 Asian householders$58,527 Some other race householders$76,004 Two or more races householdersMedian 2022 house value $235,333 White Non-Hispanic householders$171,828 Black or African American householders $281,970 Asian householders$242,114 Some other race householders$239,137 Two or more races householders$212,676 Hispanic or Latino householders
Median age by race in Medina
42.4 Median age for White residents40.3 44.6 17.3 Median age for Black or African American residents23.2 12.9 -676,818,950.3 Median age for American Indian / Alaska Native residents-685,185,184.5 -658,163,264.6 42.6 Median age for Asian residents46.0 46.0 -666,666,666.0 Median age for Native Hawaiian / Pacific Islander residents-666,666,666.0 -666,666,666.0 63.9 Median age for Other race residents46.3 -543,927,648.0 28.4 Median age for Two or more races residents24.1 36.3 42.5 Median age for White alone residents40.5 44.6 37.2 Median age for Hispanic or Latino residents30.9 43.2
Owner/renter occupied households by race in Medina
House owners and renters - White residents 7,019 70.4% Owner occupied2,948 29.6% Renter occupiedHouse owners and renters - Black or African American residents 71 33.9% Owner occupied139 66.1% Renter occupiedHouse owners and renters - American Indian / Alaska Native residents 13 100.0% Renter occupiedHouse owners and renters - Asian residents 22 33.9% Owner occupied43 66.1% Renter occupiedHouse owners and renters - Other race residents 17 40.8% Owner occupied25 59.2% Renter occupiedHouse owners and renters - Two or more races residents 205 49.8% Owner occupied207 50.2% Renter occupiedHouse owners and renters - White alone residents 6,920 70.6% Owner occupied2,880 29.4% Renter occupiedHouse owners and renters - Hispanic or Latino residents 215 58.7% Owner occupied152 41.3% Renter occupied
Language usage in Medina
English speakers - Total 95.9% of residents of Medina speak English at home.
2.7% of residents speak Spanish at home 519 78.3% Speak English very well144 21.7% Speak English less than very well1.8% of residents speak other language at home 317 71.9% Speak English very well124 28.1% Speak English less than very well
English speakers - Born in the United States 95.6% of residents of Medina speak English at home.
3.2% of residents speak Spanish at home 175 100.0% Speak English very well2.0% of residents speak other language at home 101 93.5% Speak English very well7 6.5% Speak English less than very well
English speakers - Native, born elsewhere 52.6% of residents of Medina speak English at home.
5.8% of residents speak Spanish at home 10 100.0% Speak English very well
English speakers - Foreign-born 31.3% of residents of Medina speak English at home.
48.1% of residents speak Spanish at home 302 89.1% Speak English very well37 10.9% Speak English less than very well34.9% of residents speak other language at home 163 66.3% Speak English very well83 33.7% Speak English less than very well
White (Caucasian) - Speak only English Native:
98.3% (21,349)Foreign-born:
48.2% (193)
White (Caucasian) - Speak another language Native:
1.7% (378)Foreign-born:
46.8% (188)
Black or African American - Speak only English Native:
98.5% (819)Foreign-born:
10.5% (5)
Black or African American - Speak another language Native:
1.4% (11)Foreign-born:
87.8% (39)
Asian - Speak only English Native:
69.0% (59)Foreign-born:
4.7% (4)
Asian - Speak another language Native:
18.4% (16)Foreign-born:
100.0% (92)
Other race - Speak only English Native:
95.7% (88)Foreign-born:
25.3% (9)
Other race - Speak another language Native:
1.4% (1)Foreign-born:
69.6% (24)
Two or more races - Speak only English Native:
95.4% (1,065)Foreign-born:
4.8% (6)
Two or more races - Speak another language Native:
3.9% (44)Foreign-born:
97.6% (122)
White alone - Speak only English Native:
98.5% (21,084)Foreign-born:
57.8% (161)
White alone - Speak another language Native:
1.4% (309)Foreign-born:
41.6% (116)
Hispanic or Latino - Speak only English Native:
67.8% (486)Foreign-born:
20.0% (69)
Hispanic or Latino - Speak another language Native:
31.3% (225)Foreign-born:
73.6% (253)
Foreign-born residents in Medina 604 residents are foreign born (0.8% Latin America , 0.7% Europe , 0.3% Asia , 0.3% Africa , 0.2% North America ).
Marital status for residents in Medina Marital status - White (Caucasian) population 15 years and over
Males 29.1% Never married57.3% Now married0.0% Separated3.5% Widowed10.0% DivorcedFemales 21.5% Never married50.6% Now married2.1% Separated9.7% Widowed16.1% DivorcedWomen who gave birth in the past 12 months Now married:
78.0% (154)Unmarried:
22.0% (43)
Women who did not give birth in the past 12 months Now married:
48.3% (2,396)Unmarried:
51.7% (2,566)
Marital status - Black or African American population 15 years and over
Males 44.8% Never married42.2% Now married0.0% Separated0.0% Widowed13.0% DivorcedFemales 77.1% Never married19.0% Now married0.0% Separated3.8% Widowed0.0% DivorcedWomen who did not give birth in the past 12 months Now married:
22.4% (54)Unmarried:
77.6% (185)
Marital status - Asian population 15 years and over
Males 45.9% Never married54.1% Now married0.0% Separated0.0% Widowed0.0% DivorcedFemales 0.0% Never married59.6% Now married0.0% Separated38.5% Widowed1.9% DivorcedWomen who did not give birth in the past 12 months Now married:
0.0% (0)Unmarried:
100.0% (20)
Marital status - Other race population 15 years and over
Males 50.0% Never married19.0% Now married0.0% Separated0.0% Widowed31.0% DivorcedFemales 15.0% Never married85.0% Now married0.0% Separated0.0% Widowed0.0% DivorcedWomen who did not give birth in the past 12 months Now married:
0.0% (0)Unmarried:
100.0% (12)
Marital status - Two or more races population 15 years and over
Males 43.8% Never married32.0% Now married0.0% Separated7.6% Widowed16.7% DivorcedFemales 43.4% Never married36.8% Now married0.0% Separated4.4% Widowed15.4% DivorcedWomen who gave birth in the past 12 months Now married:
100.0% (69)Unmarried:
0.0% (0)
Women who did not give birth in the past 12 months Now married:
22.5% (33)Unmarried:
77.5% (115)
Marital status - White alone, not Hispanic / Latino population 15 years and over
Males 29.3% Never married57.2% Now married0.0% Separated3.6% Widowed9.9% DivorcedFemales 21.4% Never married50.8% Now married1.6% Separated9.8% Widowed16.4% DivorcedWomen who gave birth in the past 12 months Now married:
78.0% (156)Unmarried:
22.0% (44)
Women who did not give birth in the past 12 months Now married:
47.9% (2,321)Unmarried:
52.1% (2,524)
Marital status - Hispanic or Latino population 15 years and over
Males 36.6% Never married44.4% Now married0.0% Separated0.0% Widowed19.0% DivorcedFemales 24.9% Never married53.3% Now married14.5% Separated5.0% Widowed2.4% DivorcedWomen who gave birth in the past 12 months Now married:
100.0% (29)Unmarried:
0.0% (0)
Women who did not give birth in the past 12 months Now married:
56.0% (113)Unmarried:
44.0% (89)
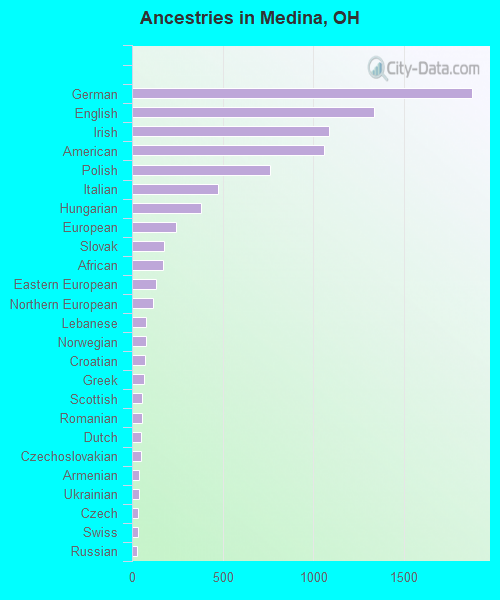
Ancestries in Medina
1,876 17.9% German1,336 12.7% English1,086 10.4% Irish1,060 10.1% American763 7.3% Polish475 4.5% Italian378 3.6% Hungarian241 2.3% European178 1.7% Slovak169 1.6% African131 1.2% Eastern European116 1.1% Northern European80 0.8% Lebanese79 0.8% Norwegian70 0.7% Croatian68 0.6% Greek56 0.5% Scottish53 0.5% Romanian51 0.5% Dutch49 0.5% Czechoslovakian40 0.4% Armenian40 0.4% Ukrainian35 0.3% Czech34 0.3% Swiss30 0.3% Russian29 0.3% British29 0.3% Scotch-Irish29 0.3% Celtic26 0.2% Canadian25 0.2% Pennsylvania German20 0.2% Slavic19 0.2% French Canadian19 0.2% Serbian14 0.1% Welsh12 0.1% Scandinavian10 0.10% Finnish10 0.10% Swedish9 0.09% Portuguese6 0.06% French6 0.06% Slovene5 0.05% Lithuanian3 0.03% Ethiopian1 0.01% Arab
Children Nativity (place of birth) in Medina
Children under 6 years - Living with two parents Both parents native 1,236 100.0% NativeBoth parents foreign-born 84 100.0% NativeOne native, one foreign-born parent 52 100.0% NativeChildren under 6 years - Living with one parent Native parent 266 100.0% NativeForeign-born parent 20 100.0% NativeChildren 6 to 17 years - Living with two parents Both parents native 2,287 99.0% Native23 1.0% Foreign-bornBoth parents foreign-born 63 100.0% NativeOne native, one foreign-born parent 19 100.0% NativeChildren 6 to 17 years - Living with one parent Native parent 1,620 100.0% NativeForeign-born parent 59 50.4% Native58 49.6% Foreign-born
Grandparents responsible for own grandchildren in Medina
Grandparents (30 to 59 years) White / Caucasian 52 81.5% Responsible for grandchildren12 18.5% Not responsible for grandchildrenWhite alone, not Hispanic / Latino 52 81.5% Responsible for grandchildren12 18.5% Not responsible for grandchildrenGrandparents (60 years and over) White / Caucasian 16 21.0% Responsible for grandchildren62 79.0% Not responsible for grandchildrenWhite alone, not Hispanic / Latino 17 21.1% Responsible for grandchildren62 78.9% Not responsible for grandchildren