Races in Mercedes, Texas (TX) Detailed Stats
Data:
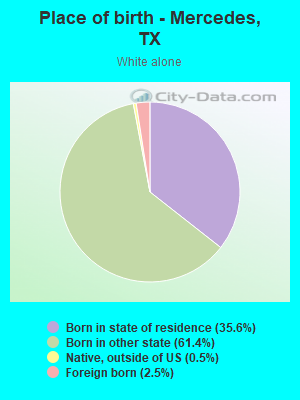
Races - White alone (%)
Races - White alone (% change since 2000)
Races - Black alone (%)
Races - Black alone (% change since 2000)
Races - American Indian alone (%)
Races - American Indian alone (% change since 2000)
Races - Asian alone (%)
Races - Asian alone (% change since 2000)
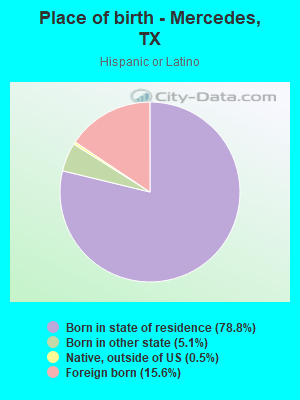
Races - Hispanic (%)
Races - Hispanic (% change since 2000)
Races - Native Hawaiian and Other Pacific Islander alone (%)
Races - Native Hawaiian and Other Pacific Islander alone (% change since 2000)
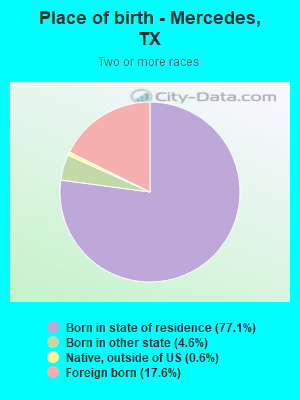
Races - Two or more races(%)
Races - Two or more races(% change since 2000)
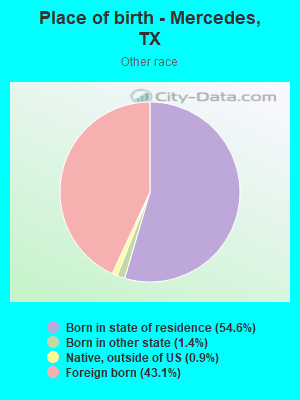
Races - Other race alone (%)
Races - Other race alone (% change since 2000)
Racial diversity
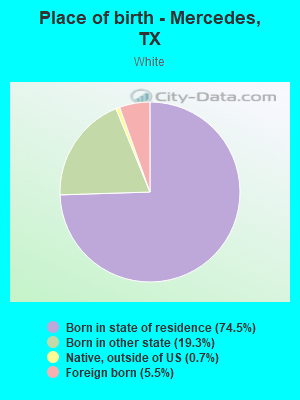
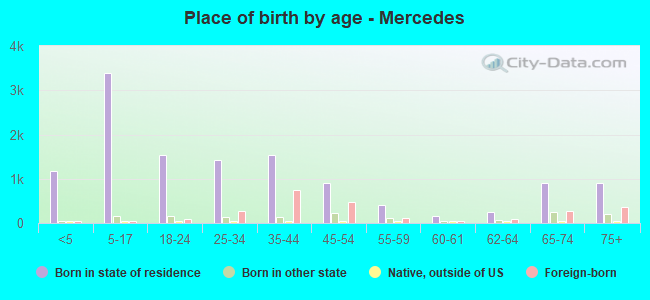
Place of birth - Born in state of residence (%)
Place of birth - Born in state of residence (%) - White
Place of birth - Born in state of residence (%) - Black or African American
Place of birth - Born in state of residence (%) - Asian
Place of birth - Born in state of residence (%) - Hispanic or Latino
Place of birth - Born in state of residence (%) - American Indian and Alaska Native
Place of birth - Born in state of residence (%) - Multirace
Place of birth - Born in state of residence (%) - Other Race
Place of birth - Born in other state (%)
Place of birth - Born in other state (%) - White
Place of birth - Born in other state (%) - Black or African American
Place of birth - Born in other state (%) - Asian
Place of birth - Born in other state (%) - Hispanic or Latino
Place of birth - Born in other state (%) - American Indian and Alaska Native
Place of birth - Born in other state (%) - Multirace
Place of birth - Born in other state (%) - Other Race
Place of birth - Native, outside of US (%)
Place of birth - Native, outside of US (%) - White
Place of birth - Native, outside of US (%) - Black or African American
Place of birth - Native, outside of US (%) - Asian
Place of birth - Native, outside of US (%) - Hispanic or Latino
Place of birth - Native, outside of US (%) - American Indian and Alaska Native
Place of birth - Native, outside of US (%) - Multirace
Place of birth - Native, outside of US (%) - Other Race
Place of birth - Foreign born (%)
Place of birth - Foreign born (%) - White
Place of birth - Foreign born (%) - Black or African American
Place of birth - Foreign born (%) - Asian
Place of birth - Foreign born (%) - Hispanic or Latino
Place of birth - Foreign born (%) - American Indian and Alaska Native
Place of birth - Foreign born (%) - Multirace
Place of birth - Foreign born (%) - Other Race
Residents speaking English at home (%)
Residents speaking English at home - Born in the United States (%)
Residents speaking English at home - Native, born elsewhere (%)
Residents speaking English at home - Foreign born (%)
Residents speaking Spanish at home (%)
Residents speaking Spanish at home - Born in the United States (%)
Residents speaking Spanish at home - Native, born elsewhere (%)
Residents speaking Spanish at home - Foreign born (%)
Residents speaking other language at home (%)
Residents speaking other language at home - Born in the United States (%)
Residents speaking other language at home - Native, born elsewhere (%)
Residents speaking other language at home - Foreign born (%)
Marital status - Never married (%)
Marital status - Now married (%)
Marital status - Separated (%)
Marital status - Widowed (%)
Marital status - Divorced (%)
Ancestries Reported - Arab (%)
Ancestries Reported - Czech (%)
Ancestries Reported - Danish (%)
Ancestries Reported - Dutch (%)
Ancestries Reported - English (%)
Ancestries Reported - French (%)
Ancestries Reported - French Canadian (%)
Ancestries Reported - German (%)
Ancestries Reported - Greek (%)
Ancestries Reported - Hungarian (%)
Ancestries Reported - Irish (%)
Ancestries Reported - Italian (%)
Ancestries Reported - Lithuanian (%)
Ancestries Reported - Norwegian (%)
Ancestries Reported - Polish (%)
Ancestries Reported - Portuguese (%)
Ancestries Reported - Russian (%)
Ancestries Reported - Scotch-Irish (%)
Ancestries Reported - Scottish (%)
Ancestries Reported - Slovak (%)
Ancestries Reported - Subsaharan African (%)
Ancestries Reported - Swedish (%)
Ancestries Reported - Swiss (%)
Ancestries Reported - Ukrainian (%)
Ancestries Reported - United States (%)
Ancestries Reported - Welsh (%)
Ancestries Reported - West Indian (%)
Ancestries Reported - Other (%)
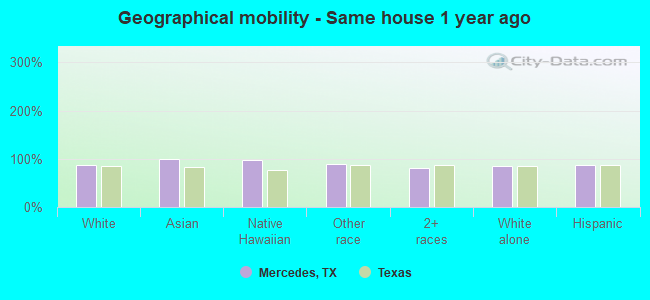
Geographical mobility - Same house 1 year ago (%)
Geographical mobility - Same house 1 year ago (%) - White
Geographical mobility - Same house 1 year ago (%) - Black or African American
Geographical mobility - Same house 1 year ago (%) - Asian
Geographical mobility - Same house 1 year ago (%) - Hispanic or Latino
Geographical mobility - Same house 1 year ago (%) - American Indian and Alaska Native
Geographical mobility - Same house 1 year ago (%) - Multirace
Geographical mobility - Same house 1 year ago (%) - Other Race
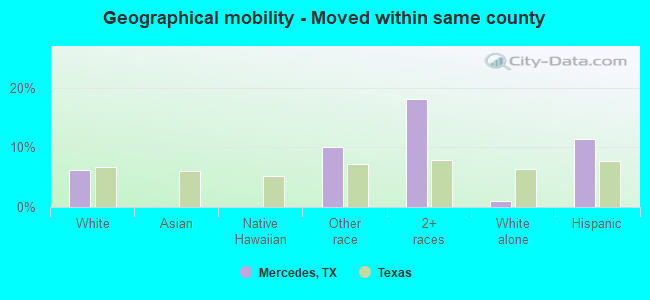
Geographical mobility - Moved within same county (%)
Geographical mobility - Moved within same county (%) - White
Geographical mobility - Moved within same county (%) - Black or African American
Geographical mobility - Moved within same county (%) - Asian
Geographical mobility - Moved within same county (%) - Hispanic or Latino
Geographical mobility - Moved within same county (%) - American Indian and Alaska Native
Geographical mobility - Moved within same county (%) - Multirace
Geographical mobility - Moved within same county (%) - Other Race
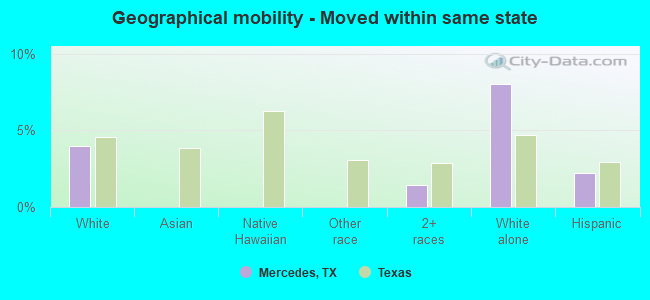
Geographical mobility - Moved from different county within same state (%)
Geographical mobility - Moved from different county within same state (%) - White
Geographical mobility - Moved from different county within same state (%) - Black or African American
Geographical mobility - Moved from different county within same state (%) - Asian
Geographical mobility - Moved from different county within same state (%) - Hispanic or Latino
Geographical mobility - Moved from different county within same state (%) - American Indian and Alaska Native
Geographical mobility - Moved from different county within same state (%) - Multirace
Geographical mobility - Moved from different county within same state (%) - Other Race
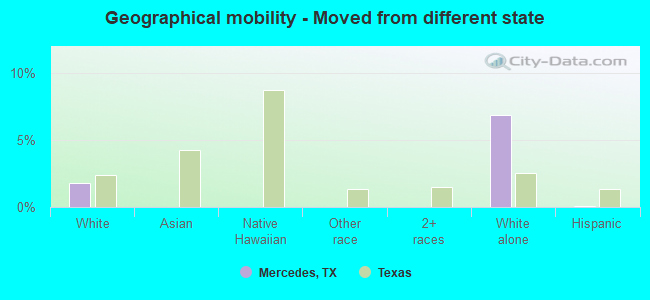
Geographical mobility - Moved from different state (%)
Geographical mobility - Moved from different state (%) - White
Geographical mobility - Moved from different state (%) - Black or African American
Geographical mobility - Moved from different state (%) - Asian
Geographical mobility - Moved from different state (%) - Hispanic or Latino
Geographical mobility - Moved from different state (%) - American Indian and Alaska Native
Geographical mobility - Moved from different state (%) - Multirace
Geographical mobility - Moved from different state (%) - Other Race
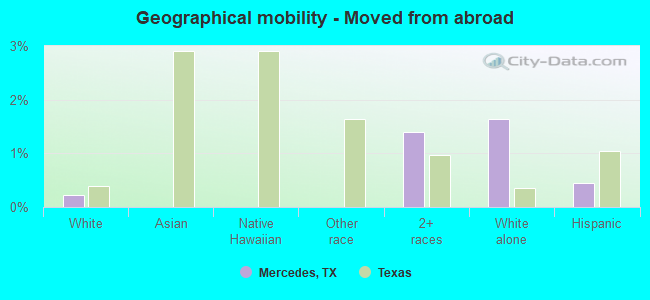
Geographical mobility - Moved from abroad (%)
Geographical mobility - Moved from abroad (%) - White
Geographical mobility - Moved from abroad (%) - Black or African American
Geographical mobility - Moved from abroad (%) - Asian
Geographical mobility - Moved from abroad (%) - Hispanic or Latino
Geographical mobility - Moved from abroad (%) - American Indian and Alaska Native
Geographical mobility - Moved from abroad (%) - Multirace
Geographical mobility - Moved from abroad (%) - Other Race
Place of birth for the foreign-born population - Ireland (%)
Place of birth for the foreign-born population - Denmark (%)
Place of birth for the foreign-born population - Norway (%)
Place of birth for the foreign-born population - Sweden (%)
Place of birth for the foreign-born population - United Kingdom (%)
Place of birth for the foreign-born population - England (%)
Place of birth for the foreign-born population - Scotland (%)
Place of birth for the foreign-born population - Other Northern Europe (%)
Place of birth for the foreign-born population - Austria (%)
Place of birth for the foreign-born population - Belgium (%)
Place of birth for the foreign-born population - France (%)
Place of birth for the foreign-born population - Germany (%)
Place of birth for the foreign-born population - Netherlands (%)
Place of birth for the foreign-born population - Switzerland (%)
Place of birth for the foreign-born population - Other Western Europe (%)
Place of birth for the foreign-born population - Greece (%)
Place of birth for the foreign-born population - Italy (%)
Place of birth for the foreign-born population - Portugal (%)
Place of birth for the foreign-born population - Spain (%)
Place of birth for the foreign-born population - Other Southern Europe (%)
Place of birth for the foreign-born population - Albania (%)
Place of birth for the foreign-born population - Belarus (%)
Place of birth for the foreign-born population - Bosnia and Herzegovina (%)
Place of birth for the foreign-born population - Bulgaria (%)
Place of birth for the foreign-born population - Croatia (%)
Place of birth for the foreign-born population - Czechoslovakia (%)
Place of birth for the foreign-born population - Hungary (%)
Place of birth for the foreign-born population - Latvia (%)
Place of birth for the foreign-born population - Lithuania (%)
Place of birth for the foreign-born population - North Macedonia (Macedonia) (%)
Place of birth for the foreign-born population - Moldova (%)
Place of birth for the foreign-born population - Poland (%)
Place of birth for the foreign-born population - Romania (%)
Place of birth for the foreign-born population - Russia (%)
Place of birth for the foreign-born population - Serbia (%)
Place of birth for the foreign-born population - Ukraine (%)
Place of birth for the foreign-born population - Other Eastern Europe (%)
Place of birth for the foreign-born population - China (%)
Place of birth for the foreign-born population - Hong Kong (%)
Place of birth for the foreign-born population - Taiwan (%)
Place of birth for the foreign-born population - Japan (%)
Place of birth for the foreign-born population - Korea (%)
Place of birth for the foreign-born population - Other Eastern Asia (%)
Place of birth for the foreign-born population - Afghanistan (%)
Place of birth for the foreign-born population - Bangladesh (%)
Place of birth for the foreign-born population - India (%)
Place of birth for the foreign-born population - Iran (%)
Place of birth for the foreign-born population - Kazakhstan (%)
Place of birth for the foreign-born population - Nepal (%)
Place of birth for the foreign-born population - Pakistan (%)
Place of birth for the foreign-born population - Sri Lanka (%)
Place of birth for the foreign-born population - Uzbekistan (%)
Place of birth for the foreign-born population - Other South Central Asia (%)
Place of birth for the foreign-born population - Burma (%)
Place of birth for the foreign-born population - Cambodia (%)
Place of birth for the foreign-born population - Indonesia (%)
Place of birth for the foreign-born population - Laos (%)
Place of birth for the foreign-born population - Malaysia (%)
Place of birth for the foreign-born population - Philippines (%)
Place of birth for the foreign-born population - Singapore (%)
Place of birth for the foreign-born population - Thailand (%)
Place of birth for the foreign-born population - Vietnam (%)
Place of birth for the foreign-born population - Other South Eastern Asia (%)
Place of birth for the foreign-born population - Armenia (%)
Place of birth for the foreign-born population - Iraq (%)
Place of birth for the foreign-born population - Israel (%)
Place of birth for the foreign-born population - Jordan (%)
Place of birth for the foreign-born population - Kuwait (%)
Place of birth for the foreign-born population - Lebanon (%)
Place of birth for the foreign-born population - Saudi Arabia (%)
Place of birth for the foreign-born population - Syria (%)
Place of birth for the foreign-born population - Turkey (%)
Place of birth for the foreign-born population - Yemen (%)
Place of birth for the foreign-born population - Other Western Asia (%)
Place of birth for the foreign-born population - Eritrea (%)
Place of birth for the foreign-born population - Ethiopia (%)
Place of birth for the foreign-born population - Kenya (%)
Place of birth for the foreign-born population - Somalia (%)
Place of birth for the foreign-born population - Uganda (%)
Place of birth for the foreign-born population - Zimbabwe (%)
Place of birth for the foreign-born population - Other Eastern Africa (%)
Place of birth for the foreign-born population - Cameroon (%)
Place of birth for the foreign-born population - Congo (%)
Place of birth for the foreign-born population - Democratic Republic of Congo (Zaire) (%)
Place of birth for the foreign-born population - Other Middle Africa (%)
Place of birth for the foreign-born population - Egypt (%)
Place of birth for the foreign-born population - Morocco (%)
Place of birth for the foreign-born population - Sudan (%)
Place of birth for the foreign-born population - Other Northern Africa (%)
Place of birth for the foreign-born population - South Africa (%)
Place of birth for the foreign-born population - Other Southern Africa (%)
Place of birth for the foreign-born population - Cabo Verde (%)
Place of birth for the foreign-born population - Ghana (%)
Place of birth for the foreign-born population - Liberia (%)
Place of birth for the foreign-born population - Nigeria (%)
Place of birth for the foreign-born population - Senegal (%)
Place of birth for the foreign-born population - Sierra Leone (%)
Place of birth for the foreign-born population - Other Western Africa (%)
Place of birth for the foreign-born population - Australia (%)
Place of birth for the foreign-born population - New Zealand (%)
Place of birth for the foreign-born population - Fiji (%)
Place of birth for the foreign-born population - Micronesia (%)
Place of birth for the foreign-born population - Bahamas (%)
Place of birth for the foreign-born population - Barbados (%)
Place of birth for the foreign-born population - Cuba (%)
Place of birth for the foreign-born population - Dominica (%)
Place of birth for the foreign-born population - Dominican Republic (%)
Place of birth for the foreign-born population - Grenada (%)
Place of birth for the foreign-born population - Haiti (%)
Place of birth for the foreign-born population - Jamaica (%)
Place of birth for the foreign-born population - St. Vincent and the Grenadines (%)
Place of birth for the foreign-born population - Trinidad and Tobago (%)
Place of birth for the foreign-born population - West Indies (%)
Place of birth for the foreign-born population - Other Caribbean (%)
Place of birth for the foreign-born population - Belize (%)
Place of birth for the foreign-born population - Costa Rica (%)
Place of birth for the foreign-born population - El Salvador (%)
Place of birth for the foreign-born population - Guatemala (%)
Place of birth for the foreign-born population - Honduras (%)
Place of birth for the foreign-born population - Mexico (%)
Place of birth for the foreign-born population - Nicaragua (%)
Place of birth for the foreign-born population - Panama (%)
Place of birth for the foreign-born population - Other Central America (%)
Place of birth for the foreign-born population - Argentina (%)
Place of birth for the foreign-born population - Bolivia (%)
Place of birth for the foreign-born population - Brazil (%)
Place of birth for the foreign-born population - Chile (%)
Place of birth for the foreign-born population - Colombia (%)
Place of birth for the foreign-born population - Ecuador (%)
Place of birth for the foreign-born population - Guyana (%)
Place of birth for the foreign-born population - Peru (%)
Place of birth for the foreign-born population - Uruguay (%)
Place of birth for the foreign-born population - Venezuela (%)
Place of birth for the foreign-born population - Other South America (%)
Place of birth for the foreign-born population - Canada (%)
Place of birth for the foreign-born population - Other Northern America (%)
Place of birth for the foreign-born population - Other (%)
Latest news about races in Mercedes, TX collected exclusively by city-data.com from local newspapers, TV, and radio stations
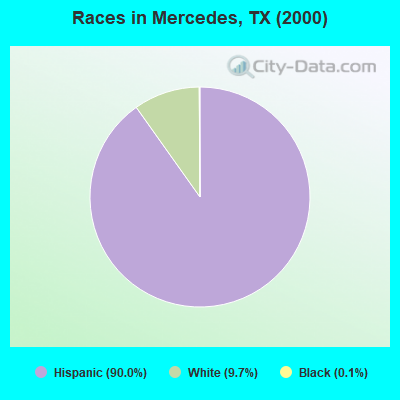
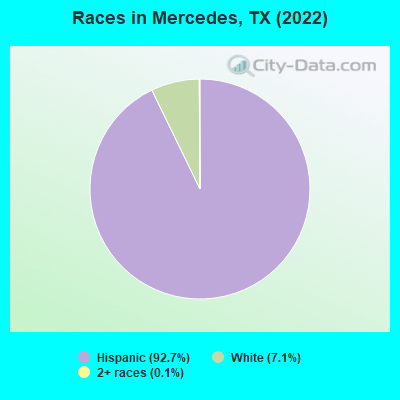
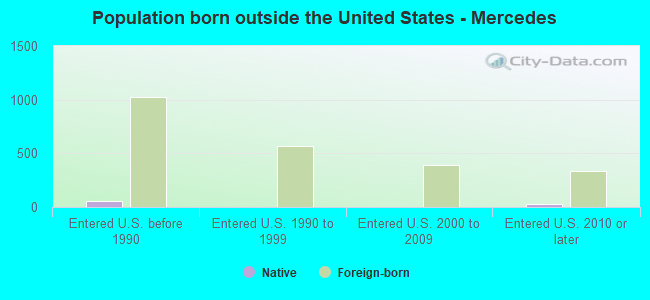
According to 2022 data, the most numerous races in Mercedes, TX are Hispanic (15,425 residents), White alone (1,184 residents), and Black alone (0 residents). 22.1% of Mercedes residents speak English at home. 14.9% of Mercedes, TX residents are foreign-born (14.4% born in Latin America), which is 14.4% less than the foreign-born rate of 17.0% across the entire state of Texas.
Race distribution in Mercedes
2000 2022
10,933,313 52.4% White alone 6,669,666 32.0% Hispanic 2,364,255 11.3% Black alone 554,445 2.7% Asian alone 230,567 1.1% Two or more races 68,859 0.3% American Indian alone 19,958 0.10% Other race alone 10,757 0.05% Native Hawaiian and Other
12,070,642 40.2% Hispanic 11,683,430 38.9% White alone 3,508,706 11.7% Black alone 1,608,173 5.4% Asian alone 956,560 3.2% Two or more races 125,763 0.4% Other race alone 47,023 0.2% American Indian alone 29,275 0.10% Native Hawaiian and Other
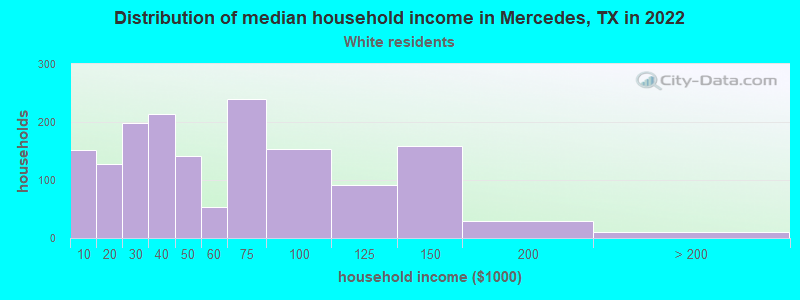
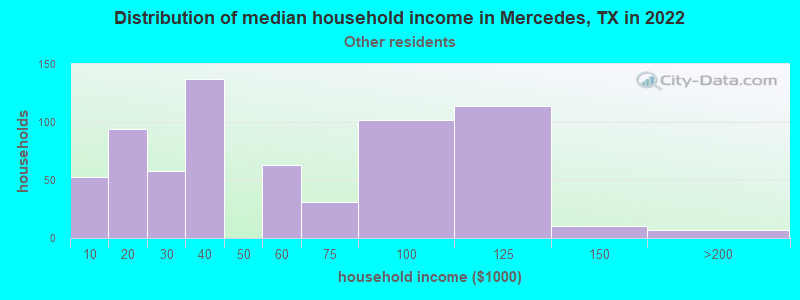
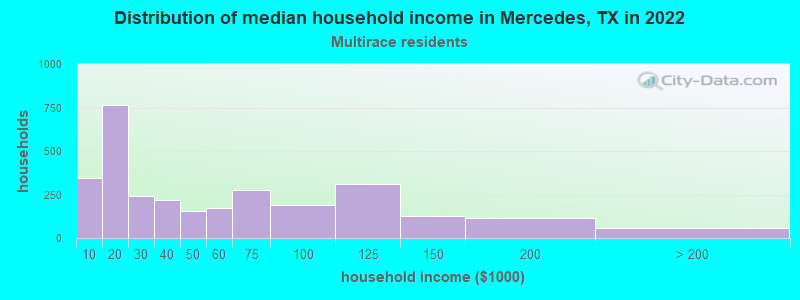
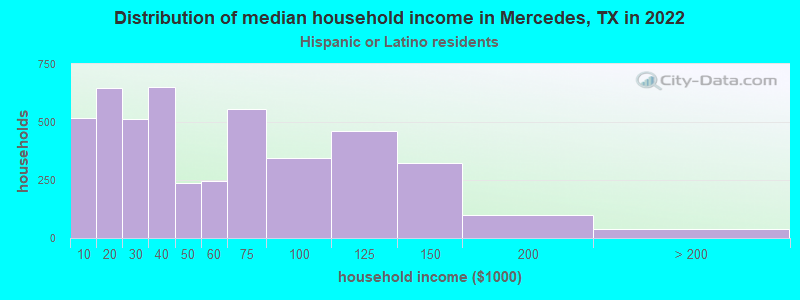
Income and house value in Mercedes Median household income in 2022 $50,350 White non-Hispanic householders$38,041 Some other race householders$38,204 Two or more races householders$41,474 Hispanic or Latino race householdersMedian 2022 house value $205,303 White Non-Hispanic householders$82,181 Black or African American householders$124,915 American Indian or Alaska Native householders$106,686 Some other race householders$86,365 Two or more races householders$112,065 Hispanic or Latino householders
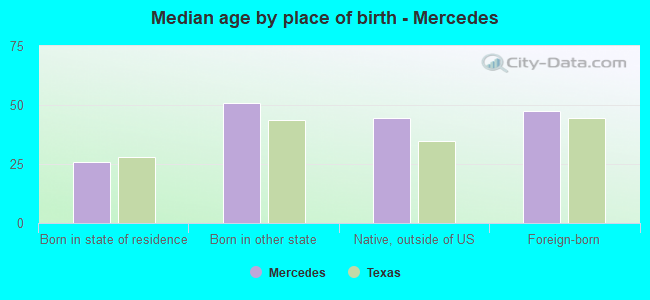
Median age by race in Mercedes
34.5 Median age for White residents33.0 38.6 -636,150,234.1 Median age for Black or African American residents-682,648,401.1 -489,388,264.2 -560,747,663.0 Median age for American Indian / Alaska Native residents-575,645,755.9 -627,650,550.7 -666,666,666.0 Median age for Asian residents-602,763,384.5 -710,659,897.8 -581,560,283.1 Median age for Native Hawaiian / Pacific Islander residents-612,729,233.5 -577,777,777.2 37.6 Median age for Other race residents36.3 36.6 33.9 Median age for Two or more races residents29.4 37.2 63.1 Median age for White alone residents62.7 64.0 33.2 Median age for Hispanic or Latino residents29.6 36.4
Owner/renter occupied households by race in Mercedes
House owners and renters - White residents 1,034 72.6% Owner occupied390 27.4% Renter occupiedHouse owners and renters - Asian residents 7 100.0% Renter occupiedHouse owners and renters - Native Hawaiian / Pacific Islander residents 4 100.0% Renter occupiedHouse owners and renters - Other race residents 380 60.6% Owner occupied247 39.4% Renter occupiedHouse owners and renters - Two or more races residents 1,915 63.0% Owner occupied1,126 37.0% Renter occupiedHouse owners and renters - White alone residents 483 86.5% Owner occupied75 13.5% Renter occupiedHouse owners and renters - Hispanic or Latino residents 3,067 65.3% Owner occupied1,630 34.7% Renter occupied
Language usage in Mercedes
English speakers - Total 22.1% of residents of Mercedes speak English at home.
77.6% of residents speak Spanish at home 7,899 65.9% Speak English very well4,088 34.1% Speak English less than very well0.4% of residents speak other language at home 59 100.0% Speak English very well
English speakers - Born in the United States 46.9% of residents of Mercedes speak English at home.
47.8% of residents speak Spanish at home 588 81.0% Speak English very well138 19.0% Speak English less than very well2.0% of residents speak other language at home 30 100.0% Speak English very well
English speakers - Native, born elsewhere 5.4% of residents of Mercedes speak English at home.
100.0% of residents speak Spanish at home 15 26.8% Speak English very well41 73.2% Speak English less than very well
English speakers - Foreign-born 5.7% of residents of Mercedes speak English at home.
94.1% of residents speak Spanish at home 665 28.9% Speak English very well1,640 71.1% Speak English less than very well
White (Caucasian) - Speak only English Native:
35.8% (1,551)Foreign-born:
15.9% (43)
White (Caucasian) - Speak another language Native:
61.6% (2,666)Foreign-born:
75.9% (207)
Other race - Speak only English Native:
29.4% (269)Foreign-born:
1.6% (11)
Other race - Speak another language Native:
73.6% (673)Foreign-born:
98.1% (701)
Two or more races - Speak only English Native:
23.5% (1,667)Foreign-born:
3.7% (61)
Two or more races - Speak another language Native:
75.3% (5,351)Foreign-born:
96.3% (1,585)
White alone - Speak only English Native:
74.7% (839)Foreign-born:
56.9% (16)
Hispanic or Latino - Speak only English Native:
20.0% (2,364)Foreign-born:
4.5% (110)
Hispanic or Latino - Speak another language Native:
80.0% (9,469)Foreign-born:
95.4% (2,305)
Foreign-born residents in Mercedes 2,474 residents are foreign born (14.4% Latin America ).
This city:
14.9%Texas:
17.1%
Marital status for residents in Mercedes Marital status - White (Caucasian) population 15 years and over
Males 39.7% Never married49.4% Now married3.2% Separated2.6% Widowed5.2% DivorcedFemales 24.5% Never married45.0% Now married9.2% Separated10.3% Widowed11.0% DivorcedWomen who gave birth in the past 12 months Now married:
47.0% (34)Unmarried:
53.0% (39)
Women who did not give birth in the past 12 months Now married:
51.9% (338)Unmarried:
48.1% (314)
Marital status - Other race population 15 years and over
Males 31.4% Never married56.6% Now married2.3% Separated0.0% Widowed9.7% DivorcedFemales 28.8% Never married60.5% Now married2.4% Separated7.0% Widowed1.3% DivorcedWomen who gave birth in the past 12 months Now married:
19.4% (11)Unmarried:
80.6% (44)
Women who did not give birth in the past 12 months Now married:
67.1% (304)Unmarried:
32.9% (149)
Marital status - Two or more races population 15 years and over
Males 41.2% Never married47.3% Now married4.7% Separated4.8% Widowed2.0% DivorcedFemales 39.7% Never married27.9% Now married7.9% Separated12.2% Widowed12.4% DivorcedWomen who gave birth in the past 12 months Now married:
0.0% (0)Unmarried:
100.0% (62)
Women who did not give birth in the past 12 months Now married:
35.5% (975)Unmarried:
64.5% (1,772)
Marital status - White alone, not Hispanic / Latino population 15 years and over
Males 18.8% Never married66.9% Now married0.0% Separated7.5% Widowed6.7% DivorcedFemales 9.0% Never married66.3% Now married2.5% Separated8.6% Widowed13.6% DivorcedWomen who gave birth in the past 12 months Now married:
100.0% (17)Unmarried:
0.0% (0)
Women who did not give birth in the past 12 months Now married:
24.1% (22)Unmarried:
75.9% (70)
Marital status - Hispanic or Latino population 15 years and over
Males 40.5% Never married48.5% Now married3.8% Separated2.4% Widowed4.8% DivorcedFemales 32.7% Never married38.3% Now married8.3% Separated10.7% Widowed9.9% DivorcedWomen who gave birth in the past 12 months Now married:
30.1% (75)Unmarried:
69.9% (175)
Women who did not give birth in the past 12 months Now married:
47.6% (1,658)Unmarried:
52.4% (1,822)
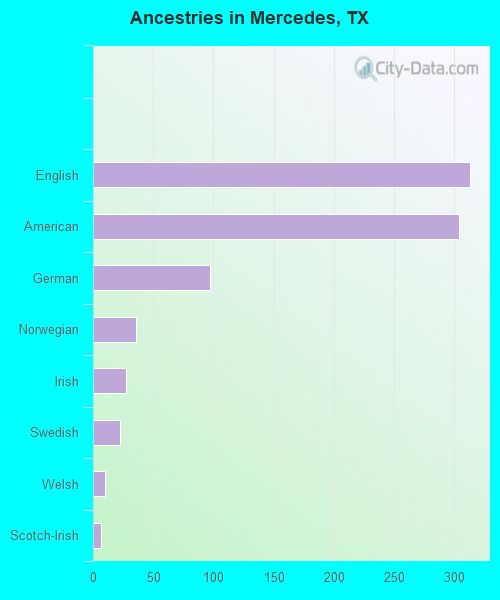
Ancestries in Mercedes
313 2.5% English304 2.5% American97 0.8% German36 0.3% Norwegian27 0.2% Irish22 0.2% Swedish10 0.08% Welsh7 0.06% Scotch-Irish
Geographical mobility in Mercedes Same house 1 year ago 3,708 87.7% White (Caucasian)6 99.3% Asian4 98.2% Native Hawaiian / Pacific Islander1,486 88.9% Other race7,615 81.5% Two or more races1,000 85.4% White alone, not Hispanic / Latino13,060 86.7% Hispanic or LatinoMoved within same county 265 6.3% White / Caucasian169 10.1% Other race1,699 18.2% Two or more races12 1.0% White alone, not Hispanic / Latino1,710 11.3% Hispanic or LatinoMoved within same state 167 4.0% White / Caucasian137 1.5% Two or more races94 8.0% White alone, not Hispanic / Latino334 2.2% Hispanic or LatinoMoved from different state 74 1.8% White / Caucasian80 6.9% White alone, not Hispanic / Latino16 0.1% Hispanic or LatinoMoved from abroad 9 0.2% White130 1.4% Two or more races19 1.6% White alone, not Hispanic / Latino67 0.4% Hispanic or Latino
Children Nativity (place of birth) in Mercedes
Children under 6 years - Living with two parents Both parents native 115 100.0% NativeBoth parents foreign-born 39 100.0% NativeOne native, one foreign-born parent 126 100.0% NativeChildren under 6 years - Living with one parent Native parent 860 100.0% NativeForeign-born parent 381 100.0% NativeChildren 6 to 17 years - Living with two parents Both parents native 940 100.0% NativeBoth parents foreign-born 419 100.0% NativeOne native, one foreign-born parent 143 100.0% NativeChildren 6 to 17 years - Living with one parent Native parent 1,142 100.0% NativeForeign-born parent 690 50.8% Native669 49.2% Foreign-born
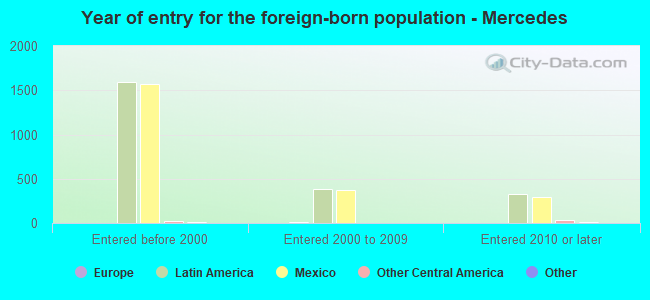
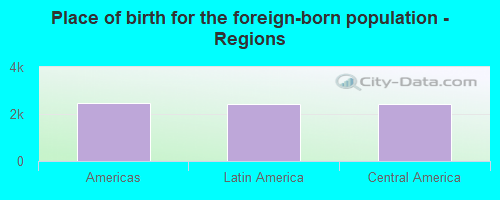
Place of birth for residents in Mercedes 2,459 Americas2,443 Latin America2,443 Central America15 Europe15 Northern Europe15 Northern America
Grandparents responsible for own grandchildren in Mercedes
Grandparents (30 to 59 years) White / Caucasian 22 37.0% Responsible for grandchildren37 63.0% Not responsible for grandchildrenOther race 41 77.4% Responsible for grandchildren12 22.6% Not responsible for grandchildrenTwo or more races 101 71.3% Responsible for grandchildren41 28.7% Not responsible for grandchildrenWhite alone, not Hispanic / Latino 14 100.0% Not responsible for grandchildrenHispanic or Latino 173 66.3% Responsible for grandchildren88 33.7% Not responsible for grandchildrenGrandparents (60 years and over) White / Caucasian 60 23.6% Responsible for grandchildren195 76.4% Not responsible for grandchildrenOther race 25 100.0% Responsible for grandchildrenTwo or more races 113 66.1% Responsible for grandchildren58 33.9% Not responsible for grandchildrenWhite alone, not Hispanic / Latino 16 100.0% Responsible for grandchildrenHispanic or Latino 180 38.2% Responsible for grandchildren291 61.8% Not responsible for grandchildren