Races in Meridian, Mississippi (MS) Detailed Stats
Data:
Races - White alone (%)
Races - White alone (% change since 2000)
Races - Black alone (%)
Races - Black alone (% change since 2000)
Races - American Indian alone (%)
Races - American Indian alone (% change since 2000)
Races - Asian alone (%)
Races - Asian alone (% change since 2000)
Races - Hispanic (%)
Races - Hispanic (% change since 2000)
Races - Native Hawaiian and Other Pacific Islander alone (%)
Races - Native Hawaiian and Other Pacific Islander alone (% change since 2000)
Races - Two or more races(%)
Races - Two or more races(% change since 2000)
Races - Other race alone (%)
Races - Other race alone (% change since 2000)
Racial diversity
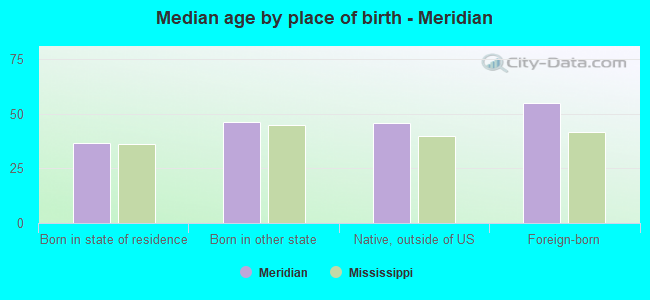
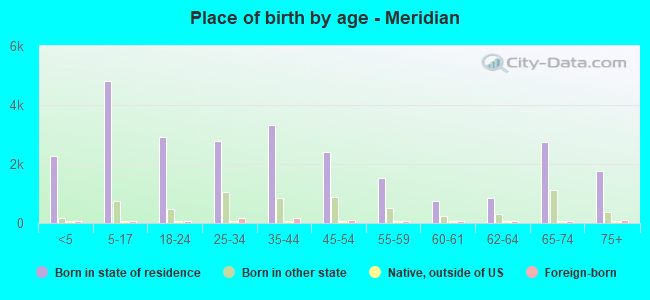
Place of birth - Born in state of residence (%)
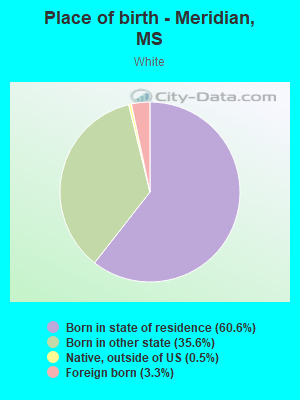
Place of birth - Born in state of residence (%) - White
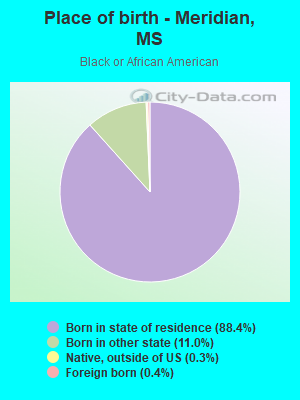
Place of birth - Born in state of residence (%) - Black or African American
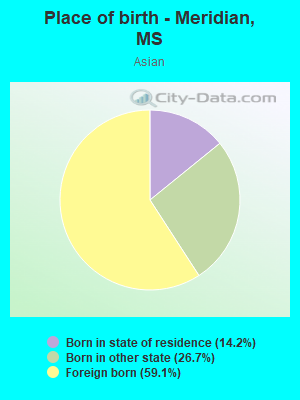
Place of birth - Born in state of residence (%) - Asian
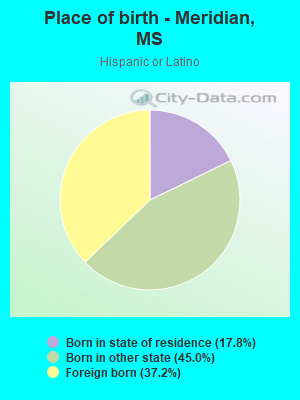
Place of birth - Born in state of residence (%) - Hispanic or Latino
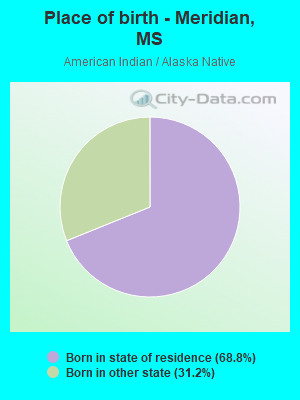
Place of birth - Born in state of residence (%) - American Indian and Alaska Native
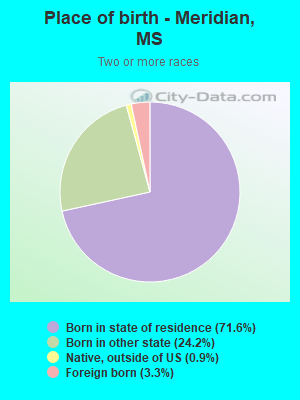
Place of birth - Born in state of residence (%) - Multirace
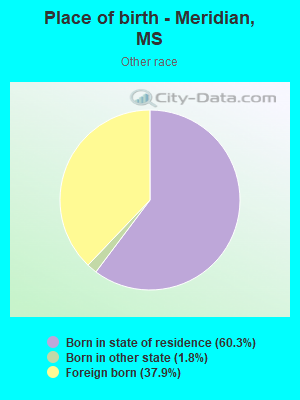
Place of birth - Born in state of residence (%) - Other Race
Place of birth - Born in other state (%)
Place of birth - Born in other state (%) - White
Place of birth - Born in other state (%) - Black or African American
Place of birth - Born in other state (%) - Asian
Place of birth - Born in other state (%) - Hispanic or Latino
Place of birth - Born in other state (%) - American Indian and Alaska Native
Place of birth - Born in other state (%) - Multirace
Place of birth - Born in other state (%) - Other Race
Place of birth - Native, outside of US (%)
Place of birth - Native, outside of US (%) - White
Place of birth - Native, outside of US (%) - Black or African American
Place of birth - Native, outside of US (%) - Asian
Place of birth - Native, outside of US (%) - Hispanic or Latino
Place of birth - Native, outside of US (%) - American Indian and Alaska Native
Place of birth - Native, outside of US (%) - Multirace
Place of birth - Native, outside of US (%) - Other Race
Place of birth - Foreign born (%)
Place of birth - Foreign born (%) - White
Place of birth - Foreign born (%) - Black or African American
Place of birth - Foreign born (%) - Asian
Place of birth - Foreign born (%) - Hispanic or Latino
Place of birth - Foreign born (%) - American Indian and Alaska Native
Place of birth - Foreign born (%) - Multirace
Place of birth - Foreign born (%) - Other Race
Residents speaking English at home (%)
Residents speaking English at home - Born in the United States (%)
Residents speaking English at home - Native, born elsewhere (%)
Residents speaking English at home - Foreign born (%)
Residents speaking Spanish at home (%)
Residents speaking Spanish at home - Born in the United States (%)
Residents speaking Spanish at home - Native, born elsewhere (%)
Residents speaking Spanish at home - Foreign born (%)
Residents speaking other language at home (%)
Residents speaking other language at home - Born in the United States (%)
Residents speaking other language at home - Native, born elsewhere (%)
Residents speaking other language at home - Foreign born (%)
Marital status - Never married (%)
Marital status - Now married (%)
Marital status - Separated (%)
Marital status - Widowed (%)
Marital status - Divorced (%)
Ancestries Reported - Arab (%)
Ancestries Reported - Czech (%)
Ancestries Reported - Danish (%)
Ancestries Reported - Dutch (%)
Ancestries Reported - English (%)
Ancestries Reported - French (%)
Ancestries Reported - French Canadian (%)
Ancestries Reported - German (%)
Ancestries Reported - Greek (%)
Ancestries Reported - Hungarian (%)
Ancestries Reported - Irish (%)
Ancestries Reported - Italian (%)
Ancestries Reported - Lithuanian (%)
Ancestries Reported - Norwegian (%)
Ancestries Reported - Polish (%)
Ancestries Reported - Portuguese (%)
Ancestries Reported - Russian (%)
Ancestries Reported - Scotch-Irish (%)
Ancestries Reported - Scottish (%)
Ancestries Reported - Slovak (%)
Ancestries Reported - Subsaharan African (%)
Ancestries Reported - Swedish (%)
Ancestries Reported - Swiss (%)
Ancestries Reported - Ukrainian (%)
Ancestries Reported - United States (%)
Ancestries Reported - Welsh (%)
Ancestries Reported - West Indian (%)
Ancestries Reported - Other (%)
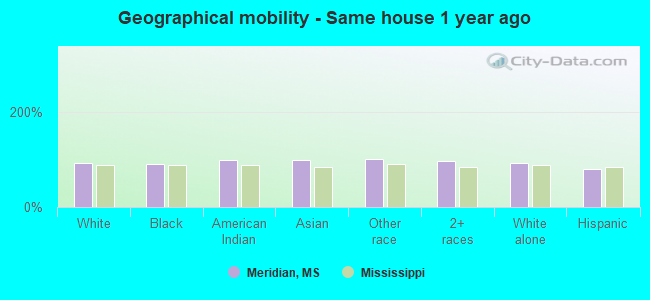
Geographical mobility - Same house 1 year ago (%)
Geographical mobility - Same house 1 year ago (%) - White
Geographical mobility - Same house 1 year ago (%) - Black or African American
Geographical mobility - Same house 1 year ago (%) - Asian
Geographical mobility - Same house 1 year ago (%) - Hispanic or Latino
Geographical mobility - Same house 1 year ago (%) - American Indian and Alaska Native
Geographical mobility - Same house 1 year ago (%) - Multirace
Geographical mobility - Same house 1 year ago (%) - Other Race
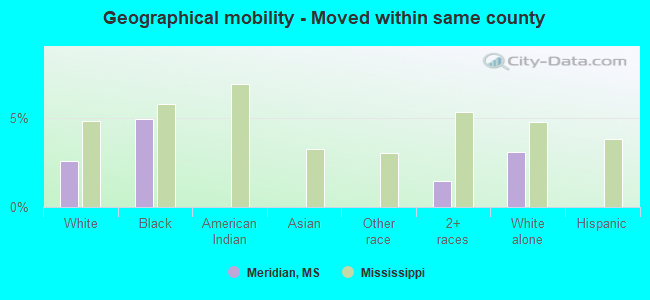
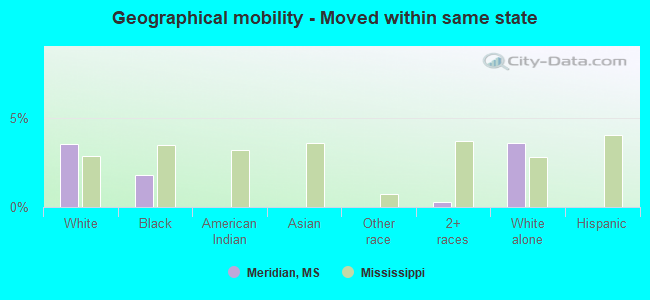
Geographical mobility - Moved within same county (%)
Geographical mobility - Moved within same county (%) - White
Geographical mobility - Moved within same county (%) - Black or African American
Geographical mobility - Moved within same county (%) - Asian
Geographical mobility - Moved within same county (%) - Hispanic or Latino
Geographical mobility - Moved within same county (%) - American Indian and Alaska Native
Geographical mobility - Moved within same county (%) - Multirace
Geographical mobility - Moved within same county (%) - Other Race
Geographical mobility - Moved from different county within same state (%)
Geographical mobility - Moved from different county within same state (%) - White
Geographical mobility - Moved from different county within same state (%) - Black or African American
Geographical mobility - Moved from different county within same state (%) - Asian
Geographical mobility - Moved from different county within same state (%) - Hispanic or Latino
Geographical mobility - Moved from different county within same state (%) - American Indian and Alaska Native
Geographical mobility - Moved from different county within same state (%) - Multirace
Geographical mobility - Moved from different county within same state (%) - Other Race
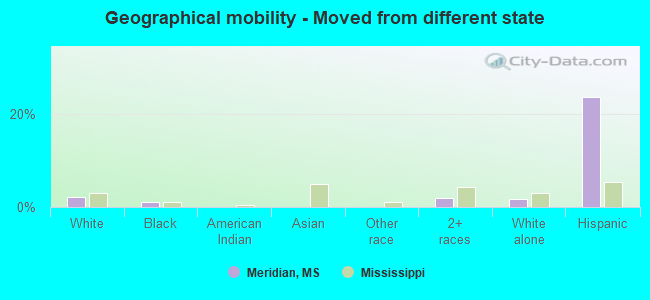
Geographical mobility - Moved from different state (%)
Geographical mobility - Moved from different state (%) - White
Geographical mobility - Moved from different state (%) - Black or African American
Geographical mobility - Moved from different state (%) - Asian
Geographical mobility - Moved from different state (%) - Hispanic or Latino
Geographical mobility - Moved from different state (%) - American Indian and Alaska Native
Geographical mobility - Moved from different state (%) - Multirace
Geographical mobility - Moved from different state (%) - Other Race
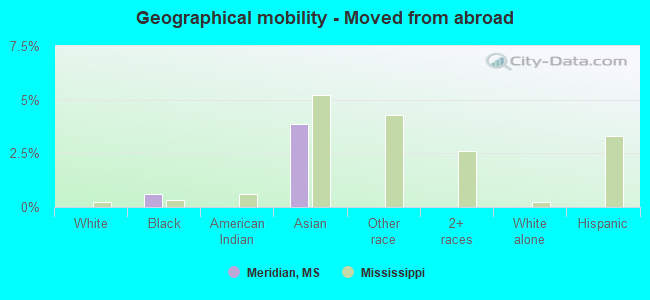
Geographical mobility - Moved from abroad (%)
Geographical mobility - Moved from abroad (%) - White
Geographical mobility - Moved from abroad (%) - Black or African American
Geographical mobility - Moved from abroad (%) - Asian
Geographical mobility - Moved from abroad (%) - Hispanic or Latino
Geographical mobility - Moved from abroad (%) - American Indian and Alaska Native
Geographical mobility - Moved from abroad (%) - Multirace
Geographical mobility - Moved from abroad (%) - Other Race
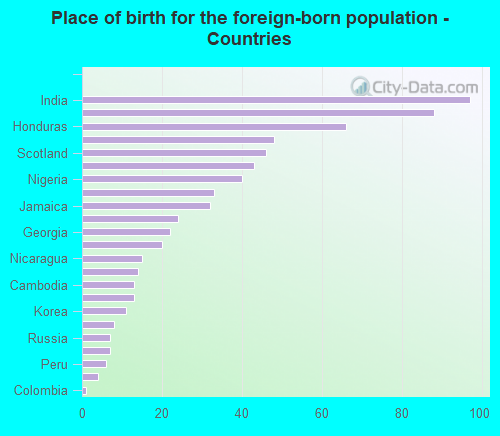
Place of birth for the foreign-born population - Ireland (%)
Place of birth for the foreign-born population - Denmark (%)
Place of birth for the foreign-born population - Norway (%)
Place of birth for the foreign-born population - Sweden (%)
Place of birth for the foreign-born population - United Kingdom (%)
Place of birth for the foreign-born population - England (%)
Place of birth for the foreign-born population - Scotland (%)
Place of birth for the foreign-born population - Other Northern Europe (%)
Place of birth for the foreign-born population - Austria (%)
Place of birth for the foreign-born population - Belgium (%)
Place of birth for the foreign-born population - France (%)
Place of birth for the foreign-born population - Germany (%)
Place of birth for the foreign-born population - Netherlands (%)
Place of birth for the foreign-born population - Switzerland (%)
Place of birth for the foreign-born population - Other Western Europe (%)
Place of birth for the foreign-born population - Greece (%)
Place of birth for the foreign-born population - Italy (%)
Place of birth for the foreign-born population - Portugal (%)
Place of birth for the foreign-born population - Spain (%)
Place of birth for the foreign-born population - Other Southern Europe (%)
Place of birth for the foreign-born population - Albania (%)
Place of birth for the foreign-born population - Belarus (%)
Place of birth for the foreign-born population - Bosnia and Herzegovina (%)
Place of birth for the foreign-born population - Bulgaria (%)
Place of birth for the foreign-born population - Croatia (%)
Place of birth for the foreign-born population - Czechoslovakia (%)
Place of birth for the foreign-born population - Hungary (%)
Place of birth for the foreign-born population - Latvia (%)
Place of birth for the foreign-born population - Lithuania (%)
Place of birth for the foreign-born population - North Macedonia (Macedonia) (%)
Place of birth for the foreign-born population - Moldova (%)
Place of birth for the foreign-born population - Poland (%)
Place of birth for the foreign-born population - Romania (%)
Place of birth for the foreign-born population - Russia (%)
Place of birth for the foreign-born population - Serbia (%)
Place of birth for the foreign-born population - Ukraine (%)
Place of birth for the foreign-born population - Other Eastern Europe (%)
Place of birth for the foreign-born population - China (%)
Place of birth for the foreign-born population - Hong Kong (%)
Place of birth for the foreign-born population - Taiwan (%)
Place of birth for the foreign-born population - Japan (%)
Place of birth for the foreign-born population - Korea (%)
Place of birth for the foreign-born population - Other Eastern Asia (%)
Place of birth for the foreign-born population - Afghanistan (%)
Place of birth for the foreign-born population - Bangladesh (%)
Place of birth for the foreign-born population - India (%)
Place of birth for the foreign-born population - Iran (%)
Place of birth for the foreign-born population - Kazakhstan (%)
Place of birth for the foreign-born population - Nepal (%)
Place of birth for the foreign-born population - Pakistan (%)
Place of birth for the foreign-born population - Sri Lanka (%)
Place of birth for the foreign-born population - Uzbekistan (%)
Place of birth for the foreign-born population - Other South Central Asia (%)
Place of birth for the foreign-born population - Burma (%)
Place of birth for the foreign-born population - Cambodia (%)
Place of birth for the foreign-born population - Indonesia (%)
Place of birth for the foreign-born population - Laos (%)
Place of birth for the foreign-born population - Malaysia (%)
Place of birth for the foreign-born population - Philippines (%)
Place of birth for the foreign-born population - Singapore (%)
Place of birth for the foreign-born population - Thailand (%)
Place of birth for the foreign-born population - Vietnam (%)
Place of birth for the foreign-born population - Other South Eastern Asia (%)
Place of birth for the foreign-born population - Armenia (%)
Place of birth for the foreign-born population - Iraq (%)
Place of birth for the foreign-born population - Israel (%)
Place of birth for the foreign-born population - Jordan (%)
Place of birth for the foreign-born population - Kuwait (%)
Place of birth for the foreign-born population - Lebanon (%)
Place of birth for the foreign-born population - Saudi Arabia (%)
Place of birth for the foreign-born population - Syria (%)
Place of birth for the foreign-born population - Turkey (%)
Place of birth for the foreign-born population - Yemen (%)
Place of birth for the foreign-born population - Other Western Asia (%)
Place of birth for the foreign-born population - Eritrea (%)
Place of birth for the foreign-born population - Ethiopia (%)
Place of birth for the foreign-born population - Kenya (%)
Place of birth for the foreign-born population - Somalia (%)
Place of birth for the foreign-born population - Uganda (%)
Place of birth for the foreign-born population - Zimbabwe (%)
Place of birth for the foreign-born population - Other Eastern Africa (%)
Place of birth for the foreign-born population - Cameroon (%)
Place of birth for the foreign-born population - Congo (%)
Place of birth for the foreign-born population - Democratic Republic of Congo (Zaire) (%)
Place of birth for the foreign-born population - Other Middle Africa (%)
Place of birth for the foreign-born population - Egypt (%)
Place of birth for the foreign-born population - Morocco (%)
Place of birth for the foreign-born population - Sudan (%)
Place of birth for the foreign-born population - Other Northern Africa (%)
Place of birth for the foreign-born population - South Africa (%)
Place of birth for the foreign-born population - Other Southern Africa (%)
Place of birth for the foreign-born population - Cabo Verde (%)
Place of birth for the foreign-born population - Ghana (%)
Place of birth for the foreign-born population - Liberia (%)
Place of birth for the foreign-born population - Nigeria (%)
Place of birth for the foreign-born population - Senegal (%)
Place of birth for the foreign-born population - Sierra Leone (%)
Place of birth for the foreign-born population - Other Western Africa (%)
Place of birth for the foreign-born population - Australia (%)
Place of birth for the foreign-born population - New Zealand (%)
Place of birth for the foreign-born population - Fiji (%)
Place of birth for the foreign-born population - Micronesia (%)
Place of birth for the foreign-born population - Bahamas (%)
Place of birth for the foreign-born population - Barbados (%)
Place of birth for the foreign-born population - Cuba (%)
Place of birth for the foreign-born population - Dominica (%)
Place of birth for the foreign-born population - Dominican Republic (%)
Place of birth for the foreign-born population - Grenada (%)
Place of birth for the foreign-born population - Haiti (%)
Place of birth for the foreign-born population - Jamaica (%)
Place of birth for the foreign-born population - St. Vincent and the Grenadines (%)
Place of birth for the foreign-born population - Trinidad and Tobago (%)
Place of birth for the foreign-born population - West Indies (%)
Place of birth for the foreign-born population - Other Caribbean (%)
Place of birth for the foreign-born population - Belize (%)
Place of birth for the foreign-born population - Costa Rica (%)
Place of birth for the foreign-born population - El Salvador (%)
Place of birth for the foreign-born population - Guatemala (%)
Place of birth for the foreign-born population - Honduras (%)
Place of birth for the foreign-born population - Mexico (%)
Place of birth for the foreign-born population - Nicaragua (%)
Place of birth for the foreign-born population - Panama (%)
Place of birth for the foreign-born population - Other Central America (%)
Place of birth for the foreign-born population - Argentina (%)
Place of birth for the foreign-born population - Bolivia (%)
Place of birth for the foreign-born population - Brazil (%)
Place of birth for the foreign-born population - Chile (%)
Place of birth for the foreign-born population - Colombia (%)
Place of birth for the foreign-born population - Ecuador (%)
Place of birth for the foreign-born population - Guyana (%)
Place of birth for the foreign-born population - Peru (%)
Place of birth for the foreign-born population - Uruguay (%)
Place of birth for the foreign-born population - Venezuela (%)
Place of birth for the foreign-born population - Other South America (%)
Place of birth for the foreign-born population - Canada (%)
Place of birth for the foreign-born population - Other Northern America (%)
Place of birth for the foreign-born population - Other (%)
Latest news about races in Meridian, MS collected exclusively by city-data.com from local newspapers, TV, and radio stations
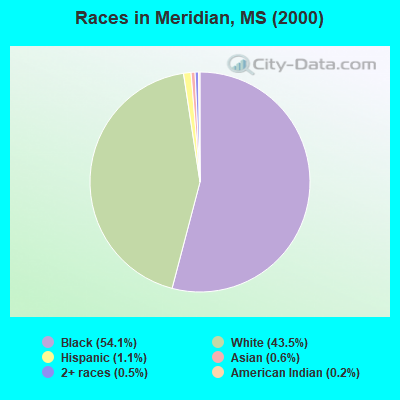
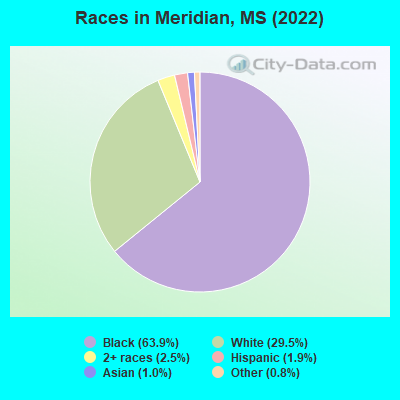
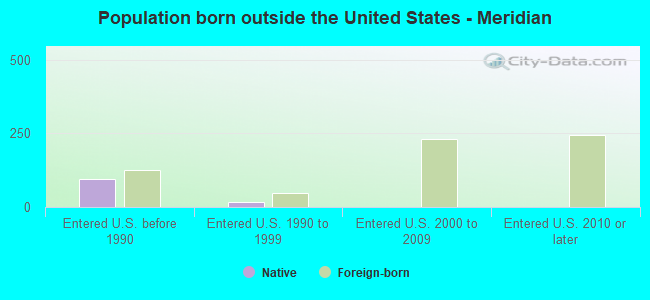
According to 2022 data, the most numerous races in Meridian, MS are White alone (10,245 residents), Black alone (22,205 residents), and Hispanic (648 residents). 97.2% of Meridian residents speak English at home. 2.1% of Meridian, MS residents are foreign-born (0.9% born in Latin America, 0.8% born in Asia), which is 4.5% greater than the foreign-born rate of 2.0% across the entire state of Mississippi.
Race distribution in Meridian
2000 2022
1,727,908 60.7% White alone 1,028,473 36.2% Black alone 39,569 1.4% Hispanic 17,272 0.6% Two or more races 18,349 0.6% Asian alone 11,224 0.4% American Indian alone 1,294 0.05% Other race alone 569 0.02% Native Hawaiian and Other
1,625,979 55.3% White alone 1,072,962 36.5% Black alone 97,177 3.3% Hispanic 96,367 3.3% Two or more races 25,217 0.9% Asian alone 12,457 0.4% American Indian alone 9,501 0.3% Other race alone 397 0.01% Native Hawaiian and Other
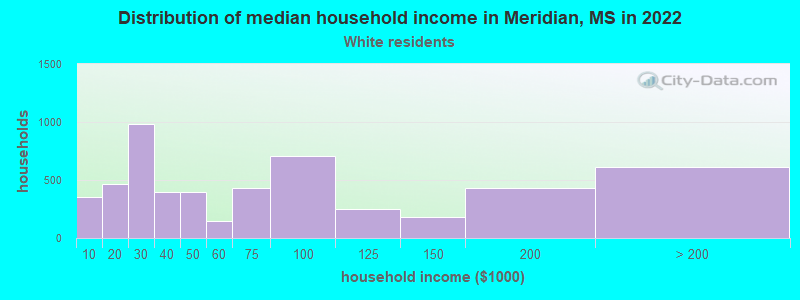
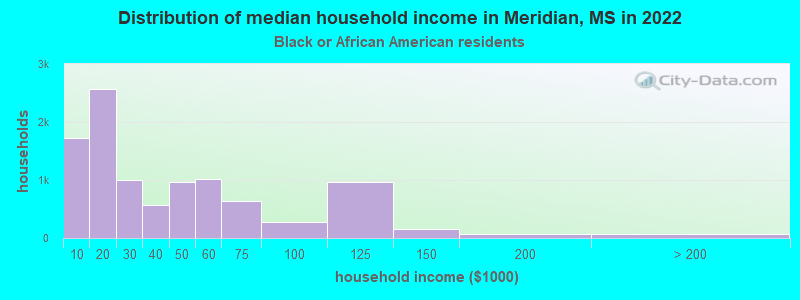
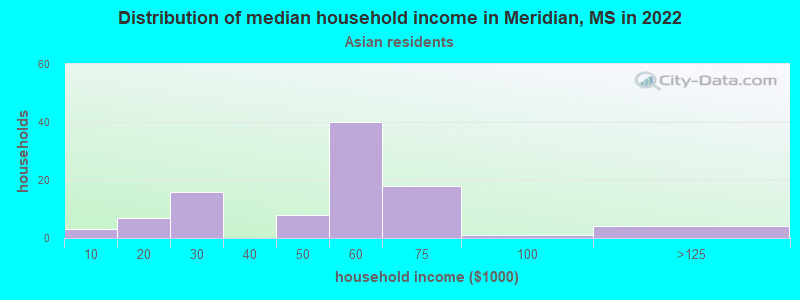
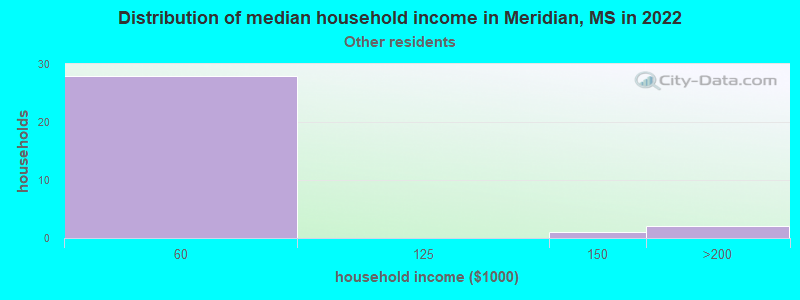
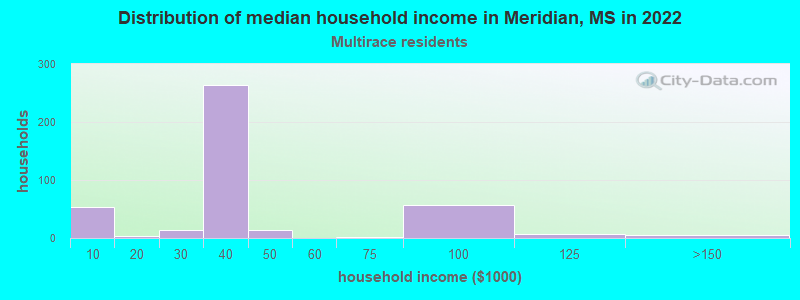
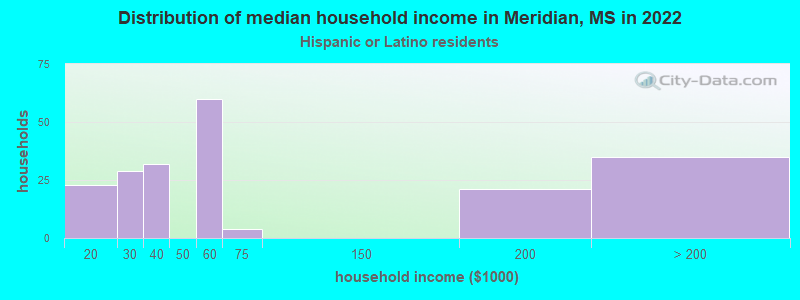
Income and house value in Meridian Median household income in 2022 $57,848 White non-Hispanic householders$36,653 Black householders$40,498 Asian householders$59,037 Some other race householders$32,415 Two or more races householders$56,962 Hispanic or Latino race householdersMedian 2022 house value $117,225 White Non-Hispanic householders$73,602 Black or African American householders$77,139 American Indian or Alaska Native householders $204,807 Asian householders$212,892 Two or more races householders
Median age by race in Meridian
51.8 Median age for White residents52.4 52.1 38.4 Median age for Black or African American residents35.5 39.2 -659,400,544.3 Median age for American Indian / Alaska Native residents-661,202,185.1 -710,601,718.5 40.0 Median age for Asian residents12.9 32.8 -666,666,666.0 Median age for Native Hawaiian / Pacific Islander residents-666,666,666.0 -666,666,666.0 17.2 Median age for Other race residents47.8 16.3 41.8 Median age for Two or more races residents30.9 24.0 51.6 Median age for White alone residents52.2 52.1 39.1 Median age for Hispanic or Latino residents35.7 32.5
Owner/renter occupied households by race in Meridian
House owners and renters - White residents 3,315 65.4% Owner occupied1,754 34.6% Renter occupiedHouse owners and renters - Black or African American residents 3,918 43.7% Owner occupied5,058 56.3% Renter occupiedHouse owners and renters - American Indian / Alaska Native residents 3 100.0% Owner occupiedHouse owners and renters - Asian residents 66 59.4% Owner occupied45 40.6% Renter occupiedHouse owners and renters - Other race residents 48 84.7% Owner occupied9 15.3% Renter occupiedHouse owners and renters - Two or more races residents 351 79.8% Owner occupied89 20.2% Renter occupiedHouse owners and renters - White alone residents 3,237 65.0% Owner occupied1,744 35.0% Renter occupiedHouse owners and renters - Hispanic or Latino residents 264 74.4% Owner occupied91 25.6% Renter occupied
Language usage in Meridian
English speakers - Total 97.2% of residents of Meridian speak English at home.
1.1% of residents speak Spanish at home 219 64.2% Speak English very well122 35.8% Speak English less than very well1.7% of residents speak other language at home 375 66.4% Speak English very well190 33.6% Speak English less than very well
English speakers - Born in the United States 98.5% of residents of Meridian speak English at home.
0.5% of residents speak Spanish at home 32 100.0% Speak English very well1.1% of residents speak other language at home 67 100.0% Speak English very well
English speakers - Native, born elsewhere 89.0% of residents of Meridian speak English at home.
9.4% of residents speak other language at home 12 100.0% Speak English very well
English speakers - Foreign-born 20.1% of residents of Meridian speak English at home.
40.6% of residents speak Spanish at home 153 56.0% Speak English very well120 44.0% Speak English less than very well39.4% of residents speak other language at home 181 68.3% Speak English very well84 31.7% Speak English less than very well
White (Caucasian) - Speak only English Native:
99.0% (9,547)Foreign-born:
27.8% (41)
White (Caucasian) - Speak another language Native:
1.0% (96)Foreign-born:
66.7% (98)
Black or African American - Speak only English Native:
99.8% (20,592)Foreign-born:
61.3% (58)
Black or African American - Speak another language Native:
0.2% (42)Foreign-born:
35.9% (34)
Asian - Speak only English Native:
45.7% (63)Foreign-born:
25.1% (48)
Asian - Speak another language Native:
55.3% (76)Foreign-born:
76.2% (147)
Other race - Speak another language Native:
3.4% (9)Foreign-born:
100.0% (181)
Two or more races - Speak another language Native:
6.1% (58)Foreign-born:
100.0% (33)
White alone - Speak only English Native:
98.6% (9,373)Foreign-born:
30.7% (43)
White alone - Speak another language Native:
1.4% (134)Foreign-born:
71.5% (100)
Hispanic or Latino - Speak another language Native:
7.8% (28)Foreign-born:
100.0% (246)
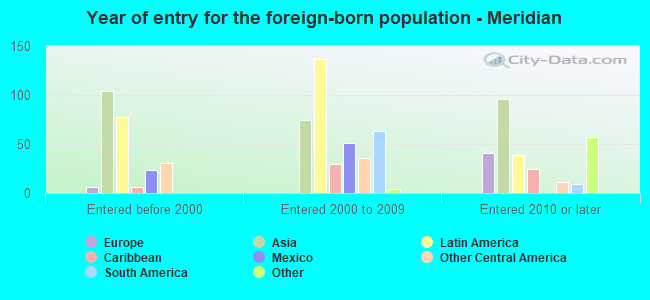
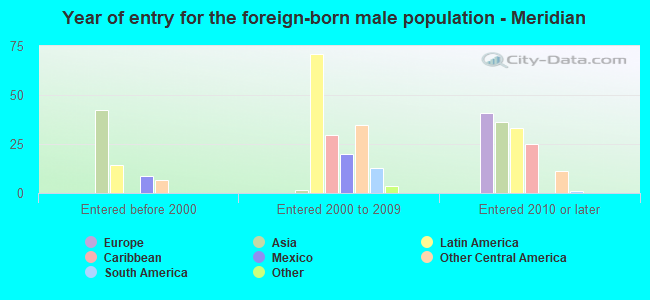
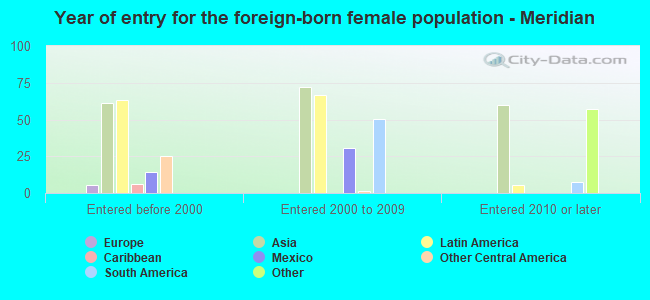
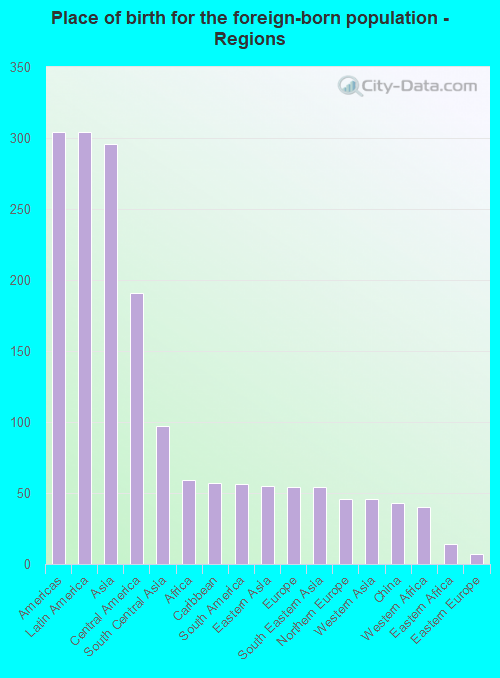
Foreign-born residents in Meridian 714 residents are foreign born (0.9% Latin America , 0.8% Asia ).
This city:
2.1%Mississippi:
2.3%
Marital status for residents in Meridian Marital status - White (Caucasian) population 15 years and over
Males 28.3% Never married52.9% Now married0.9% Separated2.8% Widowed15.1% DivorcedFemales 13.3% Never married48.7% Now married2.7% Separated15.6% Widowed19.7% DivorcedWomen who gave birth in the past 12 months Now married:
71.4% (132)Unmarried:
28.6% (53)
Women who did not give birth in the past 12 months Now married:
60.5% (832)Unmarried:
39.5% (544)
Marital status - Black or African American population 15 years and over
Males 48.8% Never married28.7% Now married2.9% Separated5.5% Widowed14.1% DivorcedFemales 50.3% Never married22.0% Now married5.5% Separated9.8% Widowed12.4% DivorcedWomen who gave birth in the past 12 months Now married:
24.0% (89)Unmarried:
76.0% (284)
Women who did not give birth in the past 12 months Now married:
27.2% (1,457)Unmarried:
72.8% (3,906)
Marital status - American Indian / Alaska Native population 15 years and over
Males 100.0% Never married0.0% Now married0.0% Separated0.0% Widowed0.0% DivorcedFemales 100.0% Never married0.0% Now married0.0% Separated0.0% Widowed0.0% DivorcedWomen who did not give birth in the past 12 months Now married:
0.0% (0)Unmarried:
100.0% (2)
Marital status - Asian population 15 years and over
Males 37.3% Never married50.8% Now married0.0% Separated0.0% Widowed11.9% DivorcedFemales 31.0% Never married66.5% Now married0.0% Separated2.5% Widowed0.0% DivorcedWomen who did not give birth in the past 12 months Now married:
67.9% (90)Unmarried:
32.1% (42)
Marital status - Other race population 15 years and over
Males 48.9% Never married51.1% Now married0.0% Separated0.0% Widowed0.0% DivorcedFemales 54.8% Never married45.2% Now married0.0% Separated0.0% Widowed0.0% DivorcedWomen who did not give birth in the past 12 months Now married:
35.7% (73)Unmarried:
64.3% (132)
Marital status - Two or more races population 15 years and over
Males 0.9% Never married19.6% Now married23.7% Separated49.8% Widowed6.0% DivorcedFemales 63.0% Never married22.0% Now married0.0% Separated0.0% Widowed15.0% DivorcedWomen who gave birth in the past 12 months Now married:
0.0% (0)Unmarried:
100.0% (15)
Women who did not give birth in the past 12 months Now married:
16.7% (34)Unmarried:
83.3% (169)
Marital status - White alone, not Hispanic / Latino population 15 years and over
Males 28.9% Never married52.4% Now married0.4% Separated2.9% Widowed15.4% DivorcedFemales 13.6% Never married48.1% Now married2.7% Separated16.1% Widowed19.5% DivorcedWomen who gave birth in the past 12 months Now married:
69.3% (121)Unmarried:
30.7% (54)
Women who did not give birth in the past 12 months Now married:
58.7% (784)Unmarried:
41.3% (553)
Marital status - Hispanic or Latino population 15 years and over
Males 22.0% Never married62.7% Now married9.7% Separated5.5% Widowed0.0% DivorcedFemales 10.1% Never married67.6% Now married0.0% Separated7.7% Widowed14.6% DivorcedWomen who gave birth in the past 12 months Now married:
100.0% (15)Unmarried:
0.0% (0)
Women who did not give birth in the past 12 months Now married:
87.0% (152)Unmarried:
13.0% (23)
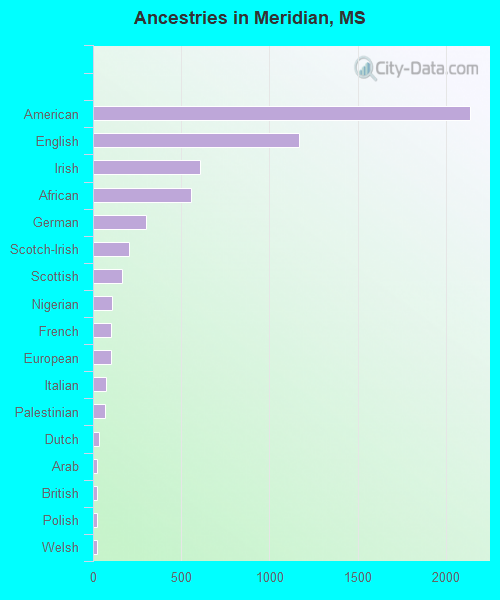
Ancestries in Meridian
2,138 9.2% American1,167 5.0% English609 2.6% Irish556 2.4% African299 1.3% German205 0.9% Scotch-Irish165 0.7% Scottish107 0.5% Nigerian103 0.4% French102 0.4% European72 0.3% Italian68 0.3% Palestinian32 0.1% Dutch21 0.09% Arab20 0.09% British20 0.09% Polish20 0.09% Welsh19 0.08% Norwegian18 0.08% Greek17 0.07% Romanian15 0.06% Czech15 0.06% Swedish12 0.05% Austrian9 0.04% Northern European8 0.03% Danish8 0.03% Hungarian2 0.01% French Canadian
Children Nativity (place of birth) in Meridian
Children under 6 years - Living with two parents Both parents native 678 100.0% NativeBoth parents foreign-born 11 100.0% NativeOne native, one foreign-born parent 88 100.0% NativeChildren under 6 years - Living with one parent Native parent 1,734 100.0% NativeChildren 6 to 17 years - Living with two parents Both parents native 1,878 100.0% NativeBoth parents foreign-born 97 100.0% NativeOne native, one foreign-born parent 9 100.0% NativeChildren 6 to 17 years - Living with one parent Native parent 2,946 100.0% NativeForeign-born parent 10 46.3% Native11 53.7% Foreign-born
Grandparents responsible for own grandchildren in Meridian
Grandparents (30 to 59 years) White / Caucasian 118 100.0% Responsible for grandchildrenBlack or African American 286 56.6% Responsible for grandchildren219 43.4% Not responsible for grandchildrenWhite alone, not Hispanic / Latino 119 100.0% Responsible for grandchildrenGrandparents (60 years and over) White / Caucasian 23 25.6% Responsible for grandchildren67 74.4% Not responsible for grandchildrenBlack or African American 134 47.1% Responsible for grandchildren150 52.9% Not responsible for grandchildrenWhite alone, not Hispanic / Latino 23 25.5% Responsible for grandchildren67 74.5% Not responsible for grandchildren