Races in Merriam, Kansas (KS) Detailed Stats
Data:
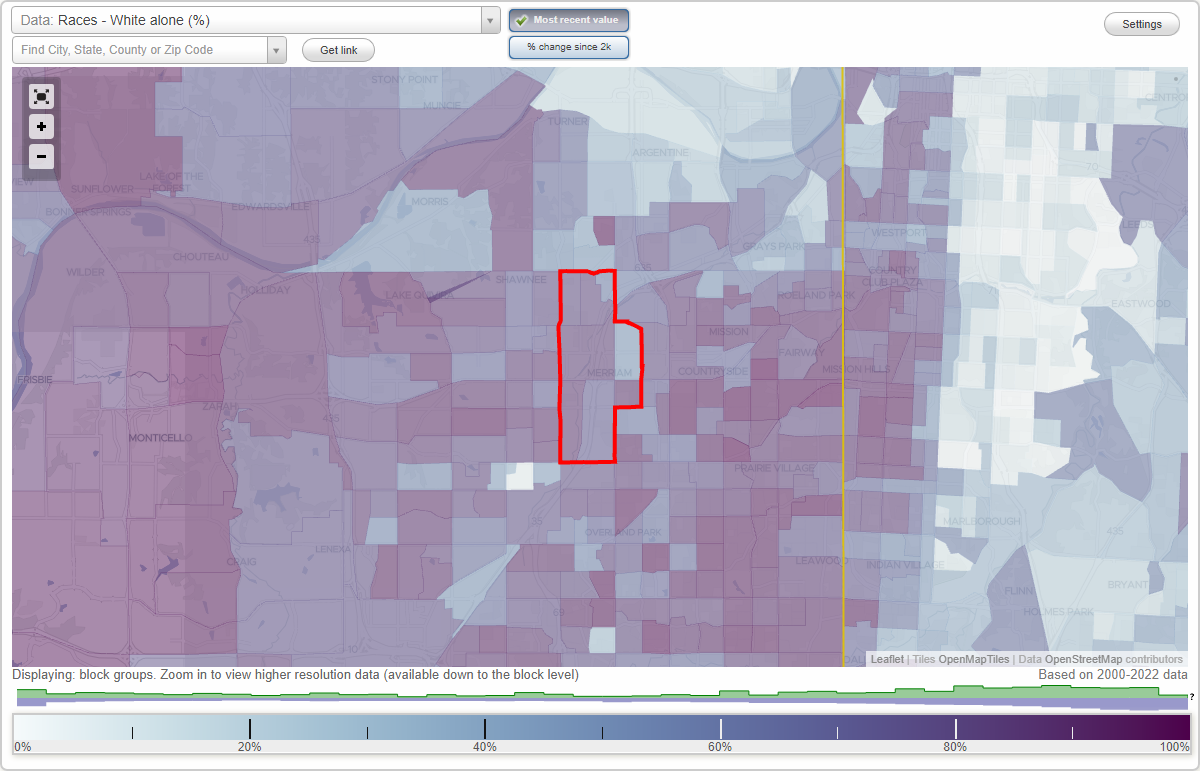
Races - White alone (%)
Races - White alone (% change since 2000)
Races - Black alone (%)
Races - Black alone (% change since 2000)
Races - American Indian alone (%)
Races - American Indian alone (% change since 2000)
Races - Asian alone (%)
Races - Asian alone (% change since 2000)
Races - Hispanic (%)
Races - Hispanic (% change since 2000)
Races - Native Hawaiian and Other Pacific Islander alone (%)
Races - Native Hawaiian and Other Pacific Islander alone (% change since 2000)
Races - Two or more races(%)
Races - Two or more races(% change since 2000)
Races - Other race alone (%)
Races - Other race alone (% change since 2000)
Racial diversity
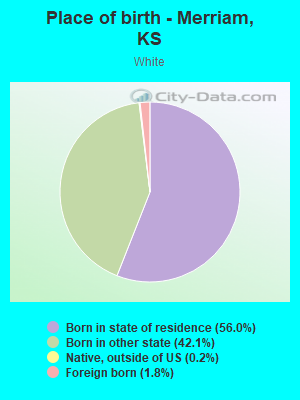
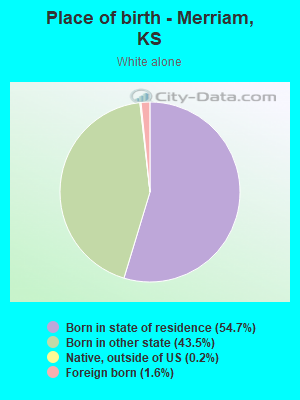
Place of birth - Born in state of residence (%)
Place of birth - Born in state of residence (%) - White
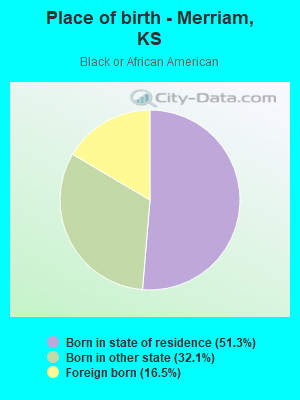
Place of birth - Born in state of residence (%) - Black or African American
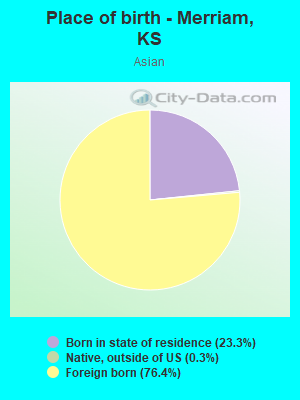
Place of birth - Born in state of residence (%) - Asian
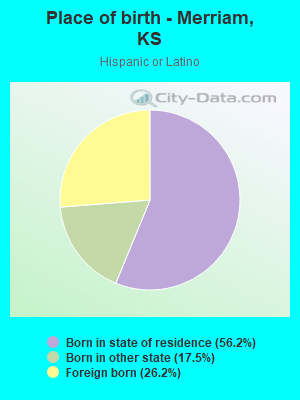
Place of birth - Born in state of residence (%) - Hispanic or Latino
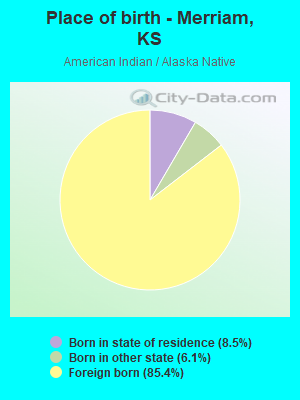
Place of birth - Born in state of residence (%) - American Indian and Alaska Native
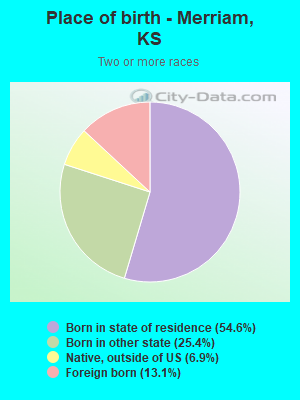
Place of birth - Born in state of residence (%) - Multirace
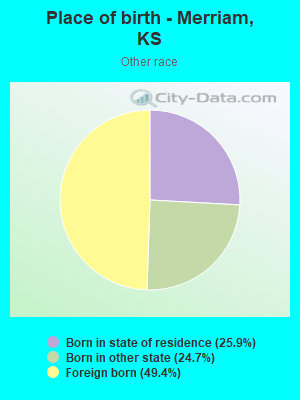
Place of birth - Born in state of residence (%) - Other Race
Place of birth - Born in other state (%)
Place of birth - Born in other state (%) - White
Place of birth - Born in other state (%) - Black or African American
Place of birth - Born in other state (%) - Asian
Place of birth - Born in other state (%) - Hispanic or Latino
Place of birth - Born in other state (%) - American Indian and Alaska Native
Place of birth - Born in other state (%) - Multirace
Place of birth - Born in other state (%) - Other Race
Place of birth - Native, outside of US (%)
Place of birth - Native, outside of US (%) - White
Place of birth - Native, outside of US (%) - Black or African American
Place of birth - Native, outside of US (%) - Asian
Place of birth - Native, outside of US (%) - Hispanic or Latino
Place of birth - Native, outside of US (%) - American Indian and Alaska Native
Place of birth - Native, outside of US (%) - Multirace
Place of birth - Native, outside of US (%) - Other Race
Place of birth - Foreign born (%)
Place of birth - Foreign born (%) - White
Place of birth - Foreign born (%) - Black or African American
Place of birth - Foreign born (%) - Asian
Place of birth - Foreign born (%) - Hispanic or Latino
Place of birth - Foreign born (%) - American Indian and Alaska Native
Place of birth - Foreign born (%) - Multirace
Place of birth - Foreign born (%) - Other Race
Residents speaking English at home (%)
Residents speaking English at home - Born in the United States (%)
Residents speaking English at home - Native, born elsewhere (%)
Residents speaking English at home - Foreign born (%)
Residents speaking Spanish at home (%)
Residents speaking Spanish at home - Born in the United States (%)
Residents speaking Spanish at home - Native, born elsewhere (%)
Residents speaking Spanish at home - Foreign born (%)
Residents speaking other language at home (%)
Residents speaking other language at home - Born in the United States (%)
Residents speaking other language at home - Native, born elsewhere (%)
Residents speaking other language at home - Foreign born (%)
Marital status - Never married (%)
Marital status - Now married (%)
Marital status - Separated (%)
Marital status - Widowed (%)
Marital status - Divorced (%)
Ancestries Reported - Arab (%)
Ancestries Reported - Czech (%)
Ancestries Reported - Danish (%)
Ancestries Reported - Dutch (%)
Ancestries Reported - English (%)
Ancestries Reported - French (%)
Ancestries Reported - French Canadian (%)
Ancestries Reported - German (%)
Ancestries Reported - Greek (%)
Ancestries Reported - Hungarian (%)
Ancestries Reported - Irish (%)
Ancestries Reported - Italian (%)
Ancestries Reported - Lithuanian (%)
Ancestries Reported - Norwegian (%)
Ancestries Reported - Polish (%)
Ancestries Reported - Portuguese (%)
Ancestries Reported - Russian (%)
Ancestries Reported - Scotch-Irish (%)
Ancestries Reported - Scottish (%)
Ancestries Reported - Slovak (%)
Ancestries Reported - Subsaharan African (%)
Ancestries Reported - Swedish (%)
Ancestries Reported - Swiss (%)
Ancestries Reported - Ukrainian (%)
Ancestries Reported - United States (%)
Ancestries Reported - Welsh (%)
Ancestries Reported - West Indian (%)
Ancestries Reported - Other (%)
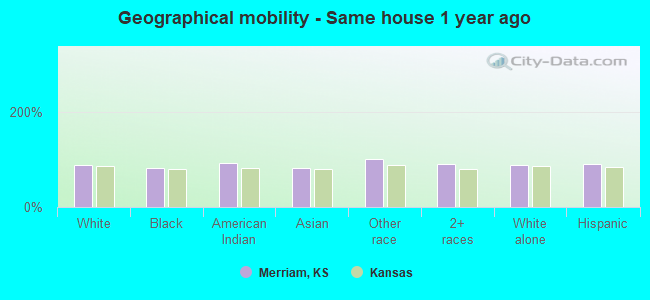
Geographical mobility - Same house 1 year ago (%)
Geographical mobility - Same house 1 year ago (%) - White
Geographical mobility - Same house 1 year ago (%) - Black or African American
Geographical mobility - Same house 1 year ago (%) - Asian
Geographical mobility - Same house 1 year ago (%) - Hispanic or Latino
Geographical mobility - Same house 1 year ago (%) - American Indian and Alaska Native
Geographical mobility - Same house 1 year ago (%) - Multirace
Geographical mobility - Same house 1 year ago (%) - Other Race
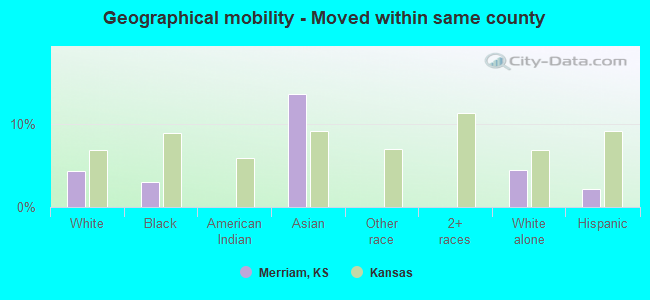
Geographical mobility - Moved within same county (%)
Geographical mobility - Moved within same county (%) - White
Geographical mobility - Moved within same county (%) - Black or African American
Geographical mobility - Moved within same county (%) - Asian
Geographical mobility - Moved within same county (%) - Hispanic or Latino
Geographical mobility - Moved within same county (%) - American Indian and Alaska Native
Geographical mobility - Moved within same county (%) - Multirace
Geographical mobility - Moved within same county (%) - Other Race
Geographical mobility - Moved from different county within same state (%)
Geographical mobility - Moved from different county within same state (%) - White
Geographical mobility - Moved from different county within same state (%) - Black or African American
Geographical mobility - Moved from different county within same state (%) - Asian
Geographical mobility - Moved from different county within same state (%) - Hispanic or Latino
Geographical mobility - Moved from different county within same state (%) - American Indian and Alaska Native
Geographical mobility - Moved from different county within same state (%) - Multirace
Geographical mobility - Moved from different county within same state (%) - Other Race
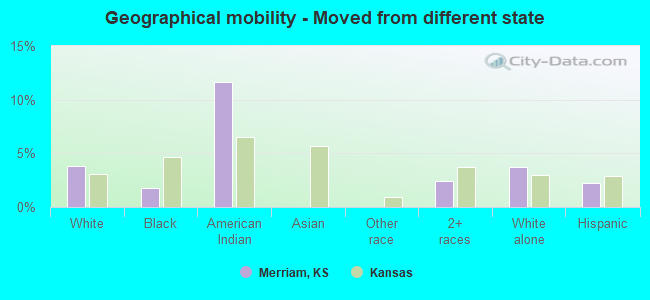
Geographical mobility - Moved from different state (%)
Geographical mobility - Moved from different state (%) - White
Geographical mobility - Moved from different state (%) - Black or African American
Geographical mobility - Moved from different state (%) - Asian
Geographical mobility - Moved from different state (%) - Hispanic or Latino
Geographical mobility - Moved from different state (%) - American Indian and Alaska Native
Geographical mobility - Moved from different state (%) - Multirace
Geographical mobility - Moved from different state (%) - Other Race
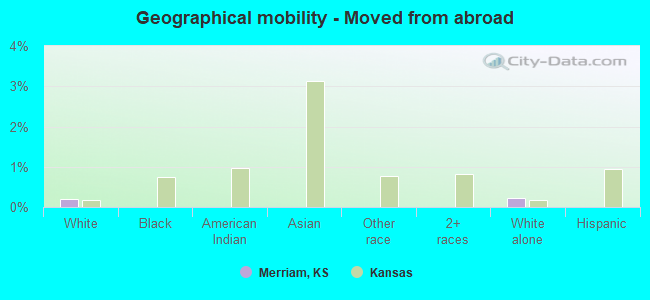
Geographical mobility - Moved from abroad (%)
Geographical mobility - Moved from abroad (%) - White
Geographical mobility - Moved from abroad (%) - Black or African American
Geographical mobility - Moved from abroad (%) - Asian
Geographical mobility - Moved from abroad (%) - Hispanic or Latino
Geographical mobility - Moved from abroad (%) - American Indian and Alaska Native
Geographical mobility - Moved from abroad (%) - Multirace
Geographical mobility - Moved from abroad (%) - Other Race
Place of birth for the foreign-born population - Ireland (%)
Place of birth for the foreign-born population - Denmark (%)
Place of birth for the foreign-born population - Norway (%)
Place of birth for the foreign-born population - Sweden (%)
Place of birth for the foreign-born population - United Kingdom (%)
Place of birth for the foreign-born population - England (%)
Place of birth for the foreign-born population - Scotland (%)
Place of birth for the foreign-born population - Other Northern Europe (%)
Place of birth for the foreign-born population - Austria (%)
Place of birth for the foreign-born population - Belgium (%)
Place of birth for the foreign-born population - France (%)
Place of birth for the foreign-born population - Germany (%)
Place of birth for the foreign-born population - Netherlands (%)
Place of birth for the foreign-born population - Switzerland (%)
Place of birth for the foreign-born population - Other Western Europe (%)
Place of birth for the foreign-born population - Greece (%)
Place of birth for the foreign-born population - Italy (%)
Place of birth for the foreign-born population - Portugal (%)
Place of birth for the foreign-born population - Spain (%)
Place of birth for the foreign-born population - Other Southern Europe (%)
Place of birth for the foreign-born population - Albania (%)
Place of birth for the foreign-born population - Belarus (%)
Place of birth for the foreign-born population - Bosnia and Herzegovina (%)
Place of birth for the foreign-born population - Bulgaria (%)
Place of birth for the foreign-born population - Croatia (%)
Place of birth for the foreign-born population - Czechoslovakia (%)
Place of birth for the foreign-born population - Hungary (%)
Place of birth for the foreign-born population - Latvia (%)
Place of birth for the foreign-born population - Lithuania (%)
Place of birth for the foreign-born population - North Macedonia (Macedonia) (%)
Place of birth for the foreign-born population - Moldova (%)
Place of birth for the foreign-born population - Poland (%)
Place of birth for the foreign-born population - Romania (%)
Place of birth for the foreign-born population - Russia (%)
Place of birth for the foreign-born population - Serbia (%)
Place of birth for the foreign-born population - Ukraine (%)
Place of birth for the foreign-born population - Other Eastern Europe (%)
Place of birth for the foreign-born population - China (%)
Place of birth for the foreign-born population - Hong Kong (%)
Place of birth for the foreign-born population - Taiwan (%)
Place of birth for the foreign-born population - Japan (%)
Place of birth for the foreign-born population - Korea (%)
Place of birth for the foreign-born population - Other Eastern Asia (%)
Place of birth for the foreign-born population - Afghanistan (%)
Place of birth for the foreign-born population - Bangladesh (%)
Place of birth for the foreign-born population - India (%)
Place of birth for the foreign-born population - Iran (%)
Place of birth for the foreign-born population - Kazakhstan (%)
Place of birth for the foreign-born population - Nepal (%)
Place of birth for the foreign-born population - Pakistan (%)
Place of birth for the foreign-born population - Sri Lanka (%)
Place of birth for the foreign-born population - Uzbekistan (%)
Place of birth for the foreign-born population - Other South Central Asia (%)
Place of birth for the foreign-born population - Burma (%)
Place of birth for the foreign-born population - Cambodia (%)
Place of birth for the foreign-born population - Indonesia (%)
Place of birth for the foreign-born population - Laos (%)
Place of birth for the foreign-born population - Malaysia (%)
Place of birth for the foreign-born population - Philippines (%)
Place of birth for the foreign-born population - Singapore (%)
Place of birth for the foreign-born population - Thailand (%)
Place of birth for the foreign-born population - Vietnam (%)
Place of birth for the foreign-born population - Other South Eastern Asia (%)
Place of birth for the foreign-born population - Armenia (%)
Place of birth for the foreign-born population - Iraq (%)
Place of birth for the foreign-born population - Israel (%)
Place of birth for the foreign-born population - Jordan (%)
Place of birth for the foreign-born population - Kuwait (%)
Place of birth for the foreign-born population - Lebanon (%)
Place of birth for the foreign-born population - Saudi Arabia (%)
Place of birth for the foreign-born population - Syria (%)
Place of birth for the foreign-born population - Turkey (%)
Place of birth for the foreign-born population - Yemen (%)
Place of birth for the foreign-born population - Other Western Asia (%)
Place of birth for the foreign-born population - Eritrea (%)
Place of birth for the foreign-born population - Ethiopia (%)
Place of birth for the foreign-born population - Kenya (%)
Place of birth for the foreign-born population - Somalia (%)
Place of birth for the foreign-born population - Uganda (%)
Place of birth for the foreign-born population - Zimbabwe (%)
Place of birth for the foreign-born population - Other Eastern Africa (%)
Place of birth for the foreign-born population - Cameroon (%)
Place of birth for the foreign-born population - Congo (%)
Place of birth for the foreign-born population - Democratic Republic of Congo (Zaire) (%)
Place of birth for the foreign-born population - Other Middle Africa (%)
Place of birth for the foreign-born population - Egypt (%)
Place of birth for the foreign-born population - Morocco (%)
Place of birth for the foreign-born population - Sudan (%)
Place of birth for the foreign-born population - Other Northern Africa (%)
Place of birth for the foreign-born population - South Africa (%)
Place of birth for the foreign-born population - Other Southern Africa (%)
Place of birth for the foreign-born population - Cabo Verde (%)
Place of birth for the foreign-born population - Ghana (%)
Place of birth for the foreign-born population - Liberia (%)
Place of birth for the foreign-born population - Nigeria (%)
Place of birth for the foreign-born population - Senegal (%)
Place of birth for the foreign-born population - Sierra Leone (%)
Place of birth for the foreign-born population - Other Western Africa (%)
Place of birth for the foreign-born population - Australia (%)
Place of birth for the foreign-born population - New Zealand (%)
Place of birth for the foreign-born population - Fiji (%)
Place of birth for the foreign-born population - Micronesia (%)
Place of birth for the foreign-born population - Bahamas (%)
Place of birth for the foreign-born population - Barbados (%)
Place of birth for the foreign-born population - Cuba (%)
Place of birth for the foreign-born population - Dominica (%)
Place of birth for the foreign-born population - Dominican Republic (%)
Place of birth for the foreign-born population - Grenada (%)
Place of birth for the foreign-born population - Haiti (%)
Place of birth for the foreign-born population - Jamaica (%)
Place of birth for the foreign-born population - St. Vincent and the Grenadines (%)
Place of birth for the foreign-born population - Trinidad and Tobago (%)
Place of birth for the foreign-born population - West Indies (%)
Place of birth for the foreign-born population - Other Caribbean (%)
Place of birth for the foreign-born population - Belize (%)
Place of birth for the foreign-born population - Costa Rica (%)
Place of birth for the foreign-born population - El Salvador (%)
Place of birth for the foreign-born population - Guatemala (%)
Place of birth for the foreign-born population - Honduras (%)
Place of birth for the foreign-born population - Mexico (%)
Place of birth for the foreign-born population - Nicaragua (%)
Place of birth for the foreign-born population - Panama (%)
Place of birth for the foreign-born population - Other Central America (%)
Place of birth for the foreign-born population - Argentina (%)
Place of birth for the foreign-born population - Bolivia (%)
Place of birth for the foreign-born population - Brazil (%)
Place of birth for the foreign-born population - Chile (%)
Place of birth for the foreign-born population - Colombia (%)
Place of birth for the foreign-born population - Ecuador (%)
Place of birth for the foreign-born population - Guyana (%)
Place of birth for the foreign-born population - Peru (%)
Place of birth for the foreign-born population - Uruguay (%)
Place of birth for the foreign-born population - Venezuela (%)
Place of birth for the foreign-born population - Other South America (%)
Place of birth for the foreign-born population - Canada (%)
Place of birth for the foreign-born population - Other Northern America (%)
Place of birth for the foreign-born population - Other (%)
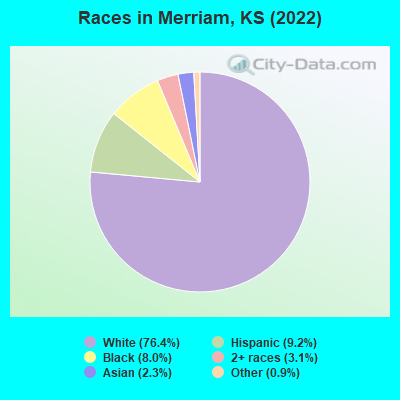
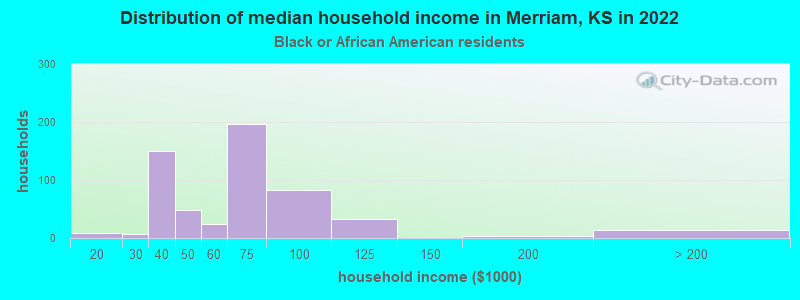
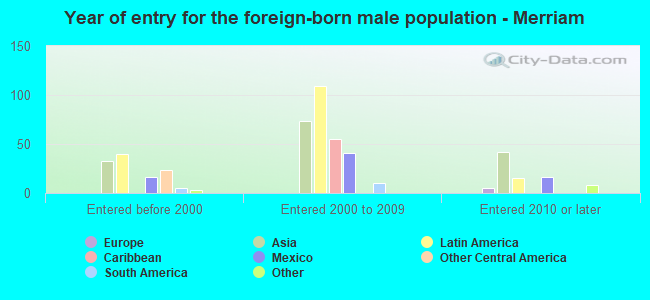
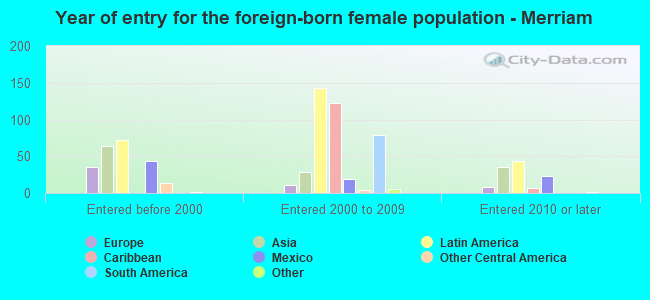
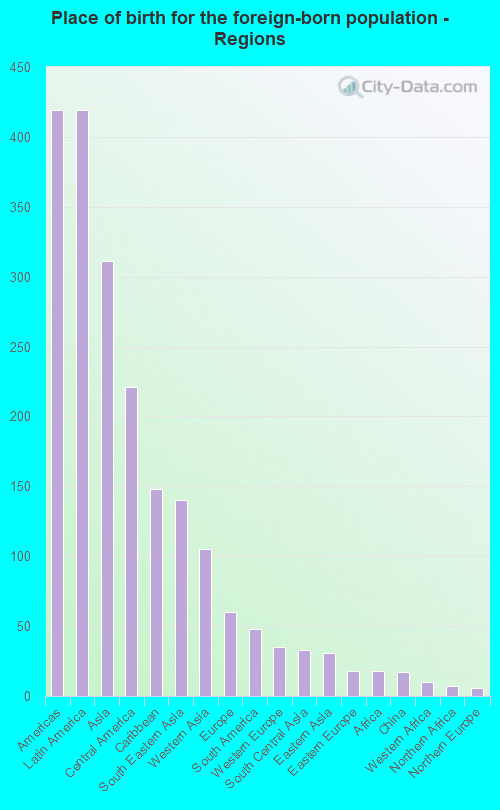
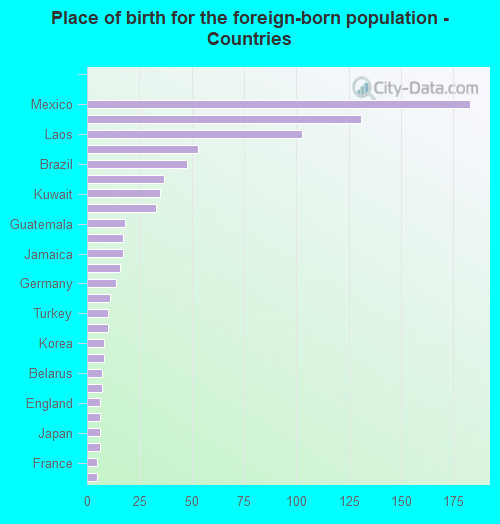
According to 2022 data, the most numerous races in Merriam, KS are White alone (8,569 residents), Hispanic (1,035 residents), and Black alone (903 residents). 91.4% of Merriam residents speak English at home. 7.2% of Merriam, KS residents are foreign-born (3.7% born in Latin America, 2.8% born in Asia), which is 2.9% greater than the foreign-born rate of 7.0% across the entire state of Kansas.
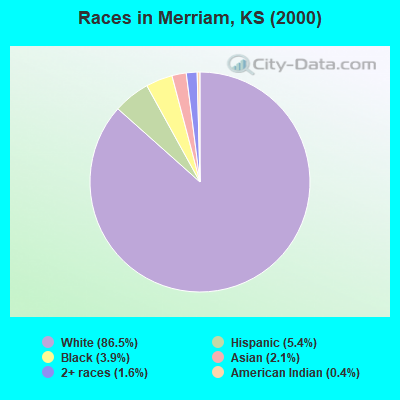
Race distribution in Merriam
2000 2022
2,233,997 83.1% White alone 188,252 7.0% Hispanic 151,407 5.6% Black alone 46,301 1.7% Asian alone 42,508 1.6% Two or more races 22,322 0.8% American Indian alone 2,477 0.09% Other race alone 1,154 0.04% Native Hawaiian and Other
2,147,943 73.1% White alone 381,746 13.0% Hispanic 147,666 5.0% Black alone 145,362 4.9% Two or more races 85,085 2.9% Asian alone 13,263 0.5% Other race alone 12,065 0.4% American Indian alone 4,020 0.1% Native Hawaiian and Other
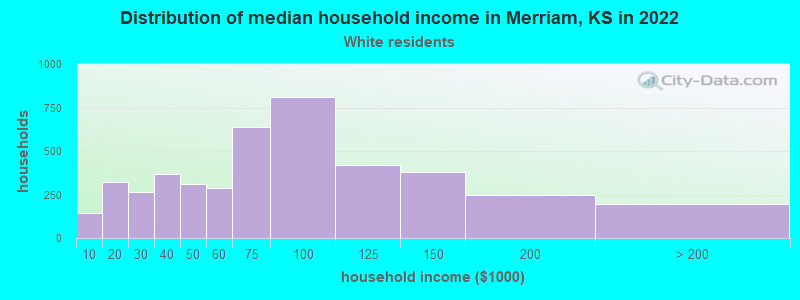
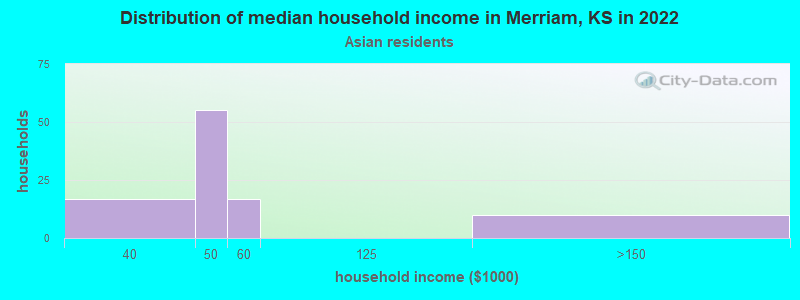
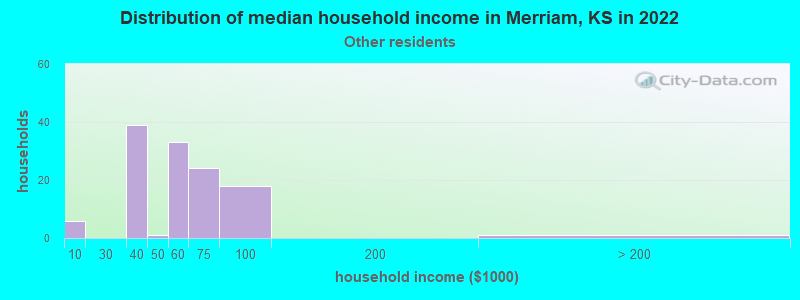
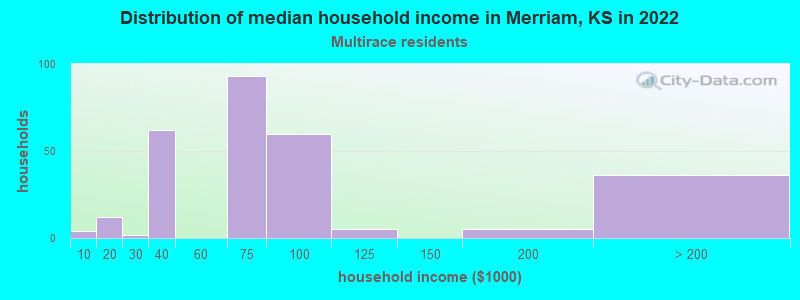
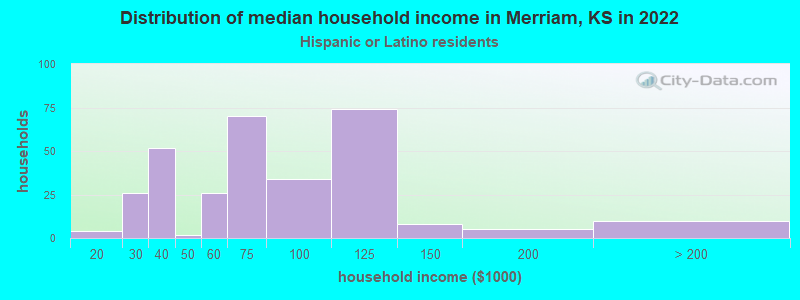
Income and house value in Merriam Median household income in 2022 $68,963 White non-Hispanic householders$65,863 Black householders$45,184 Asian householders$54,764 Some other race householders$63,480 Two or more races householders$66,477 Hispanic or Latino race householdersMedian 2022 house value $246,628 White Non-Hispanic householders$255,374 Black or African American householders$437,285 American Indian or Alaska Native householders $231,323 Asian householders$245,972 Some other race householders$210,552 Two or more races householders$249,252 Hispanic or Latino householders
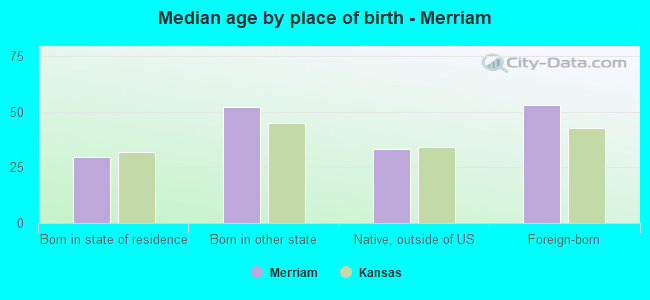
Median age by race in Merriam
38.4 Median age for White residents36.7 41.5 52.3 Median age for Black or African American residents51.9 56.2 26.6 Median age for American Indian / Alaska Native residents25.9 34.1 43.4 Median age for Asian residents47.9 42.6 -1,068,376,067.3 Median age for Native Hawaiian / Pacific Islander residents-669,240,668.6 -641,269,840.6 42.6 Median age for Other race residents38.0 45.4 33.8 Median age for Two or more races residents36.2 32.1 39.8 Median age for White alone residents37.8 43.1 30.9 Median age for Hispanic or Latino residents30.9 28.5
Owner/renter occupied households by race in Merriam
House owners and renters - White residents 2,625 61.2% Owner occupied1,663 38.8% Renter occupiedHouse owners and renters - Black or African American residents 208 42.1% Owner occupied286 57.9% Renter occupiedHouse owners and renters - American Indian / Alaska Native residents 9 100.0% Owner occupiedHouse owners and renters - Asian residents 97 100.0% Owner occupiedHouse owners and renters - Other race residents 69 43.7% Owner occupied89 56.3% Renter occupiedHouse owners and renters - Two or more races residents 110 38.1% Owner occupied178 61.9% Renter occupiedHouse owners and renters - White alone residents 2,538 60.4% Owner occupied1,661 39.6% Renter occupiedHouse owners and renters - Hispanic or Latino residents 173 57.8% Owner occupied126 42.2% Renter occupied
Language usage in Merriam
English speakers - Total 91.4% of residents of Merriam speak English at home.
3.6% of residents speak Spanish at home 295 76.2% Speak English very well92 23.8% Speak English less than very well5.5% of residents speak other language at home 253 42.9% Speak English very well337 57.1% Speak English less than very well
English speakers - Born in the United States 99.3% of residents of Merriam speak English at home.
0.6% of residents speak Spanish at home 19 76.0% Speak English very well6 24.0% Speak English less than very well0.1% of residents speak other language at home 6 100.0% Speak English very well
All residents speak only English at home
English speakers - Foreign-born 18.0% of residents of Merriam speak English at home.
28.8% of residents speak Spanish at home 152 67.9% Speak English very well72 32.1% Speak English less than very well60.9% of residents speak other language at home 127 26.8% Speak English very well346 73.2% Speak English less than very well
White (Caucasian) - Speak only English Native:
98.2% (8,302)Foreign-born:
45.7% (71)
White (Caucasian) - Speak another language Native:
1.9% (160)Foreign-born:
57.3% (89)
Black or African American - Speak only English Native:
91.9% (697)Foreign-born:
6.4% (10)
Black or African American - Speak another language Native:
8.2% (62)Foreign-born:
97.6% (150)
American Indian / Alaska Native - Speak another language Native:
100.0% (18)Foreign-born:
100.0% (112)
Asian - Speak only English Native:
83.2% (40)Foreign-born:
3.7% (7)
Asian - Speak another language Native:
22.7% (11)Foreign-born:
97.0% (189)
Other race - Speak only English Native:
87.0% (111)Foreign-born:
51.8% (65)
Other race - Speak another language Native:
19.6% (25)Foreign-born:
57.6% (72)
Two or more races - Speak only English Native:
95.3% (478)Foreign-born:
2.0% (2)
Two or more races - Speak another language Native:
3.5% (18)Foreign-born:
99.0% (88)
White alone - Speak only English Native:
98.9% (8,008)Foreign-born:
54.1% (72)
White alone - Speak another language Native:
1.1% (89)Foreign-born:
46.2% (62)
Hispanic or Latino - Speak only English Native:
85.0% (604)Foreign-born:
11.2% (31)
Hispanic or Latino - Speak another language Native:
18.6% (132)Foreign-born:
89.6% (246)
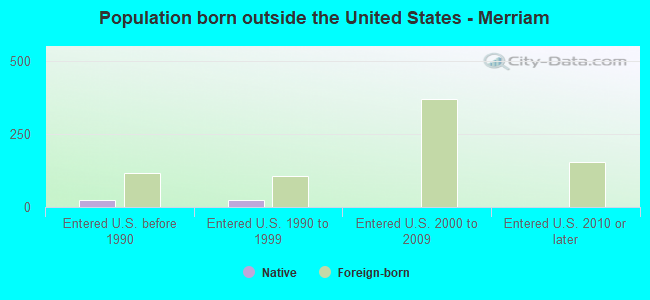
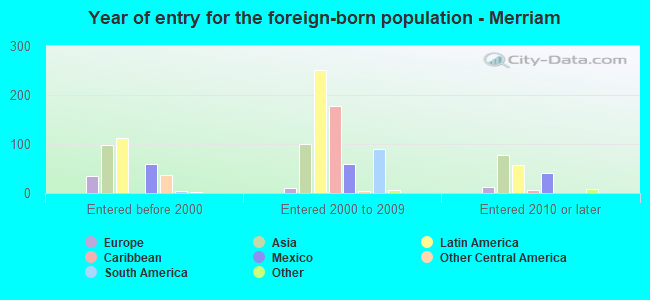
Foreign-born residents in Merriam 809 residents are foreign born (3.7% Latin America , 2.8% Asia ).
This city:
7.2%Kansas:
7.1%
Marital status for residents in Merriam Marital status - White (Caucasian) population 15 years and over
Males 40.5% Never married44.7% Now married0.5% Separated1.5% Widowed12.9% DivorcedFemales 30.0% Never married41.9% Now married2.9% Separated9.1% Widowed16.2% DivorcedWomen who gave birth in the past 12 months Now married:
63.4% (43)Unmarried:
36.6% (25)
Women who did not give birth in the past 12 months Now married:
38.6% (730)Unmarried:
61.4% (1,162)
Marital status - Black or African American population 15 years and over
Males 51.0% Never married44.7% Now married0.0% Separated0.0% Widowed4.3% DivorcedFemales 64.3% Never married29.9% Now married0.0% Separated0.0% Widowed5.8% DivorcedWomen who gave birth in the past 12 months Now married:
100.0% (5)Unmarried:
0.0% (0)
Women who did not give birth in the past 12 months Now married:
26.8% (60)Unmarried:
73.2% (164)
Marital status - American Indian / Alaska Native population 15 years and over
Males 66.7% Never married33.3% Now married0.0% Separated0.0% Widowed0.0% DivorcedFemales 0.0% Never married36.4% Now married0.0% Separated63.6% Widowed0.0% DivorcedWomen who did not give birth in the past 12 months Now married:
100.0% (9)Unmarried:
0.0% (0)
Marital status - Asian population 15 years and over
Males 19.8% Never married80.2% Now married0.0% Separated0.0% Widowed0.0% DivorcedFemales 29.5% Never married63.9% Now married0.0% Separated6.6% Widowed0.0% DivorcedWomen who did not give birth in the past 12 months Now married:
43.8% (28)Unmarried:
56.2% (36)
Marital status - Other race population 15 years and over
Males 54.9% Never married28.6% Now married0.0% Separated0.0% Widowed16.5% DivorcedFemales 45.5% Never married21.2% Now married0.0% Separated6.1% Widowed27.3% DivorcedWomen who did not give birth in the past 12 months Now married:
26.9% (31)Unmarried:
73.1% (85)
Marital status - Two or more races population 15 years and over
Males 47.9% Never married29.6% Now married15.4% Separated0.0% Widowed7.1% DivorcedFemales 45.4% Never married39.1% Now married0.0% Separated0.0% Widowed15.5% DivorcedWomen who gave birth in the past 12 months Now married:
0.0% (0)Unmarried:
100.0% (24)
Women who did not give birth in the past 12 months Now married:
8.7% (14)Unmarried:
91.3% (146)
Marital status - White alone, not Hispanic / Latino population 15 years and over
Males 39.5% Never married44.7% Now married0.5% Separated1.6% Widowed13.7% DivorcedFemales 28.1% Never married42.7% Now married3.0% Separated9.2% Widowed17.0% DivorcedWomen who gave birth in the past 12 months Now married:
76.3% (44)Unmarried:
23.7% (14)
Women who did not give birth in the past 12 months Now married:
39.9% (716)Unmarried:
60.1% (1,079)
Marital status - Hispanic or Latino population 15 years and over
Males 55.3% Never married39.6% Now married0.0% Separated0.0% Widowed5.2% DivorcedFemales 52.2% Never married37.2% Now married0.0% Separated7.4% Widowed3.2% DivorcedWomen who gave birth in the past 12 months Now married:
0.0% (0)Unmarried:
100.0% (13)
Women who did not give birth in the past 12 months Now married:
23.7% (70)Unmarried:
76.3% (225)
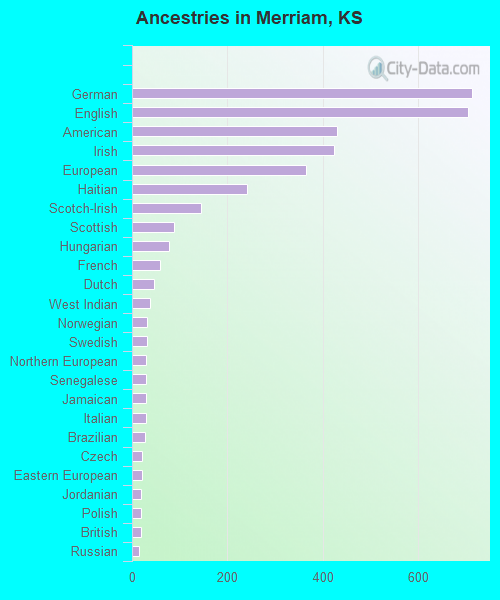
Ancestries in Merriam
713 12.5% German704 12.3% English429 7.5% American423 7.4% Irish365 6.4% European242 4.2% Haitian145 2.5% Scotch-Irish88 1.5% Scottish77 1.3% Hungarian58 1.0% French47 0.8% Dutch38 0.7% West Indian32 0.6% Norwegian32 0.6% Swedish29 0.5% Northern European29 0.5% Senegalese29 0.5% Jamaican29 0.5% Italian28 0.5% Brazilian22 0.4% Czech21 0.4% Eastern European19 0.3% Jordanian19 0.3% Polish18 0.3% British15 0.3% Russian12 0.2% Arab11 0.2% Swiss8 0.1% Armenian7 0.1% Turkish7 0.1% Welsh5 0.09% Austrian5 0.09% Croatian4 0.07% Luxembourger4 0.07% Sudanese
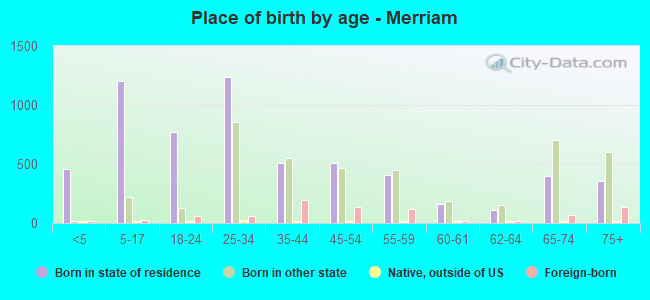
Children Nativity (place of birth) in Merriam
Children under 6 years - Living with two parents Both parents native 325 100.0% NativeBoth parents foreign-born 42 100.0% NativeOne native, one foreign-born parent 26 100.0% NativeChildren under 6 years - Living with one parent Native parent 126 100.0% NativeChildren 6 to 17 years - Living with two parents Both parents native 722 99.7% Native2 0.3% Foreign-bornBoth parents foreign-born 109 83.7% Native21 16.3% Foreign-bornOne native, one foreign-born parent 35 100.0% NativeChildren 6 to 17 years - Living with one parent Native parent 456 100.0% NativeForeign-born parent 32 55.0% Native26 45.0% Foreign-born
Grandparents responsible for own grandchildren in Merriam
Grandparents (30 to 59 years) White / Caucasian 12 100.0% Not responsible for grandchildrenWhite alone, not Hispanic / Latino 13 100.0% Not responsible for grandchildrenGrandparents (60 years and over) White / Caucasian 56 33.6% Responsible for grandchildren110 66.4% Not responsible for grandchildrenWhite alone, not Hispanic / Latino 56 31.9% Responsible for grandchildren119 68.1% Not responsible for grandchildren