Races in Merrick, New York (NY) Detailed Stats
Data:
Races - White alone (%)
Races - White alone (% change since 2000)
Races - Black alone (%)
Races - Black alone (% change since 2000)
Races - American Indian alone (%)
Races - American Indian alone (% change since 2000)
Races - Asian alone (%)
Races - Asian alone (% change since 2000)
Races - Hispanic (%)
Races - Hispanic (% change since 2000)
Races - Native Hawaiian and Other Pacific Islander alone (%)
Races - Native Hawaiian and Other Pacific Islander alone (% change since 2000)
Races - Two or more races(%)
Races - Two or more races(% change since 2000)
Races - Other race alone (%)
Races - Other race alone (% change since 2000)
Racial diversity
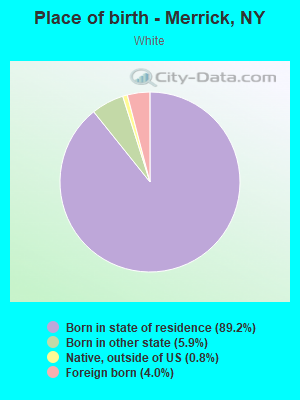
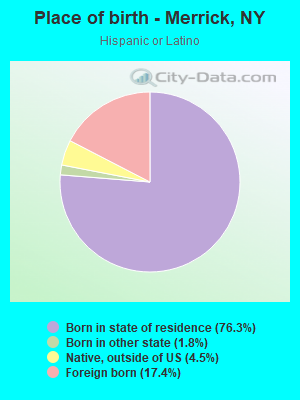
Place of birth - Born in state of residence (%)
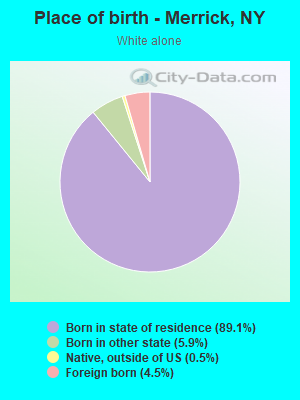
Place of birth - Born in state of residence (%) - White
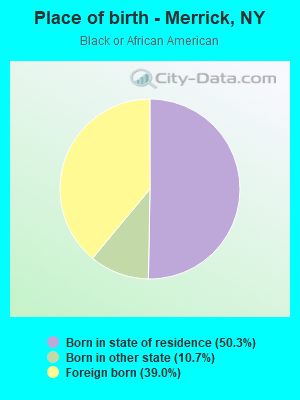
Place of birth - Born in state of residence (%) - Black or African American
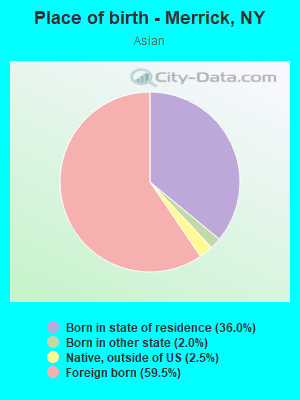
Place of birth - Born in state of residence (%) - Asian
Place of birth - Born in state of residence (%) - Hispanic or Latino
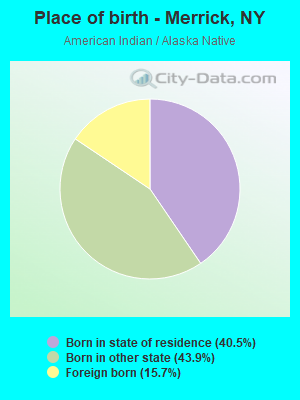
Place of birth - Born in state of residence (%) - American Indian and Alaska Native
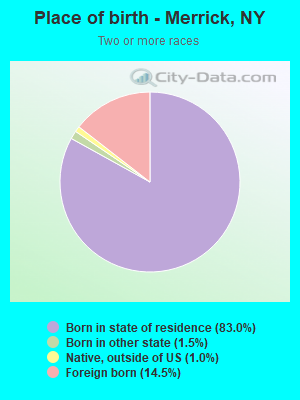
Place of birth - Born in state of residence (%) - Multirace
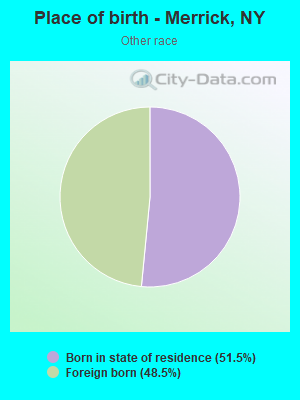
Place of birth - Born in state of residence (%) - Other Race
Place of birth - Born in other state (%)
Place of birth - Born in other state (%) - White
Place of birth - Born in other state (%) - Black or African American
Place of birth - Born in other state (%) - Asian
Place of birth - Born in other state (%) - Hispanic or Latino
Place of birth - Born in other state (%) - American Indian and Alaska Native
Place of birth - Born in other state (%) - Multirace
Place of birth - Born in other state (%) - Other Race
Place of birth - Native, outside of US (%)
Place of birth - Native, outside of US (%) - White
Place of birth - Native, outside of US (%) - Black or African American
Place of birth - Native, outside of US (%) - Asian
Place of birth - Native, outside of US (%) - Hispanic or Latino
Place of birth - Native, outside of US (%) - American Indian and Alaska Native
Place of birth - Native, outside of US (%) - Multirace
Place of birth - Native, outside of US (%) - Other Race
Place of birth - Foreign born (%)
Place of birth - Foreign born (%) - White
Place of birth - Foreign born (%) - Black or African American
Place of birth - Foreign born (%) - Asian
Place of birth - Foreign born (%) - Hispanic or Latino
Place of birth - Foreign born (%) - American Indian and Alaska Native
Place of birth - Foreign born (%) - Multirace
Place of birth - Foreign born (%) - Other Race
Residents speaking English at home (%)
Residents speaking English at home - Born in the United States (%)
Residents speaking English at home - Native, born elsewhere (%)
Residents speaking English at home - Foreign born (%)
Residents speaking Spanish at home (%)
Residents speaking Spanish at home - Born in the United States (%)
Residents speaking Spanish at home - Native, born elsewhere (%)
Residents speaking Spanish at home - Foreign born (%)
Residents speaking other language at home (%)
Residents speaking other language at home - Born in the United States (%)
Residents speaking other language at home - Native, born elsewhere (%)
Residents speaking other language at home - Foreign born (%)
Marital status - Never married (%)
Marital status - Now married (%)
Marital status - Separated (%)
Marital status - Widowed (%)
Marital status - Divorced (%)
Ancestries Reported - Arab (%)
Ancestries Reported - Czech (%)
Ancestries Reported - Danish (%)
Ancestries Reported - Dutch (%)
Ancestries Reported - English (%)
Ancestries Reported - French (%)
Ancestries Reported - French Canadian (%)
Ancestries Reported - German (%)
Ancestries Reported - Greek (%)
Ancestries Reported - Hungarian (%)
Ancestries Reported - Irish (%)
Ancestries Reported - Italian (%)
Ancestries Reported - Lithuanian (%)
Ancestries Reported - Norwegian (%)
Ancestries Reported - Polish (%)
Ancestries Reported - Portuguese (%)
Ancestries Reported - Russian (%)
Ancestries Reported - Scotch-Irish (%)
Ancestries Reported - Scottish (%)
Ancestries Reported - Slovak (%)
Ancestries Reported - Subsaharan African (%)
Ancestries Reported - Swedish (%)
Ancestries Reported - Swiss (%)
Ancestries Reported - Ukrainian (%)
Ancestries Reported - United States (%)
Ancestries Reported - Welsh (%)
Ancestries Reported - West Indian (%)
Ancestries Reported - Other (%)
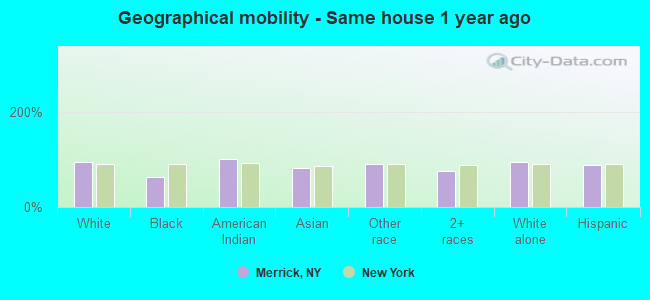
Geographical mobility - Same house 1 year ago (%)
Geographical mobility - Same house 1 year ago (%) - White
Geographical mobility - Same house 1 year ago (%) - Black or African American
Geographical mobility - Same house 1 year ago (%) - Asian
Geographical mobility - Same house 1 year ago (%) - Hispanic or Latino
Geographical mobility - Same house 1 year ago (%) - American Indian and Alaska Native
Geographical mobility - Same house 1 year ago (%) - Multirace
Geographical mobility - Same house 1 year ago (%) - Other Race
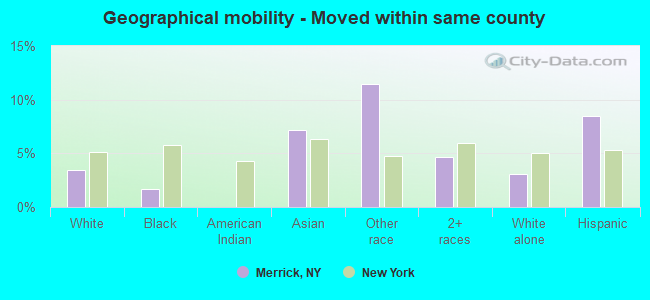
Geographical mobility - Moved within same county (%)
Geographical mobility - Moved within same county (%) - White
Geographical mobility - Moved within same county (%) - Black or African American
Geographical mobility - Moved within same county (%) - Asian
Geographical mobility - Moved within same county (%) - Hispanic or Latino
Geographical mobility - Moved within same county (%) - American Indian and Alaska Native
Geographical mobility - Moved within same county (%) - Multirace
Geographical mobility - Moved within same county (%) - Other Race
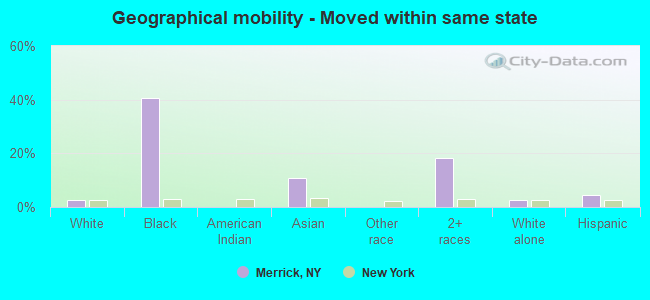
Geographical mobility - Moved from different county within same state (%)
Geographical mobility - Moved from different county within same state (%) - White
Geographical mobility - Moved from different county within same state (%) - Black or African American
Geographical mobility - Moved from different county within same state (%) - Asian
Geographical mobility - Moved from different county within same state (%) - Hispanic or Latino
Geographical mobility - Moved from different county within same state (%) - American Indian and Alaska Native
Geographical mobility - Moved from different county within same state (%) - Multirace
Geographical mobility - Moved from different county within same state (%) - Other Race
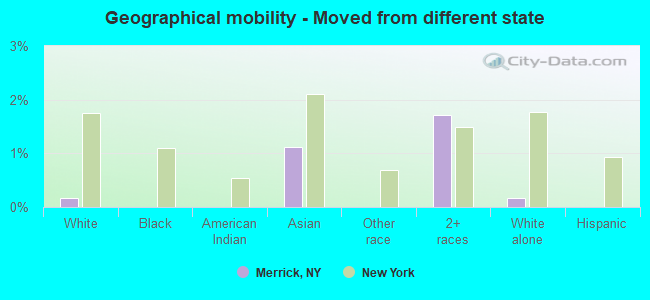
Geographical mobility - Moved from different state (%)
Geographical mobility - Moved from different state (%) - White
Geographical mobility - Moved from different state (%) - Black or African American
Geographical mobility - Moved from different state (%) - Asian
Geographical mobility - Moved from different state (%) - Hispanic or Latino
Geographical mobility - Moved from different state (%) - American Indian and Alaska Native
Geographical mobility - Moved from different state (%) - Multirace
Geographical mobility - Moved from different state (%) - Other Race
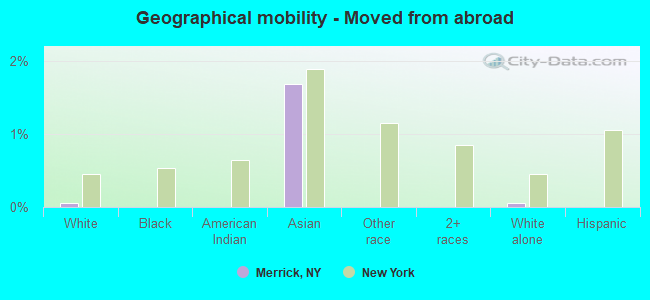
Geographical mobility - Moved from abroad (%)
Geographical mobility - Moved from abroad (%) - White
Geographical mobility - Moved from abroad (%) - Black or African American
Geographical mobility - Moved from abroad (%) - Asian
Geographical mobility - Moved from abroad (%) - Hispanic or Latino
Geographical mobility - Moved from abroad (%) - American Indian and Alaska Native
Geographical mobility - Moved from abroad (%) - Multirace
Geographical mobility - Moved from abroad (%) - Other Race
Place of birth for the foreign-born population - Ireland (%)
Place of birth for the foreign-born population - Denmark (%)
Place of birth for the foreign-born population - Norway (%)
Place of birth for the foreign-born population - Sweden (%)
Place of birth for the foreign-born population - United Kingdom (%)
Place of birth for the foreign-born population - England (%)
Place of birth for the foreign-born population - Scotland (%)
Place of birth for the foreign-born population - Other Northern Europe (%)
Place of birth for the foreign-born population - Austria (%)
Place of birth for the foreign-born population - Belgium (%)
Place of birth for the foreign-born population - France (%)
Place of birth for the foreign-born population - Germany (%)
Place of birth for the foreign-born population - Netherlands (%)
Place of birth for the foreign-born population - Switzerland (%)
Place of birth for the foreign-born population - Other Western Europe (%)
Place of birth for the foreign-born population - Greece (%)
Place of birth for the foreign-born population - Italy (%)
Place of birth for the foreign-born population - Portugal (%)
Place of birth for the foreign-born population - Spain (%)
Place of birth for the foreign-born population - Other Southern Europe (%)
Place of birth for the foreign-born population - Albania (%)
Place of birth for the foreign-born population - Belarus (%)
Place of birth for the foreign-born population - Bosnia and Herzegovina (%)
Place of birth for the foreign-born population - Bulgaria (%)
Place of birth for the foreign-born population - Croatia (%)
Place of birth for the foreign-born population - Czechoslovakia (%)
Place of birth for the foreign-born population - Hungary (%)
Place of birth for the foreign-born population - Latvia (%)
Place of birth for the foreign-born population - Lithuania (%)
Place of birth for the foreign-born population - North Macedonia (Macedonia) (%)
Place of birth for the foreign-born population - Moldova (%)
Place of birth for the foreign-born population - Poland (%)
Place of birth for the foreign-born population - Romania (%)
Place of birth for the foreign-born population - Russia (%)
Place of birth for the foreign-born population - Serbia (%)
Place of birth for the foreign-born population - Ukraine (%)
Place of birth for the foreign-born population - Other Eastern Europe (%)
Place of birth for the foreign-born population - China (%)
Place of birth for the foreign-born population - Hong Kong (%)
Place of birth for the foreign-born population - Taiwan (%)
Place of birth for the foreign-born population - Japan (%)
Place of birth for the foreign-born population - Korea (%)
Place of birth for the foreign-born population - Other Eastern Asia (%)
Place of birth for the foreign-born population - Afghanistan (%)
Place of birth for the foreign-born population - Bangladesh (%)
Place of birth for the foreign-born population - India (%)
Place of birth for the foreign-born population - Iran (%)
Place of birth for the foreign-born population - Kazakhstan (%)
Place of birth for the foreign-born population - Nepal (%)
Place of birth for the foreign-born population - Pakistan (%)
Place of birth for the foreign-born population - Sri Lanka (%)
Place of birth for the foreign-born population - Uzbekistan (%)
Place of birth for the foreign-born population - Other South Central Asia (%)
Place of birth for the foreign-born population - Burma (%)
Place of birth for the foreign-born population - Cambodia (%)
Place of birth for the foreign-born population - Indonesia (%)
Place of birth for the foreign-born population - Laos (%)
Place of birth for the foreign-born population - Malaysia (%)
Place of birth for the foreign-born population - Philippines (%)
Place of birth for the foreign-born population - Singapore (%)
Place of birth for the foreign-born population - Thailand (%)
Place of birth for the foreign-born population - Vietnam (%)
Place of birth for the foreign-born population - Other South Eastern Asia (%)
Place of birth for the foreign-born population - Armenia (%)
Place of birth for the foreign-born population - Iraq (%)
Place of birth for the foreign-born population - Israel (%)
Place of birth for the foreign-born population - Jordan (%)
Place of birth for the foreign-born population - Kuwait (%)
Place of birth for the foreign-born population - Lebanon (%)
Place of birth for the foreign-born population - Saudi Arabia (%)
Place of birth for the foreign-born population - Syria (%)
Place of birth for the foreign-born population - Turkey (%)
Place of birth for the foreign-born population - Yemen (%)
Place of birth for the foreign-born population - Other Western Asia (%)
Place of birth for the foreign-born population - Eritrea (%)
Place of birth for the foreign-born population - Ethiopia (%)
Place of birth for the foreign-born population - Kenya (%)
Place of birth for the foreign-born population - Somalia (%)
Place of birth for the foreign-born population - Uganda (%)
Place of birth for the foreign-born population - Zimbabwe (%)
Place of birth for the foreign-born population - Other Eastern Africa (%)
Place of birth for the foreign-born population - Cameroon (%)
Place of birth for the foreign-born population - Congo (%)
Place of birth for the foreign-born population - Democratic Republic of Congo (Zaire) (%)
Place of birth for the foreign-born population - Other Middle Africa (%)
Place of birth for the foreign-born population - Egypt (%)
Place of birth for the foreign-born population - Morocco (%)
Place of birth for the foreign-born population - Sudan (%)
Place of birth for the foreign-born population - Other Northern Africa (%)
Place of birth for the foreign-born population - South Africa (%)
Place of birth for the foreign-born population - Other Southern Africa (%)
Place of birth for the foreign-born population - Cabo Verde (%)
Place of birth for the foreign-born population - Ghana (%)
Place of birth for the foreign-born population - Liberia (%)
Place of birth for the foreign-born population - Nigeria (%)
Place of birth for the foreign-born population - Senegal (%)
Place of birth for the foreign-born population - Sierra Leone (%)
Place of birth for the foreign-born population - Other Western Africa (%)
Place of birth for the foreign-born population - Australia (%)
Place of birth for the foreign-born population - New Zealand (%)
Place of birth for the foreign-born population - Fiji (%)
Place of birth for the foreign-born population - Micronesia (%)
Place of birth for the foreign-born population - Bahamas (%)
Place of birth for the foreign-born population - Barbados (%)
Place of birth for the foreign-born population - Cuba (%)
Place of birth for the foreign-born population - Dominica (%)
Place of birth for the foreign-born population - Dominican Republic (%)
Place of birth for the foreign-born population - Grenada (%)
Place of birth for the foreign-born population - Haiti (%)
Place of birth for the foreign-born population - Jamaica (%)
Place of birth for the foreign-born population - St. Vincent and the Grenadines (%)
Place of birth for the foreign-born population - Trinidad and Tobago (%)
Place of birth for the foreign-born population - West Indies (%)
Place of birth for the foreign-born population - Other Caribbean (%)
Place of birth for the foreign-born population - Belize (%)
Place of birth for the foreign-born population - Costa Rica (%)
Place of birth for the foreign-born population - El Salvador (%)
Place of birth for the foreign-born population - Guatemala (%)
Place of birth for the foreign-born population - Honduras (%)
Place of birth for the foreign-born population - Mexico (%)
Place of birth for the foreign-born population - Nicaragua (%)
Place of birth for the foreign-born population - Panama (%)
Place of birth for the foreign-born population - Other Central America (%)
Place of birth for the foreign-born population - Argentina (%)
Place of birth for the foreign-born population - Bolivia (%)
Place of birth for the foreign-born population - Brazil (%)
Place of birth for the foreign-born population - Chile (%)
Place of birth for the foreign-born population - Colombia (%)
Place of birth for the foreign-born population - Ecuador (%)
Place of birth for the foreign-born population - Guyana (%)
Place of birth for the foreign-born population - Peru (%)
Place of birth for the foreign-born population - Uruguay (%)
Place of birth for the foreign-born population - Venezuela (%)
Place of birth for the foreign-born population - Other South America (%)
Place of birth for the foreign-born population - Canada (%)
Place of birth for the foreign-born population - Other Northern America (%)
Place of birth for the foreign-born population - Other (%)
Latest news about races in Merrick, NY collected exclusively by city-data.com from local newspapers, TV, and radio stations
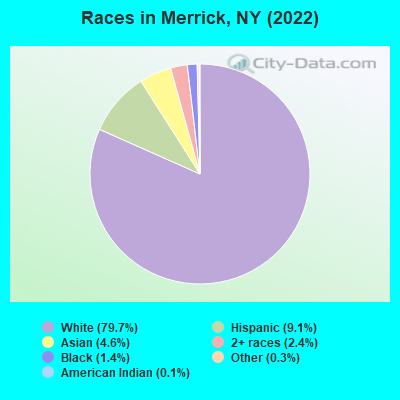
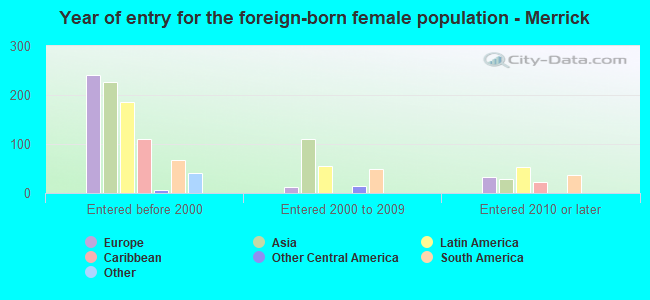
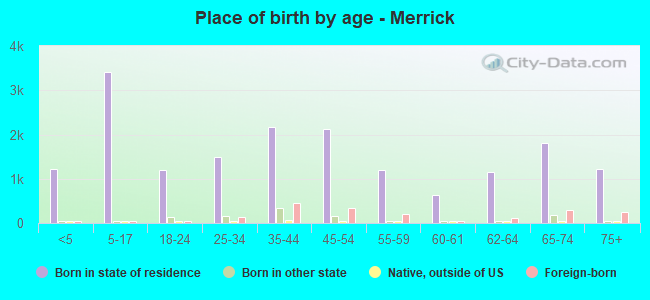
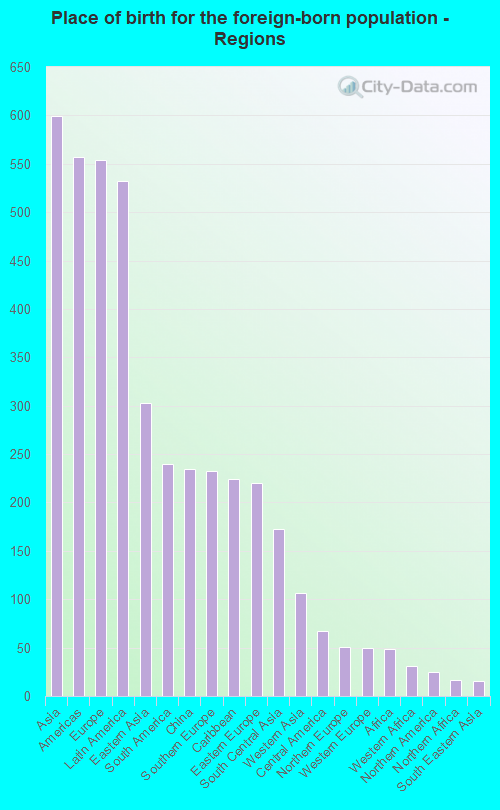
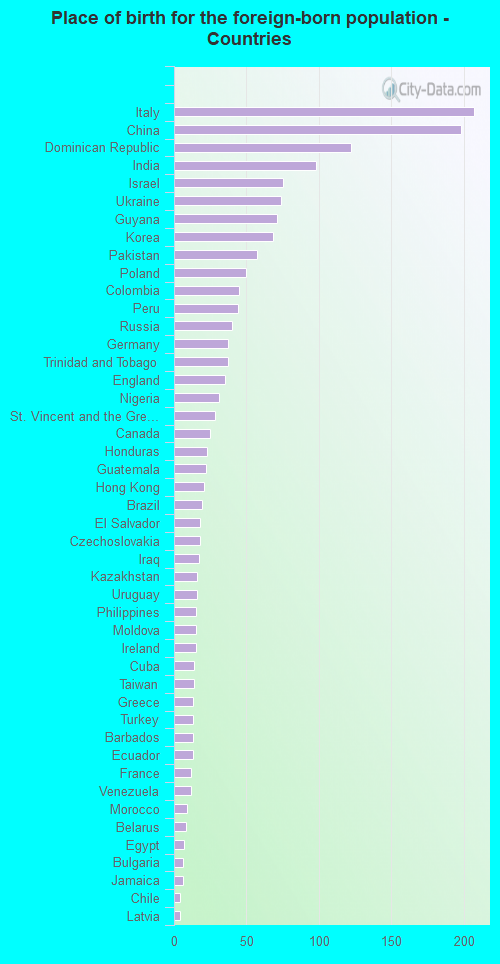
According to 2022 data, the most numerous races in Merrick, NY are White alone (16,672 residents), Hispanic (1,906 residents), and Black alone (291 residents). 87.9% of Merrick residents speak English at home. 8.4% of Merrick, NY residents are foreign-born (2.9% born in Asia, 2.7% born in Europe, 2.6% born in Latin America), which is 161.4% less than the foreign-born rate of 22.0% across the entire state of New York.
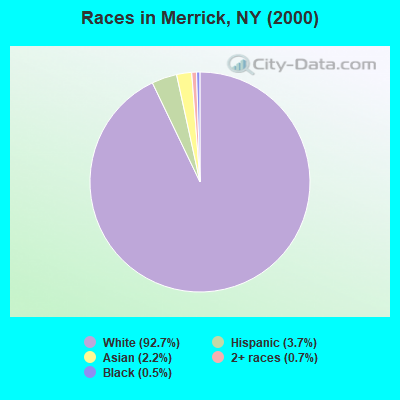
Race distribution in Merrick
2000 2022
11,760,981 62.0% White alone 2,867,583 15.1% Hispanic 2,812,623 14.8% Black alone 1,035,926 5.5% Asian alone 366,116 1.9% Two or more races 75,499 0.4% Other race alone 52,499 0.3% American Indian alone 5,230 0.03% Native Hawaiian and Other
10,408,933 52.9% White alone 3,867,299 19.7% Hispanic 2,633,840 13.4% Black alone 1,776,286 9.0% Asian alone 732,670 3.7% Two or more races 216,110 1.1% Other race alone 35,082 0.2% American Indian alone 6,931 0.04% Native Hawaiian and Other
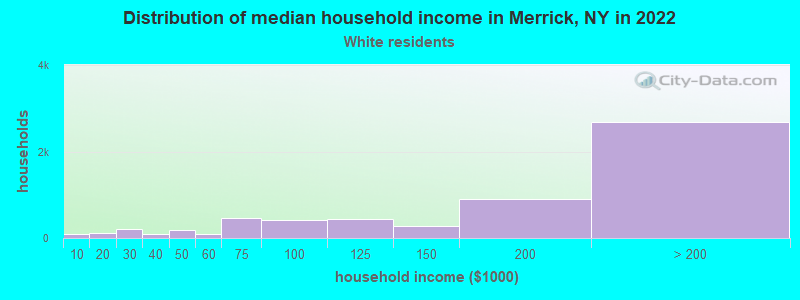
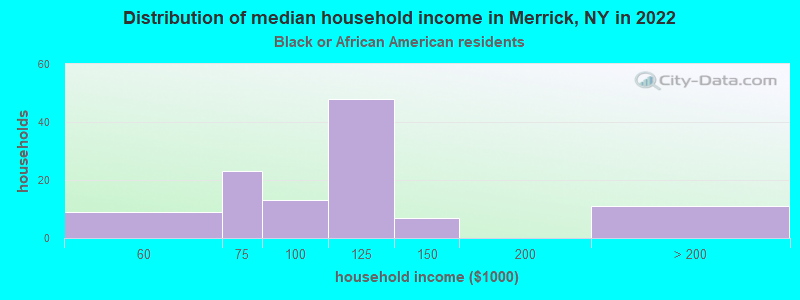
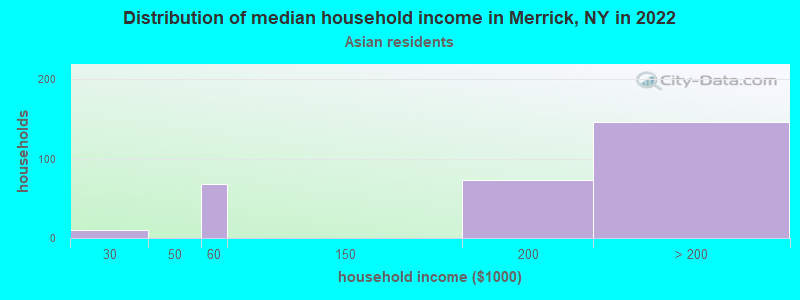
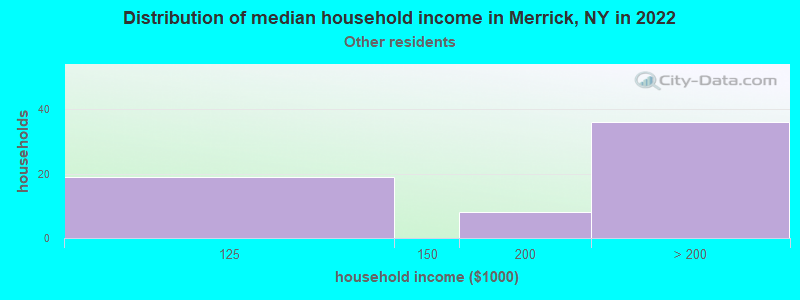
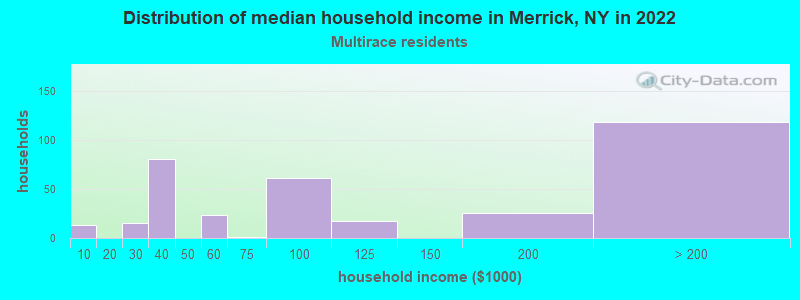
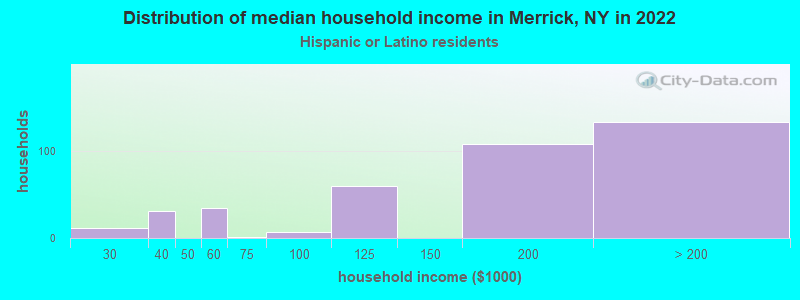
Income and house value in Merrick Median household income in 2022 $179,616 White non-Hispanic householders$129,333 Black householders$188,863 Asian householdersover $200,000 Some other race householders$197,112 Hispanic or Latino race householdersMedian 2022 house value $717,054 White Non-Hispanic householders$615,814 Black or African American householders$554,233 American Indian or Alaska Native householders $565,564 Asian householders$572,954 Some other race householders$486,493 Two or more races householders$652,024 Hispanic or Latino householders
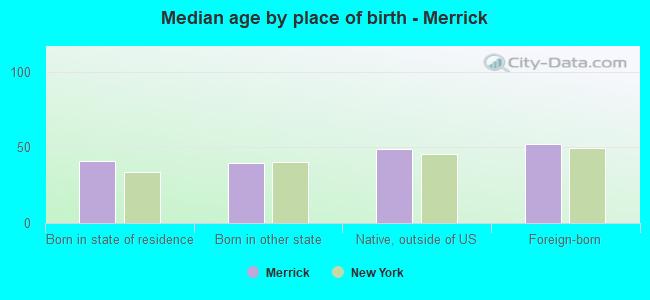
Median age by race in Merrick
46.3 Median age for White residents43.1 49.1 48.1 Median age for Black or African American residents28.9 68.1 84.3 Median age for American Indian / Alaska Native residents40.4 82.7 36.8 Median age for Asian residents37.7 36.1 -487,992,314.6 Median age for Native Hawaiian / Pacific Islander residents-477,502,295.2 -497,387,669.3 42.6 Median age for Other race residents38.8 53.6 33.3 Median age for Two or more races residents34.8 28.3 46.4 Median age for White alone residents42.6 48.9 37.0 Median age for Hispanic or Latino residents34.6 37.9
Owner/renter occupied households by race in Merrick
House owners and renters - White residents 5,714 95.4% Owner occupied274 4.6% Renter occupiedHouse owners and renters - Black or African American residents 115 100.0% Owner occupiedHouse owners and renters - American Indian / Alaska Native residents 17 100.0% Owner occupiedHouse owners and renters - Asian residents 290 100.0% Owner occupiedHouse owners and renters - Other race residents 53 87.4% Owner occupied8 12.6% Renter occupiedHouse owners and renters - Two or more races residents 291 85.6% Owner occupied49 14.4% Renter occupiedHouse owners and renters - White alone residents 5,729 95.9% Owner occupied242 4.1% Renter occupiedHouse owners and renters - Hispanic or Latino residents 325 81.9% Owner occupied72 18.1% Renter occupied
Language usage in Merrick
English speakers - Total 87.9% of residents of Merrick speak English at home.
3.6% of residents speak Spanish at home 547 77.8% Speak English very well156 22.2% Speak English less than very well7.8% of residents speak other language at home 1,052 68.4% Speak English very well486 31.6% Speak English less than very well
English speakers - Born in the United States 91.7% of residents of Merrick speak English at home.
5.3% of residents speak Spanish at home 59 100.0% Speak English very well3.1% of residents speak other language at home 34 100.0% Speak English very well
English speakers - Native, born elsewhere 57.4% of residents of Merrick speak English at home.
33.2% of residents speak Spanish at home 67 100.0% Speak English very well5.4% of residents speak other language at home 11 100.0% Speak English very well
English speakers - Foreign-born 29.5% of residents of Merrick speak English at home.
12.8% of residents speak Spanish at home 98 42.1% Speak English very well135 57.9% Speak English less than very well58.5% of residents speak other language at home 623 58.6% Speak English very well441 41.4% Speak English less than very well
White (Caucasian) - Speak only English Native:
97.9% (15,103)Foreign-born:
33.5% (230)
White (Caucasian) - Speak another language Native:
3.1% (477)Foreign-born:
67.4% (462)
Black or African American - Speak only English Native:
80.3% (128)Foreign-born:
66.8% (78)
Black or African American - Speak another language Native:
20.5% (33)Foreign-born:
33.0% (38)
American Indian / Alaska Native - Speak another language Native:
6.2% (2)Foreign-born:
100.0% (6)
Asian - Speak only English Native:
74.5% (232)Foreign-born:
19.1% (109)
Asian - Speak another language Native:
27.2% (85)Foreign-born:
79.0% (450)
Other race - Speak only English Native:
61.5% (49)Foreign-born:
6.5% (6)
Other race - Speak another language Native:
41.9% (33)Foreign-born:
93.7% (85)
Two or more races - Speak only English Native:
76.5% (986)Foreign-born:
52.2% (129)
Two or more races - Speak another language Native:
20.9% (270)Foreign-born:
42.6% (106)
White alone - Speak only English Native:
97.3% (14,641)Foreign-born:
26.7% (199)
White alone - Speak another language Native:
3.0% (451)Foreign-born:
73.4% (546)
Hispanic or Latino - Speak only English Native:
74.9% (1,091)Foreign-born:
25.9% (87)
Hispanic or Latino - Speak another language Native:
24.4% (355)Foreign-born:
74.1% (249)
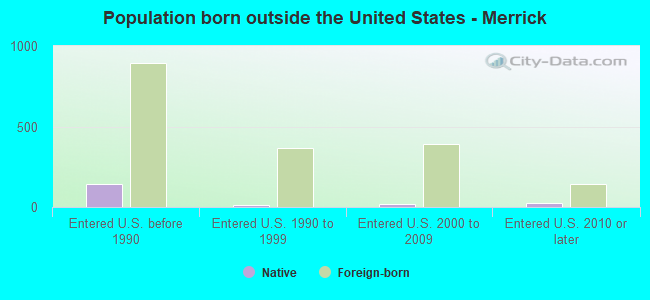
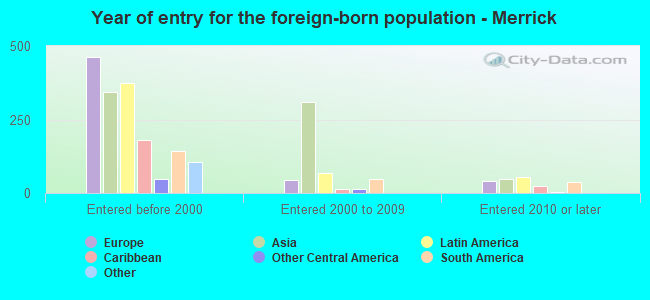
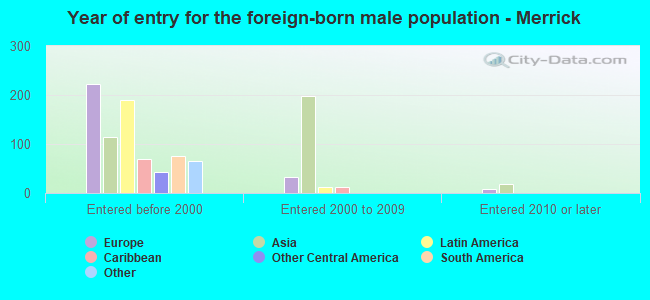
Foreign-born residents in Merrick 1,761 residents are foreign born (2.9% Asia , 2.7% Europe , 2.6% Latin America ).
This city:
8.4%New York:
22.6%
Marital status for residents in Merrick Marital status - White (Caucasian) population 15 years and over
Males 25.3% Never married67.9% Now married0.0% Separated1.6% Widowed5.1% DivorcedFemales 20.6% Never married64.3% Now married1.7% Separated5.7% Widowed7.8% DivorcedWomen who gave birth in the past 12 months Now married:
94.8% (212)Unmarried:
5.2% (12)
Women who did not give birth in the past 12 months Now married:
53.7% (1,633)Unmarried:
46.3% (1,406)
Marital status - Black or African American population 15 years and over
Males 63.7% Never married36.3% Now married0.0% Separated0.0% Widowed0.0% DivorcedFemales 36.8% Never married23.9% Now married0.0% Separated34.4% Widowed4.9% DivorcedWomen who did not give birth in the past 12 months Now married:
21.9% (13)Unmarried:
78.1% (47)
Marital status - American Indian / Alaska Native population 15 years and over
Males 47.1% Never married52.9% Now married0.0% Separated0.0% Widowed0.0% DivorcedFemales 0.0% Never married76.2% Now married23.8% Separated0.0% Widowed0.0% DivorcedWomen who did not give birth in the past 12 months Now married:
100.0% (7)Unmarried:
0.0% (0)
Marital status - Asian population 15 years and over
Males 25.4% Never married70.4% Now married0.0% Separated4.3% Widowed0.0% DivorcedFemales 6.9% Never married83.0% Now married0.0% Separated3.5% Widowed6.6% DivorcedWomen who gave birth in the past 12 months Now married:
100.0% (44)Unmarried:
0.0% (0)
Women who did not give birth in the past 12 months Now married:
87.5% (170)Unmarried:
12.5% (24)
Marital status - Other race population 15 years and over
Males 25.6% Never married66.7% Now married0.0% Separated0.0% Widowed7.8% DivorcedFemales 11.9% Never married88.1% Now married0.0% Separated0.0% Widowed0.0% DivorcedWomen who did not give birth in the past 12 months Now married:
69.6% (18)Unmarried:
30.4% (8)
Marital status - Two or more races population 15 years and over
Males 37.9% Never married58.1% Now married0.0% Separated0.0% Widowed4.0% DivorcedFemales 29.6% Never married54.2% Now married4.2% Separated0.2% Widowed11.8% DivorcedWomen who gave birth in the past 12 months Now married:
72.9% (65)Unmarried:
27.1% (24)
Women who did not give birth in the past 12 months Now married:
58.2% (193)Unmarried:
41.8% (139)
Marital status - White alone, not Hispanic / Latino population 15 years and over
Males 25.5% Never married67.6% Now married0.0% Separated1.6% Widowed5.3% DivorcedFemales 20.9% Never married63.5% Now married1.6% Separated5.9% Widowed8.1% DivorcedWomen who gave birth in the past 12 months Now married:
94.4% (209)Unmarried:
5.6% (12)
Women who did not give birth in the past 12 months Now married:
52.0% (1,580)Unmarried:
48.0% (1,461)
Marital status - Hispanic or Latino population 15 years and over
Males 34.9% Never married63.9% Now married0.0% Separated0.0% Widowed1.3% DivorcedFemales 22.0% Never married66.0% Now married4.6% Separated2.6% Widowed4.8% DivorcedWomen who gave birth in the past 12 months Now married:
100.0% (47)Unmarried:
0.0% (0)
Women who did not give birth in the past 12 months Now married:
65.1% (220)Unmarried:
34.9% (118)
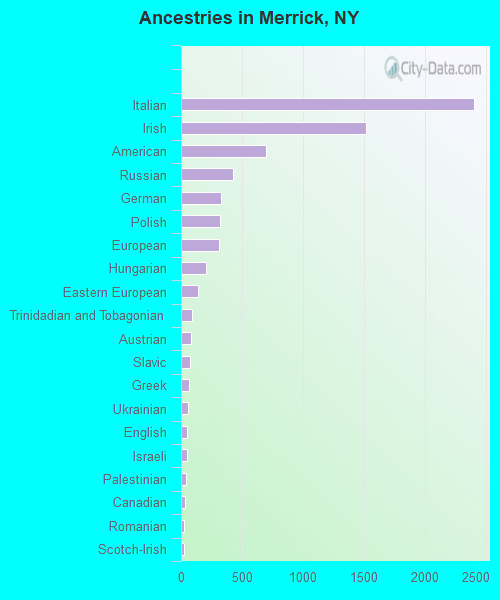
Ancestries in Merrick
2,408 24.9% Italian1,518 15.7% Irish697 7.2% American427 4.4% Russian329 3.4% German319 3.3% Polish310 3.2% European202 2.1% Hungarian137 1.4% Eastern European89 0.9% Trinidadian and Tobagonian82 0.8% Austrian70 0.7% Slavic66 0.7% Greek58 0.6% Ukrainian50 0.5% English47 0.5% Israeli37 0.4% Palestinian33 0.3% Canadian25 0.3% Romanian24 0.2% Scotch-Irish21 0.2% Guyanese17 0.2% Scottish12 0.1% Bulgarian12 0.1% Scandinavian12 0.1% Turkish10 0.1% Maltese10 0.1% Portuguese10 0.1% Liberian9 0.09% Iranian9 0.09% African6 0.06% British5 0.05% Latvian4 0.04% Egyptian3 0.03% Northern European1 0.01% Moroccan
Children Nativity (place of birth) in Merrick
Children under 6 years - Living with two parents Both parents native 1,391 100.0% NativeBoth parents foreign-born 85 100.0% NativeOne native, one foreign-born parent 28 100.0% NativeChildren under 6 years - Living with one parent Native parent 65 100.0% NativeForeign-born parent 66 80.2% Native16 19.8% Foreign-bornChildren 6 to 17 years - Living with two parents Both parents native 2,072 99.5% Native11 0.5% Foreign-bornBoth parents foreign-born 236 100.0% NativeOne native, one foreign-born parent 186 100.0% NativeChildren 6 to 17 years - Living with one parent Native parent 458 100.0% NativeForeign-born parent 30 51.8% Native28 48.2% Foreign-born
Grandparents responsible for own grandchildren in Merrick
Grandparents (30 to 59 years) White / Caucasian 9 32.7% Responsible for grandchildren19 67.3% Not responsible for grandchildrenBlack or African American 13 100.0% Not responsible for grandchildrenTwo or more races 13 100.0% Responsible for grandchildrenWhite alone, not Hispanic / Latino 10 100.0% Responsible for grandchildrenHispanic or Latino 13 35.9% Responsible for grandchildren23 64.1% Not responsible for grandchildrenGrandparents (60 years and over) White / Caucasian 10 5.1% Responsible for grandchildren183 94.9% Not responsible for grandchildrenBlack or African American 43 100.0% Not responsible for grandchildrenTwo or more races 29 100.0% Not responsible for grandchildrenWhite alone, not Hispanic / Latino 9 5.3% Responsible for grandchildren168 94.7% Not responsible for grandchildrenHispanic or Latino 39 100.0% Not responsible for grandchildren