Races in Merrifield, Virginia (VA) Detailed Stats
Data:
Races - White alone (%)
Races - White alone (% change since 2000)
Races - Black alone (%)
Races - Black alone (% change since 2000)
Races - American Indian alone (%)
Races - American Indian alone (% change since 2000)
Races - Asian alone (%)
Races - Asian alone (% change since 2000)
Races - Hispanic (%)
Races - Hispanic (% change since 2000)
Races - Native Hawaiian and Other Pacific Islander alone (%)
Races - Native Hawaiian and Other Pacific Islander alone (% change since 2000)
Races - Two or more races(%)
Races - Two or more races(% change since 2000)
Races - Other race alone (%)
Races - Other race alone (% change since 2000)
Racial diversity
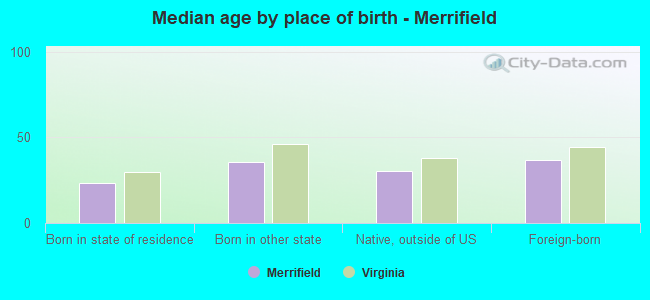
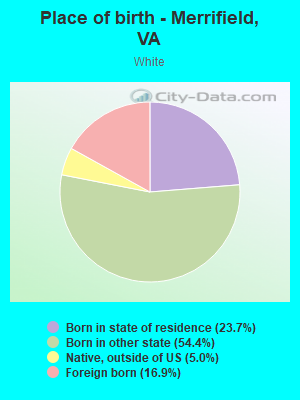
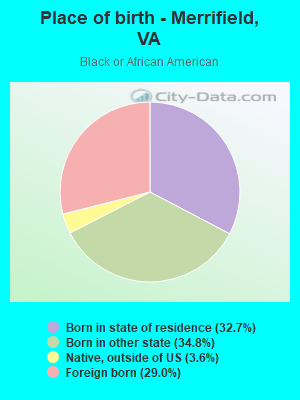
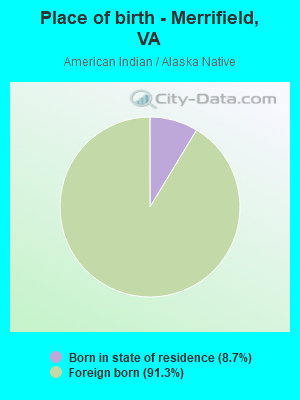
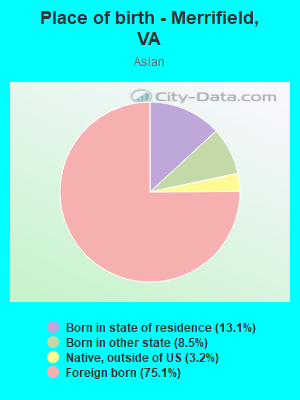
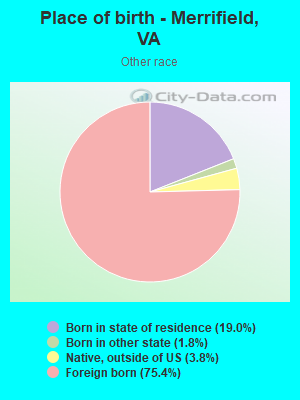
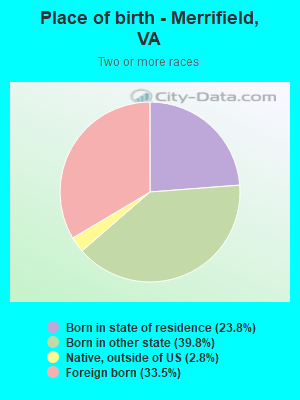
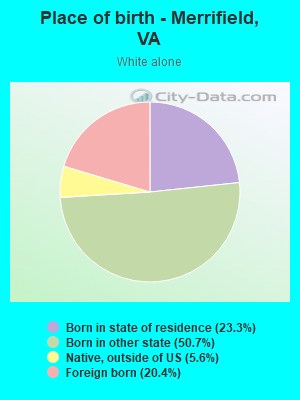
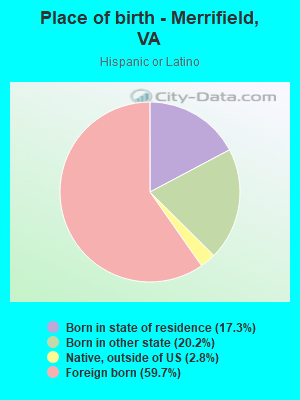
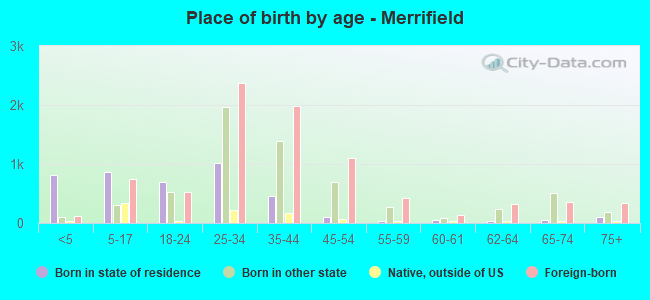
Place of birth - Born in state of residence (%)
Place of birth - Born in state of residence (%) - White
Place of birth - Born in state of residence (%) - Black or African American
Place of birth - Born in state of residence (%) - Asian
Place of birth - Born in state of residence (%) - Hispanic or Latino
Place of birth - Born in state of residence (%) - American Indian and Alaska Native
Place of birth - Born in state of residence (%) - Multirace
Place of birth - Born in state of residence (%) - Other Race
Place of birth - Born in other state (%)
Place of birth - Born in other state (%) - White
Place of birth - Born in other state (%) - Black or African American
Place of birth - Born in other state (%) - Asian
Place of birth - Born in other state (%) - Hispanic or Latino
Place of birth - Born in other state (%) - American Indian and Alaska Native
Place of birth - Born in other state (%) - Multirace
Place of birth - Born in other state (%) - Other Race
Place of birth - Native, outside of US (%)
Place of birth - Native, outside of US (%) - White
Place of birth - Native, outside of US (%) - Black or African American
Place of birth - Native, outside of US (%) - Asian
Place of birth - Native, outside of US (%) - Hispanic or Latino
Place of birth - Native, outside of US (%) - American Indian and Alaska Native
Place of birth - Native, outside of US (%) - Multirace
Place of birth - Native, outside of US (%) - Other Race
Place of birth - Foreign born (%)
Place of birth - Foreign born (%) - White
Place of birth - Foreign born (%) - Black or African American
Place of birth - Foreign born (%) - Asian
Place of birth - Foreign born (%) - Hispanic or Latino
Place of birth - Foreign born (%) - American Indian and Alaska Native
Place of birth - Foreign born (%) - Multirace
Place of birth - Foreign born (%) - Other Race
Residents speaking English at home (%)
Residents speaking English at home - Born in the United States (%)
Residents speaking English at home - Native, born elsewhere (%)
Residents speaking English at home - Foreign born (%)
Residents speaking Spanish at home (%)
Residents speaking Spanish at home - Born in the United States (%)
Residents speaking Spanish at home - Native, born elsewhere (%)
Residents speaking Spanish at home - Foreign born (%)
Residents speaking other language at home (%)
Residents speaking other language at home - Born in the United States (%)
Residents speaking other language at home - Native, born elsewhere (%)
Residents speaking other language at home - Foreign born (%)
Marital status - Never married (%)
Marital status - Now married (%)
Marital status - Separated (%)
Marital status - Widowed (%)
Marital status - Divorced (%)
Ancestries Reported - Arab (%)
Ancestries Reported - Czech (%)
Ancestries Reported - Danish (%)
Ancestries Reported - Dutch (%)
Ancestries Reported - English (%)
Ancestries Reported - French (%)
Ancestries Reported - French Canadian (%)
Ancestries Reported - German (%)
Ancestries Reported - Greek (%)
Ancestries Reported - Hungarian (%)
Ancestries Reported - Irish (%)
Ancestries Reported - Italian (%)
Ancestries Reported - Lithuanian (%)
Ancestries Reported - Norwegian (%)
Ancestries Reported - Polish (%)
Ancestries Reported - Portuguese (%)
Ancestries Reported - Russian (%)
Ancestries Reported - Scotch-Irish (%)
Ancestries Reported - Scottish (%)
Ancestries Reported - Slovak (%)
Ancestries Reported - Subsaharan African (%)
Ancestries Reported - Swedish (%)
Ancestries Reported - Swiss (%)
Ancestries Reported - Ukrainian (%)
Ancestries Reported - United States (%)
Ancestries Reported - Welsh (%)
Ancestries Reported - West Indian (%)
Ancestries Reported - Other (%)
Geographical mobility - Same house 1 year ago (%)
Geographical mobility - Same house 1 year ago (%) - White
Geographical mobility - Same house 1 year ago (%) - Black or African American
Geographical mobility - Same house 1 year ago (%) - Asian
Geographical mobility - Same house 1 year ago (%) - Hispanic or Latino
Geographical mobility - Same house 1 year ago (%) - American Indian and Alaska Native
Geographical mobility - Same house 1 year ago (%) - Multirace
Geographical mobility - Same house 1 year ago (%) - Other Race
Geographical mobility - Moved within same county (%)
Geographical mobility - Moved within same county (%) - White
Geographical mobility - Moved within same county (%) - Black or African American
Geographical mobility - Moved within same county (%) - Asian
Geographical mobility - Moved within same county (%) - Hispanic or Latino
Geographical mobility - Moved within same county (%) - American Indian and Alaska Native
Geographical mobility - Moved within same county (%) - Multirace
Geographical mobility - Moved within same county (%) - Other Race
Geographical mobility - Moved from different county within same state (%)
Geographical mobility - Moved from different county within same state (%) - White
Geographical mobility - Moved from different county within same state (%) - Black or African American
Geographical mobility - Moved from different county within same state (%) - Asian
Geographical mobility - Moved from different county within same state (%) - Hispanic or Latino
Geographical mobility - Moved from different county within same state (%) - American Indian and Alaska Native
Geographical mobility - Moved from different county within same state (%) - Multirace
Geographical mobility - Moved from different county within same state (%) - Other Race
Geographical mobility - Moved from different state (%)
Geographical mobility - Moved from different state (%) - White
Geographical mobility - Moved from different state (%) - Black or African American
Geographical mobility - Moved from different state (%) - Asian
Geographical mobility - Moved from different state (%) - Hispanic or Latino
Geographical mobility - Moved from different state (%) - American Indian and Alaska Native
Geographical mobility - Moved from different state (%) - Multirace
Geographical mobility - Moved from different state (%) - Other Race
Geographical mobility - Moved from abroad (%)
Geographical mobility - Moved from abroad (%) - White
Geographical mobility - Moved from abroad (%) - Black or African American
Geographical mobility - Moved from abroad (%) - Asian
Geographical mobility - Moved from abroad (%) - Hispanic or Latino
Geographical mobility - Moved from abroad (%) - American Indian and Alaska Native
Geographical mobility - Moved from abroad (%) - Multirace
Geographical mobility - Moved from abroad (%) - Other Race
Place of birth for the foreign-born population - Ireland (%)
Place of birth for the foreign-born population - Denmark (%)
Place of birth for the foreign-born population - Norway (%)
Place of birth for the foreign-born population - Sweden (%)
Place of birth for the foreign-born population - United Kingdom (%)
Place of birth for the foreign-born population - England (%)
Place of birth for the foreign-born population - Scotland (%)
Place of birth for the foreign-born population - Other Northern Europe (%)
Place of birth for the foreign-born population - Austria (%)
Place of birth for the foreign-born population - Belgium (%)
Place of birth for the foreign-born population - France (%)
Place of birth for the foreign-born population - Germany (%)
Place of birth for the foreign-born population - Netherlands (%)
Place of birth for the foreign-born population - Switzerland (%)
Place of birth for the foreign-born population - Other Western Europe (%)
Place of birth for the foreign-born population - Greece (%)
Place of birth for the foreign-born population - Italy (%)
Place of birth for the foreign-born population - Portugal (%)
Place of birth for the foreign-born population - Spain (%)
Place of birth for the foreign-born population - Other Southern Europe (%)
Place of birth for the foreign-born population - Albania (%)
Place of birth for the foreign-born population - Belarus (%)
Place of birth for the foreign-born population - Bosnia and Herzegovina (%)
Place of birth for the foreign-born population - Bulgaria (%)
Place of birth for the foreign-born population - Croatia (%)
Place of birth for the foreign-born population - Czechoslovakia (%)
Place of birth for the foreign-born population - Hungary (%)
Place of birth for the foreign-born population - Latvia (%)
Place of birth for the foreign-born population - Lithuania (%)
Place of birth for the foreign-born population - North Macedonia (Macedonia) (%)
Place of birth for the foreign-born population - Moldova (%)
Place of birth for the foreign-born population - Poland (%)
Place of birth for the foreign-born population - Romania (%)
Place of birth for the foreign-born population - Russia (%)
Place of birth for the foreign-born population - Serbia (%)
Place of birth for the foreign-born population - Ukraine (%)
Place of birth for the foreign-born population - Other Eastern Europe (%)
Place of birth for the foreign-born population - China (%)
Place of birth for the foreign-born population - Hong Kong (%)
Place of birth for the foreign-born population - Taiwan (%)
Place of birth for the foreign-born population - Japan (%)
Place of birth for the foreign-born population - Korea (%)
Place of birth for the foreign-born population - Other Eastern Asia (%)
Place of birth for the foreign-born population - Afghanistan (%)
Place of birth for the foreign-born population - Bangladesh (%)
Place of birth for the foreign-born population - India (%)
Place of birth for the foreign-born population - Iran (%)
Place of birth for the foreign-born population - Kazakhstan (%)
Place of birth for the foreign-born population - Nepal (%)
Place of birth for the foreign-born population - Pakistan (%)
Place of birth for the foreign-born population - Sri Lanka (%)
Place of birth for the foreign-born population - Uzbekistan (%)
Place of birth for the foreign-born population - Other South Central Asia (%)
Place of birth for the foreign-born population - Burma (%)
Place of birth for the foreign-born population - Cambodia (%)
Place of birth for the foreign-born population - Indonesia (%)
Place of birth for the foreign-born population - Laos (%)
Place of birth for the foreign-born population - Malaysia (%)
Place of birth for the foreign-born population - Philippines (%)
Place of birth for the foreign-born population - Singapore (%)
Place of birth for the foreign-born population - Thailand (%)
Place of birth for the foreign-born population - Vietnam (%)
Place of birth for the foreign-born population - Other South Eastern Asia (%)
Place of birth for the foreign-born population - Armenia (%)
Place of birth for the foreign-born population - Iraq (%)
Place of birth for the foreign-born population - Israel (%)
Place of birth for the foreign-born population - Jordan (%)
Place of birth for the foreign-born population - Kuwait (%)
Place of birth for the foreign-born population - Lebanon (%)
Place of birth for the foreign-born population - Saudi Arabia (%)
Place of birth for the foreign-born population - Syria (%)
Place of birth for the foreign-born population - Turkey (%)
Place of birth for the foreign-born population - Yemen (%)
Place of birth for the foreign-born population - Other Western Asia (%)
Place of birth for the foreign-born population - Eritrea (%)
Place of birth for the foreign-born population - Ethiopia (%)
Place of birth for the foreign-born population - Kenya (%)
Place of birth for the foreign-born population - Somalia (%)
Place of birth for the foreign-born population - Uganda (%)
Place of birth for the foreign-born population - Zimbabwe (%)
Place of birth for the foreign-born population - Other Eastern Africa (%)
Place of birth for the foreign-born population - Cameroon (%)
Place of birth for the foreign-born population - Congo (%)
Place of birth for the foreign-born population - Democratic Republic of Congo (Zaire) (%)
Place of birth for the foreign-born population - Other Middle Africa (%)
Place of birth for the foreign-born population - Egypt (%)
Place of birth for the foreign-born population - Morocco (%)
Place of birth for the foreign-born population - Sudan (%)
Place of birth for the foreign-born population - Other Northern Africa (%)
Place of birth for the foreign-born population - South Africa (%)
Place of birth for the foreign-born population - Other Southern Africa (%)
Place of birth for the foreign-born population - Cabo Verde (%)
Place of birth for the foreign-born population - Ghana (%)
Place of birth for the foreign-born population - Liberia (%)
Place of birth for the foreign-born population - Nigeria (%)
Place of birth for the foreign-born population - Senegal (%)
Place of birth for the foreign-born population - Sierra Leone (%)
Place of birth for the foreign-born population - Other Western Africa (%)
Place of birth for the foreign-born population - Australia (%)
Place of birth for the foreign-born population - New Zealand (%)
Place of birth for the foreign-born population - Fiji (%)
Place of birth for the foreign-born population - Micronesia (%)
Place of birth for the foreign-born population - Bahamas (%)
Place of birth for the foreign-born population - Barbados (%)
Place of birth for the foreign-born population - Cuba (%)
Place of birth for the foreign-born population - Dominica (%)
Place of birth for the foreign-born population - Dominican Republic (%)
Place of birth for the foreign-born population - Grenada (%)
Place of birth for the foreign-born population - Haiti (%)
Place of birth for the foreign-born population - Jamaica (%)
Place of birth for the foreign-born population - St. Vincent and the Grenadines (%)
Place of birth for the foreign-born population - Trinidad and Tobago (%)
Place of birth for the foreign-born population - West Indies (%)
Place of birth for the foreign-born population - Other Caribbean (%)
Place of birth for the foreign-born population - Belize (%)
Place of birth for the foreign-born population - Costa Rica (%)
Place of birth for the foreign-born population - El Salvador (%)
Place of birth for the foreign-born population - Guatemala (%)
Place of birth for the foreign-born population - Honduras (%)
Place of birth for the foreign-born population - Mexico (%)
Place of birth for the foreign-born population - Nicaragua (%)
Place of birth for the foreign-born population - Panama (%)
Place of birth for the foreign-born population - Other Central America (%)
Place of birth for the foreign-born population - Argentina (%)
Place of birth for the foreign-born population - Bolivia (%)
Place of birth for the foreign-born population - Brazil (%)
Place of birth for the foreign-born population - Chile (%)
Place of birth for the foreign-born population - Colombia (%)
Place of birth for the foreign-born population - Ecuador (%)
Place of birth for the foreign-born population - Guyana (%)
Place of birth for the foreign-born population - Peru (%)
Place of birth for the foreign-born population - Uruguay (%)
Place of birth for the foreign-born population - Venezuela (%)
Place of birth for the foreign-born population - Other South America (%)
Place of birth for the foreign-born population - Canada (%)
Place of birth for the foreign-born population - Other Northern America (%)
Place of birth for the foreign-born population - Other (%)
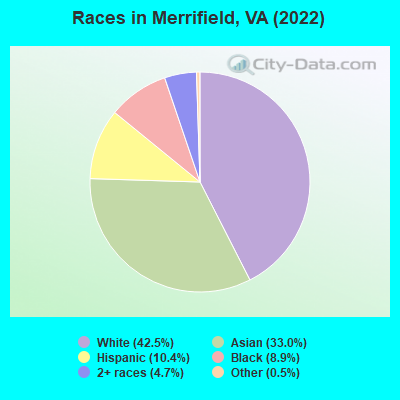
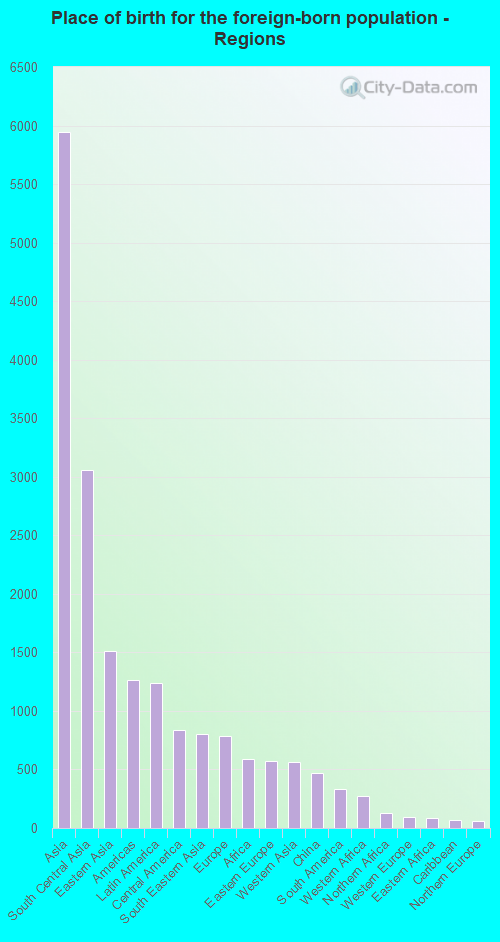
According to 2022 data, the most numerous races in Merrifield, VA are White alone (8,409 residents), Black alone (1,772 residents), and Hispanic (2,056 residents). 51.1% of Merrifield residents speak English at home. 43.4% of Merrifield, VA residents are foreign-born (30.0% born in Asia, 6.2% born in Latin America), which is 72.3% greater than the foreign-born rate of 12.0% across the entire state of Virginia.
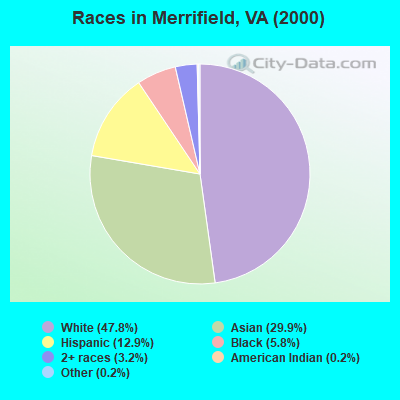
Race distribution in Merrifield
2000 2022
4,965,637 70.2% White alone 1,376,378 19.4% Black alone 329,540 4.7% Hispanic 259,277 3.7% Asian alone 114,022 1.6% Two or more races 18,596 0.3% American Indian alone 11,685 0.2% Other race alone 3,380 0.05% Native Hawaiian and Other
5,095,130 58.7% White alone 1,594,785 18.4% Black alone 905,750 10.4% Hispanic 602,881 6.9% Asian alone 406,047 4.7% Two or more races 60,419 0.7% Other race alone 11,738 0.1% American Indian alone 6,869 0.08% Native Hawaiian and Other
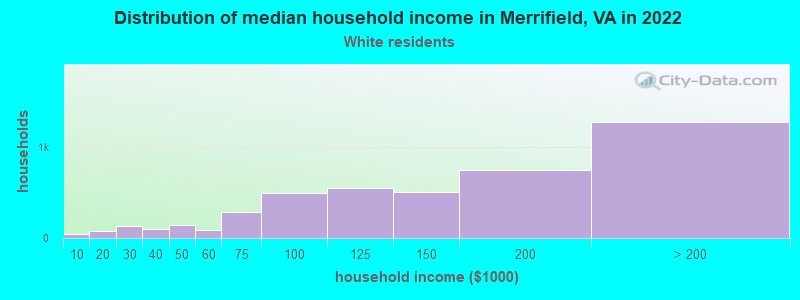
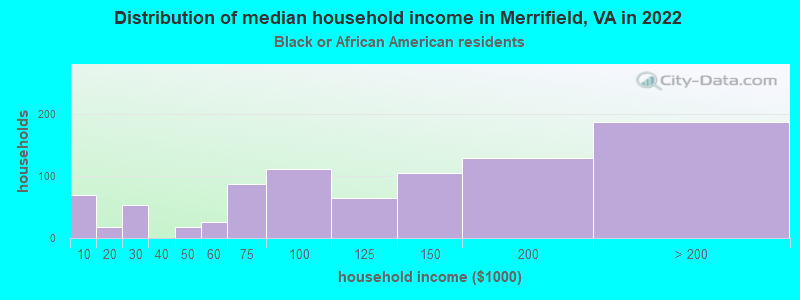
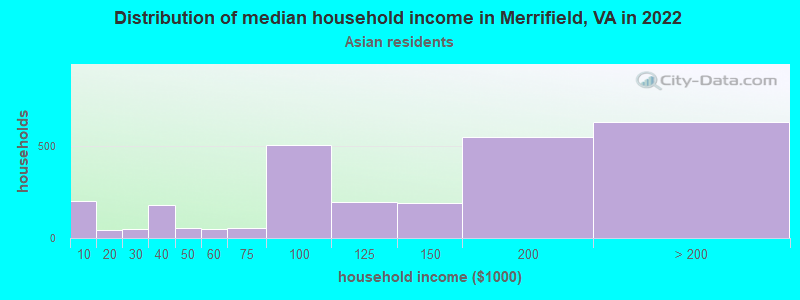
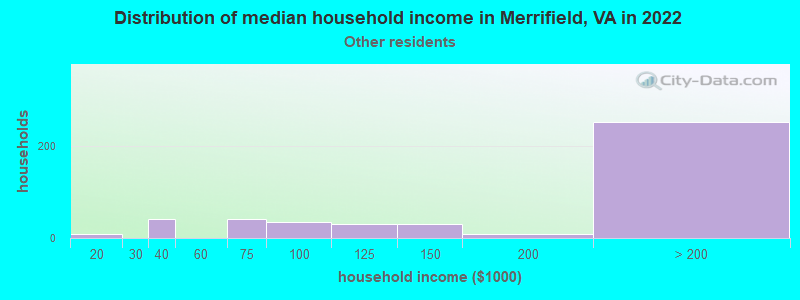
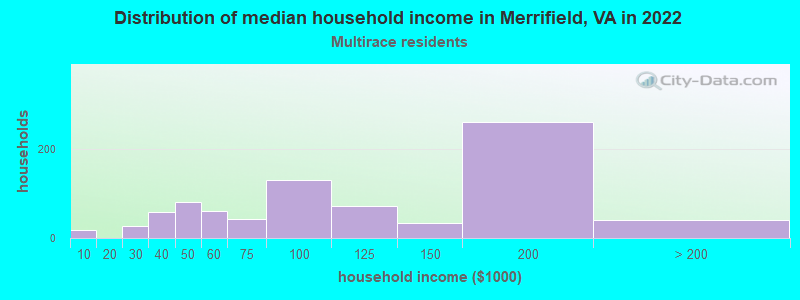
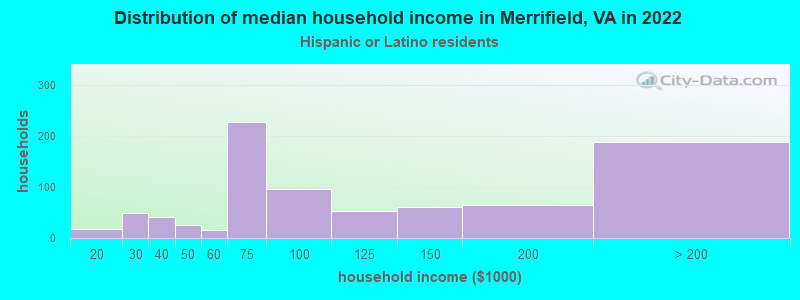
Income and house value in Merrifield Median household income in 2022 $139,174 White non-Hispanic householders$119,902 Black householders$128,455 Asian householders$161,286 Some other race householders$99,387 Two or more races householders$79,384 Hispanic or Latino race householdersMedian 2022 house value $655,316 White Non-Hispanic householders$542,480 Black or African American householdersover $1,000,000 American Indian or Alaska Native householders $618,928 Asian householders$500,751 Some other race householders$446,670 Two or more races householders$566,182 Hispanic or Latino householders
Median age by race in Merrifield
35.3 Median age for White residents34.9 35.8 29.0 Median age for Black or African American residents25.9 36.7 32.6 Median age for American Indian / Alaska Native residents37.5 -669,005,847.3 34.5 Median age for Asian residents35.3 32.8 -666,666,666.0 Median age for Native Hawaiian / Pacific Islander residents-558,791,801.0 -584,518,166.9 40.9 Median age for Other race residents41.3 40.1 32.2 Median age for Two or more races residents36.1 31.2 34.9 Median age for White alone residents34.5 35.2 35.6 Median age for Hispanic or Latino residents39.9 33.4
Owner/renter occupied households by race in Merrifield
House owners and renters - White residents 1,836 40.8% Owner occupied2,662 59.2% Renter occupiedHouse owners and renters - Black or African American residents 170 20.0% Owner occupied681 80.0% Renter occupiedHouse owners and renters - American Indian / Alaska Native residents 53 100.0% Renter occupiedHouse owners and renters - Asian residents 1,132 41.9% Owner occupied1,568 58.1% Renter occupiedHouse owners and renters - Other race residents 91 25.7% Owner occupied262 74.3% Renter occupiedHouse owners and renters - Two or more races residents 244 28.6% Owner occupied607 71.4% Renter occupiedHouse owners and renters - White alone residents 1,788 39.7% Owner occupied2,720 60.3% Renter occupiedHouse owners and renters - Hispanic or Latino residents 238 28.0% Owner occupied612 72.0% Renter occupied
Language usage in Merrifield
English speakers - Total 51.1% of residents of Merrifield speak English at home.
8.5% of residents speak Spanish at home 683 43.0% Speak English very well904 57.0% Speak English less than very well40.4% of residents speak other language at home 5,327 70.3% Speak English very well2,254 29.7% Speak English less than very well
English speakers - Born in the United States 83.9% of residents of Merrifield speak English at home.
5.7% of residents speak Spanish at home 205 58.2% Speak English very well147 41.8% Speak English less than very well10.6% of residents speak other language at home 587 88.8% Speak English very well74 11.2% Speak English less than very well
English speakers - Native, born elsewhere 70.4% of residents of Merrifield speak English at home.
3.3% of residents speak Spanish at home 27 100.0% Speak English very well26.0% of residents speak other language at home 211 100.0% Speak English very well
English speakers - Foreign-born 12.8% of residents of Merrifield speak English at home.
13.1% of residents speak Spanish at home 370 33.3% Speak English very well742 66.7% Speak English less than very well73.6% of residents speak other language at home 4,065 65.2% Speak English very well2,168 34.8% Speak English less than very well
White (Caucasian) - Speak only English Native:
92.2% (5,894)Foreign-born:
15.3% (206)
White (Caucasian) - Speak another language Native:
7.4% (474)Foreign-born:
81.0% (1,093)
Black or African American - Speak only English Native:
77.8% (941)Foreign-born:
20.3% (109)
Black or African American - Speak another language Native:
24.4% (295)Foreign-born:
78.8% (424)
American Indian / Alaska Native - Speak another language Native:
97.8% (17)Foreign-born:
100.0% (185)
Asian - Speak only English Native:
48.4% (638)Foreign-born:
14.1% (683)
Asian - Speak another language Native:
51.7% (682)Foreign-born:
86.1% (4,181)
Other race - Speak only English Native:
51.4% (129)Foreign-born:
8.3% (63)
Other race - Speak another language Native:
51.1% (128)Foreign-born:
91.7% (691)
Two or more races - Speak only English Native:
87.4% (932)Foreign-born:
3.4% (21)
Two or more races - Speak another language Native:
11.6% (124)Foreign-born:
96.7% (601)
White alone - Speak only English Native:
93.0% (5,876)Foreign-born:
12.5% (210)
White alone - Speak another language Native:
6.8% (428)Foreign-born:
85.2% (1,432)
Hispanic or Latino - Speak only English Native:
53.3% (430)Foreign-born:
5.7% (68)
Hispanic or Latino - Speak another language Native:
47.9% (387)Foreign-born:
94.3% (1,125)
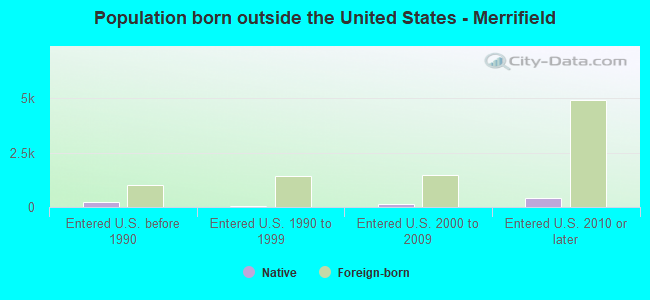
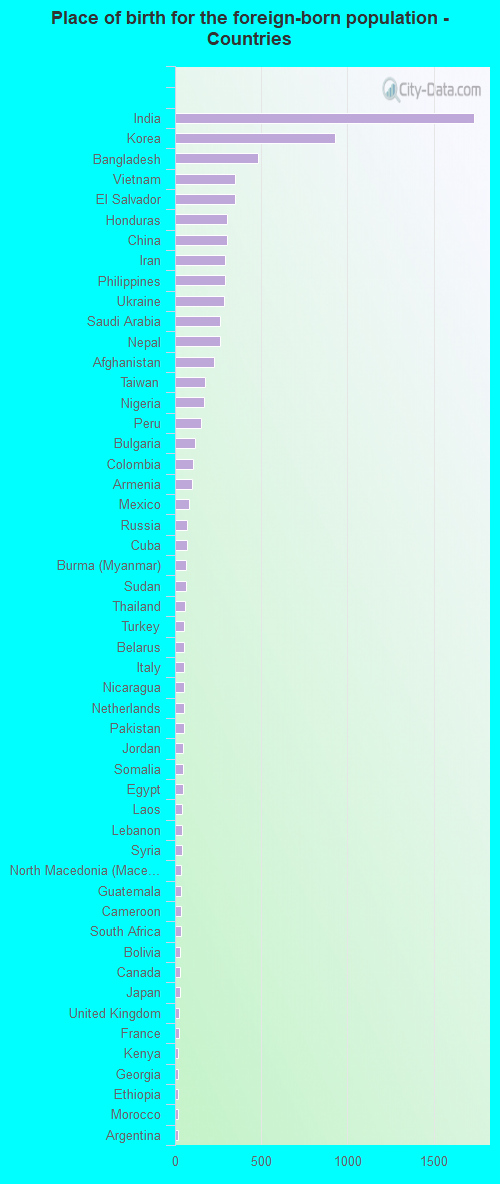
Foreign-born residents in Merrifield 8,591 residents are foreign born (30.0% Asia , 6.2% Latin America ).
This city:
43.4%Virginia:
12.6%
Marital status for residents in Merrifield Marital status - White (Caucasian) population 15 years and over
Males 41.5% Never married47.3% Now married0.7% Separated0.7% Widowed9.7% DivorcedFemales 41.4% Never married48.6% Now married0.2% Separated4.4% Widowed5.3% DivorcedWomen who gave birth in the past 12 months Now married:
53.4% (35)Unmarried:
46.6% (30)
Women who did not give birth in the past 12 months Now married:
46.7% (1,128)Unmarried:
53.3% (1,286)
Marital status - Black or African American population 15 years and over
Males 67.0% Never married26.2% Now married0.0% Separated0.0% Widowed6.8% DivorcedFemales 40.7% Never married23.8% Now married6.3% Separated0.5% Widowed28.7% DivorcedWomen who gave birth in the past 12 months Now married:
100.0% (19)Unmarried:
0.0% (0)
Women who did not give birth in the past 12 months Now married:
33.9% (183)Unmarried:
66.1% (356)
Marital status - American Indian / Alaska Native population 15 years and over
Males 100.0% Never married0.0% Now married0.0% Separated0.0% Widowed0.0% DivorcedFemales 100.0% Never married0.0% Now married0.0% Separated0.0% Widowed0.0% DivorcedWomen who did not give birth in the past 12 months Now married:
0.0% (0)Unmarried:
100.0% (38)
Marital status - Asian population 15 years and over
Males 26.5% Never married66.9% Now married4.3% Separated0.0% Widowed2.3% DivorcedFemales 23.9% Never married67.4% Now married0.0% Separated3.1% Widowed5.6% DivorcedWomen who gave birth in the past 12 months Now married:
100.0% (289)Unmarried:
0.0% (0)
Women who did not give birth in the past 12 months Now married:
62.5% (1,263)Unmarried:
37.5% (758)
Marital status - Other race population 15 years and over
Males 41.6% Never married54.6% Now married0.0% Separated0.0% Widowed3.8% DivorcedFemales 51.1% Never married28.5% Now married6.2% Separated8.2% Widowed5.9% DivorcedWomen who gave birth in the past 12 months Now married:
100.0% (32)Unmarried:
0.0% (0)
Women who did not give birth in the past 12 months Now married:
17.5% (45)Unmarried:
82.5% (214)
Marital status - Two or more races population 15 years and over
Males 39.0% Never married38.4% Now married0.0% Separated22.6% Widowed0.0% DivorcedFemales 61.1% Never married32.7% Now married0.0% Separated4.0% Widowed2.2% DivorcedWomen who gave birth in the past 12 months Now married:
0.0% (0)Unmarried:
100.0% (39)
Women who did not give birth in the past 12 months Now married:
32.0% (221)Unmarried:
68.0% (468)
Marital status - White alone, not Hispanic / Latino population 15 years and over
Males 41.6% Never married47.0% Now married0.7% Separated0.8% Widowed9.9% DivorcedFemales 39.0% Never married51.1% Now married0.2% Separated4.8% Widowed4.8% DivorcedWomen who gave birth in the past 12 months Now married:
100.0% (38)Unmarried:
0.0% (0)
Women who did not give birth in the past 12 months Now married:
49.6% (1,197)Unmarried:
50.4% (1,216)
Marital status - Hispanic or Latino population 15 years and over
Males 47.7% Never married46.7% Now married0.0% Separated3.4% Widowed2.2% DivorcedFemales 58.9% Never married27.5% Now married1.9% Separated5.1% Widowed6.7% DivorcedWomen who gave birth in the past 12 months Now married:
0.0% (0)Unmarried:
100.0% (34)
Women who did not give birth in the past 12 months Now married:
21.9% (160)Unmarried:
78.1% (570)
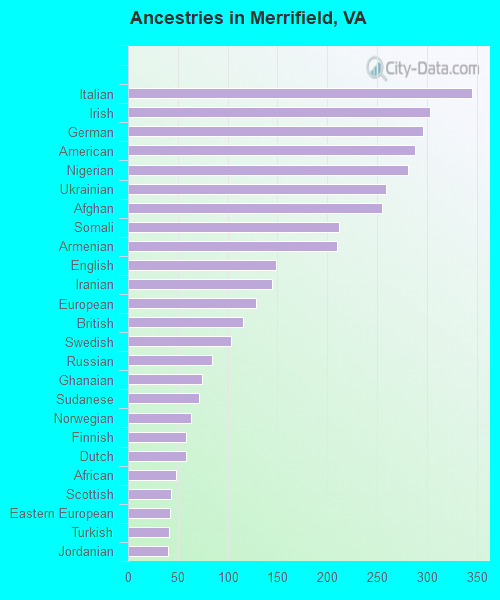
Ancestries in Merrifield
345 3.0% Italian303 2.6% Irish296 2.6% German288 2.5% American281 2.4% Nigerian259 2.2% Ukrainian255 2.2% Afghan212 1.8% Somali210 1.8% Armenian149 1.3% English145 1.3% Iranian128 1.1% European115 1.0% British103 0.9% Swedish84 0.7% Russian74 0.6% Ghanaian71 0.6% Sudanese63 0.5% Norwegian58 0.5% Finnish58 0.5% Dutch48 0.4% African43 0.4% Scottish42 0.4% Eastern European41 0.4% Turkish40 0.3% Jordanian32 0.3% Ethiopian32 0.3% Jamaican31 0.3% Slovak30 0.3% Polish28 0.2% Lebanese24 0.2% Bulgarian21 0.2% Moroccan20 0.2% Swiss18 0.2% Greek17 0.1% Scandinavian16 0.1% Portuguese14 0.1% Egyptian14 0.1% French12 0.1% Serbian9 0.08% Scotch-Irish7 0.06% Canadian1 0.01% Slovene
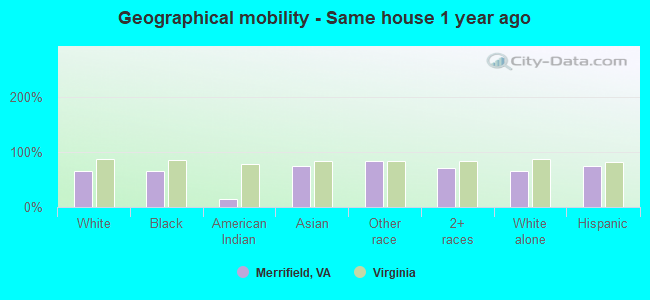
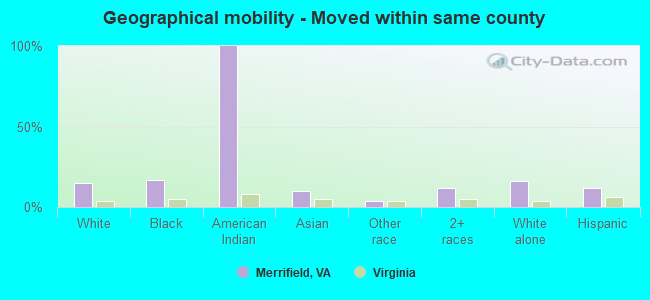
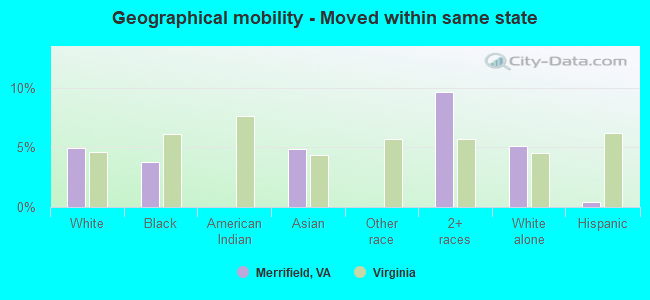
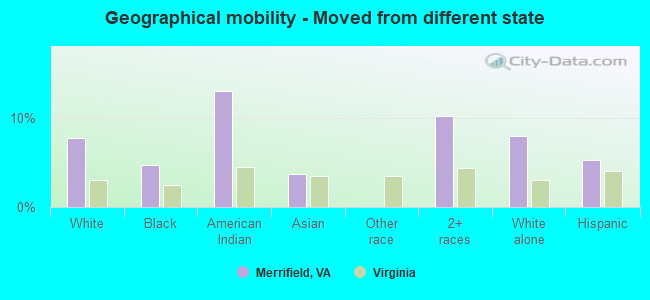
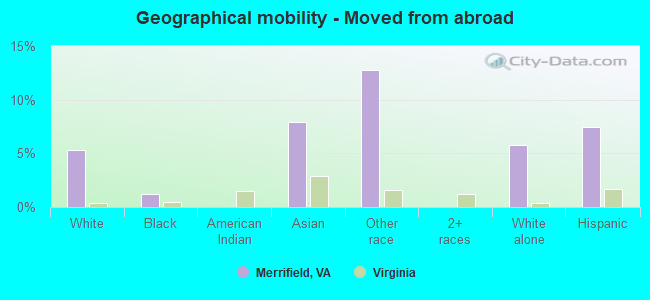
Geographical mobility in Merrifield Same house 1 year ago 5,449 66.2% White (Caucasian)1,206 64.8% Black or African American20 15.5% American Indian / Alaska Native4,819 75.2% Asian875 83.1% Other race1,235 70.8% Two or more races5,497 65.7% White alone, not Hispanic / Latino1,557 75.6% Hispanic or LatinoMoved within same county 1,265 15.4% White / Caucasian318 17.1% Black or African American169 100.0% American Indian / Alaska Native659 10.3% Asian40 3.8% Other race205 11.8% Two or more races1,299 15.5% White alone, not Hispanic / Latino256 12.4% Hispanic or LatinoMoved within same state 404 4.9% White / Caucasian70 3.7% Black or African American314 4.9% Asian168 9.6% Two or more races427 5.1% White alone, not Hispanic / Latino9 0.5% Hispanic or LatinoMoved from different state 631 7.7% White / Caucasian88 4.7% Black or African American17 13.0% American Indian / Alaska Native238 3.7% Asian177 10.2% Two or more races660 7.9% White alone, not Hispanic / Latino108 5.2% Hispanic or LatinoMoved from abroad 440 5.3% White22 1.2% Black or African American507 7.9% Asian135 12.8% Other race482 5.8% White alone, not Hispanic / Latino154 7.5% Hispanic or Latino
Children Nativity (place of birth) in Merrifield
Children under 6 years - Living with two parents Both parents native 256 100.0% NativeBoth parents foreign-born 410 73.8% Native145 26.2% Foreign-bornOne native, one foreign-born parent 293 100.0% NativeChildren under 6 years - Living with one parent Native parent 95 100.0% NativeForeign-born parent 6 41.8% Native8 58.2% Foreign-bornChildren 6 to 17 years - Living with two parents Both parents native 514 100.0% NativeBoth parents foreign-born 435 42.6% Native585 57.4% Foreign-bornOne native, one foreign-born parent 220 100.0% NativeChildren 6 to 17 years - Living with one parent Foreign-born parent 248 65.5% Native130 34.5% Foreign-born
Grandparents responsible for own grandchildren in Merrifield
Grandparents (30 to 59 years) Other race 66 100.0% Not responsible for grandchildrenHispanic or Latino 39 100.0% Not responsible for grandchildren
Grandparents (60 years and over) Other race 33 100.0% Not responsible for grandchildrenHispanic or Latino 29 100.0% Not responsible for grandchildren