Races in Merrillville, Indiana (IN) Detailed Stats
Data:
Races - White alone (%)
Races - White alone (% change since 2000)
Races - Black alone (%)
Races - Black alone (% change since 2000)
Races - American Indian alone (%)
Races - American Indian alone (% change since 2000)
Races - Asian alone (%)
Races - Asian alone (% change since 2000)
Races - Hispanic (%)
Races - Hispanic (% change since 2000)
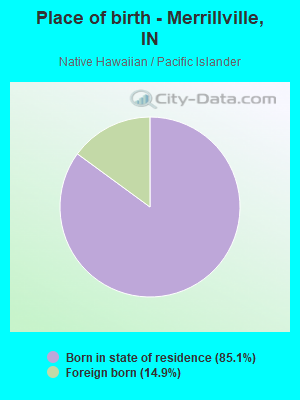
Races - Native Hawaiian and Other Pacific Islander alone (%)
Races - Native Hawaiian and Other Pacific Islander alone (% change since 2000)
Races - Two or more races(%)
Races - Two or more races(% change since 2000)
Races - Other race alone (%)
Races - Other race alone (% change since 2000)
Racial diversity
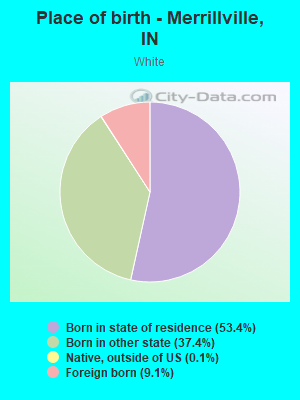
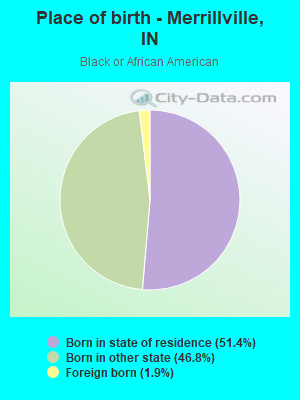
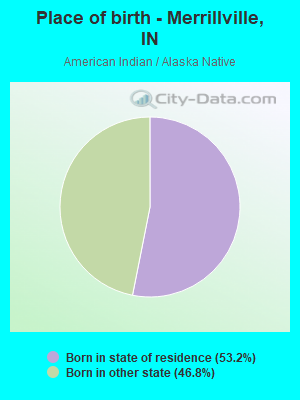
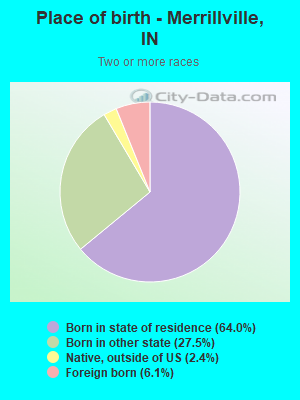
Place of birth - Born in state of residence (%)
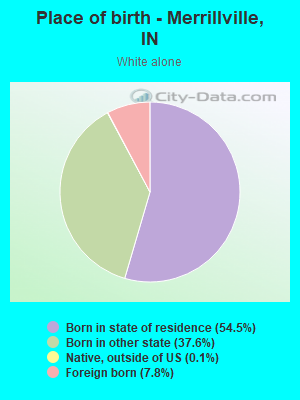
Place of birth - Born in state of residence (%) - White
Place of birth - Born in state of residence (%) - Black or African American
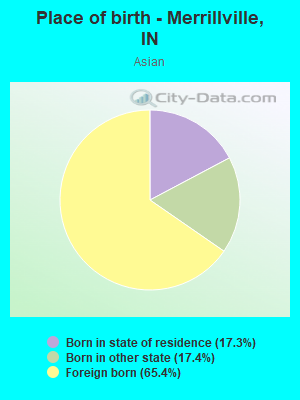
Place of birth - Born in state of residence (%) - Asian
Place of birth - Born in state of residence (%) - Hispanic or Latino
Place of birth - Born in state of residence (%) - American Indian and Alaska Native
Place of birth - Born in state of residence (%) - Multirace
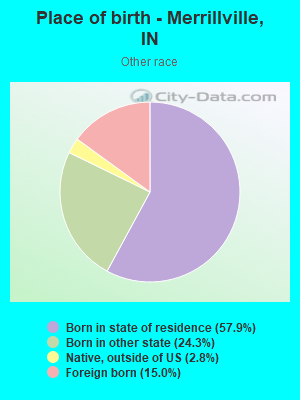
Place of birth - Born in state of residence (%) - Other Race
Place of birth - Born in other state (%)
Place of birth - Born in other state (%) - White
Place of birth - Born in other state (%) - Black or African American
Place of birth - Born in other state (%) - Asian
Place of birth - Born in other state (%) - Hispanic or Latino
Place of birth - Born in other state (%) - American Indian and Alaska Native
Place of birth - Born in other state (%) - Multirace
Place of birth - Born in other state (%) - Other Race
Place of birth - Native, outside of US (%)
Place of birth - Native, outside of US (%) - White
Place of birth - Native, outside of US (%) - Black or African American
Place of birth - Native, outside of US (%) - Asian
Place of birth - Native, outside of US (%) - Hispanic or Latino
Place of birth - Native, outside of US (%) - American Indian and Alaska Native
Place of birth - Native, outside of US (%) - Multirace
Place of birth - Native, outside of US (%) - Other Race
Place of birth - Foreign born (%)
Place of birth - Foreign born (%) - White
Place of birth - Foreign born (%) - Black or African American
Place of birth - Foreign born (%) - Asian
Place of birth - Foreign born (%) - Hispanic or Latino
Place of birth - Foreign born (%) - American Indian and Alaska Native
Place of birth - Foreign born (%) - Multirace
Place of birth - Foreign born (%) - Other Race
Residents speaking English at home (%)
Residents speaking English at home - Born in the United States (%)
Residents speaking English at home - Native, born elsewhere (%)
Residents speaking English at home - Foreign born (%)
Residents speaking Spanish at home (%)
Residents speaking Spanish at home - Born in the United States (%)
Residents speaking Spanish at home - Native, born elsewhere (%)
Residents speaking Spanish at home - Foreign born (%)
Residents speaking other language at home (%)
Residents speaking other language at home - Born in the United States (%)
Residents speaking other language at home - Native, born elsewhere (%)
Residents speaking other language at home - Foreign born (%)
Marital status - Never married (%)
Marital status - Now married (%)
Marital status - Separated (%)
Marital status - Widowed (%)
Marital status - Divorced (%)
Ancestries Reported - Arab (%)
Ancestries Reported - Czech (%)
Ancestries Reported - Danish (%)
Ancestries Reported - Dutch (%)
Ancestries Reported - English (%)
Ancestries Reported - French (%)
Ancestries Reported - French Canadian (%)
Ancestries Reported - German (%)
Ancestries Reported - Greek (%)
Ancestries Reported - Hungarian (%)
Ancestries Reported - Irish (%)
Ancestries Reported - Italian (%)
Ancestries Reported - Lithuanian (%)
Ancestries Reported - Norwegian (%)
Ancestries Reported - Polish (%)
Ancestries Reported - Portuguese (%)
Ancestries Reported - Russian (%)
Ancestries Reported - Scotch-Irish (%)
Ancestries Reported - Scottish (%)
Ancestries Reported - Slovak (%)
Ancestries Reported - Subsaharan African (%)
Ancestries Reported - Swedish (%)
Ancestries Reported - Swiss (%)
Ancestries Reported - Ukrainian (%)
Ancestries Reported - United States (%)
Ancestries Reported - Welsh (%)
Ancestries Reported - West Indian (%)
Ancestries Reported - Other (%)
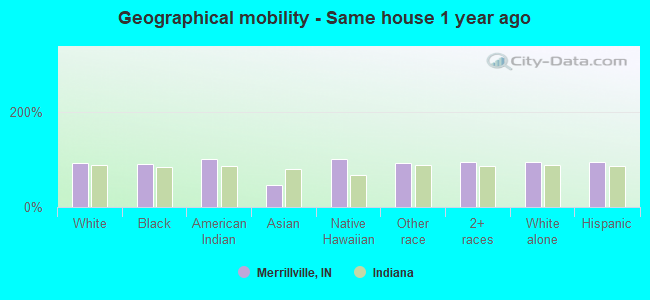
Geographical mobility - Same house 1 year ago (%)
Geographical mobility - Same house 1 year ago (%) - White
Geographical mobility - Same house 1 year ago (%) - Black or African American
Geographical mobility - Same house 1 year ago (%) - Asian
Geographical mobility - Same house 1 year ago (%) - Hispanic or Latino
Geographical mobility - Same house 1 year ago (%) - American Indian and Alaska Native
Geographical mobility - Same house 1 year ago (%) - Multirace
Geographical mobility - Same house 1 year ago (%) - Other Race
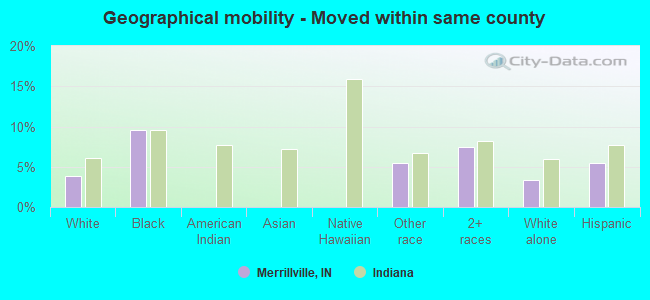
Geographical mobility - Moved within same county (%)
Geographical mobility - Moved within same county (%) - White
Geographical mobility - Moved within same county (%) - Black or African American
Geographical mobility - Moved within same county (%) - Asian
Geographical mobility - Moved within same county (%) - Hispanic or Latino
Geographical mobility - Moved within same county (%) - American Indian and Alaska Native
Geographical mobility - Moved within same county (%) - Multirace
Geographical mobility - Moved within same county (%) - Other Race
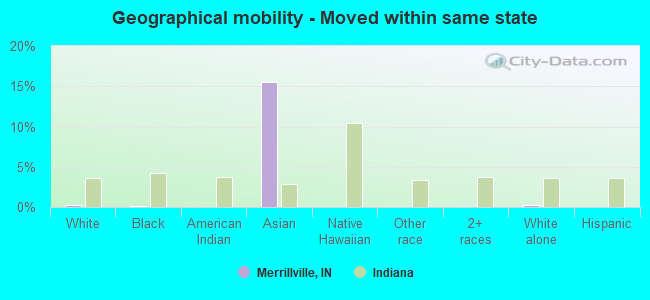
Geographical mobility - Moved from different county within same state (%)
Geographical mobility - Moved from different county within same state (%) - White
Geographical mobility - Moved from different county within same state (%) - Black or African American
Geographical mobility - Moved from different county within same state (%) - Asian
Geographical mobility - Moved from different county within same state (%) - Hispanic or Latino
Geographical mobility - Moved from different county within same state (%) - American Indian and Alaska Native
Geographical mobility - Moved from different county within same state (%) - Multirace
Geographical mobility - Moved from different county within same state (%) - Other Race
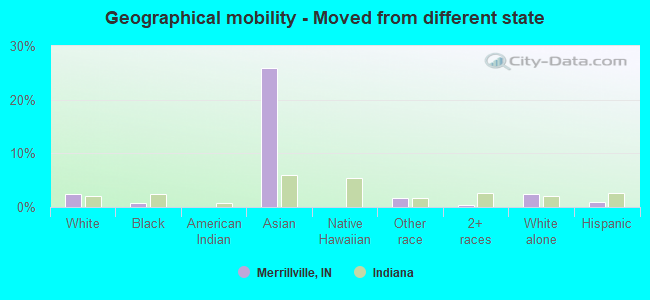
Geographical mobility - Moved from different state (%)
Geographical mobility - Moved from different state (%) - White
Geographical mobility - Moved from different state (%) - Black or African American
Geographical mobility - Moved from different state (%) - Asian
Geographical mobility - Moved from different state (%) - Hispanic or Latino
Geographical mobility - Moved from different state (%) - American Indian and Alaska Native
Geographical mobility - Moved from different state (%) - Multirace
Geographical mobility - Moved from different state (%) - Other Race
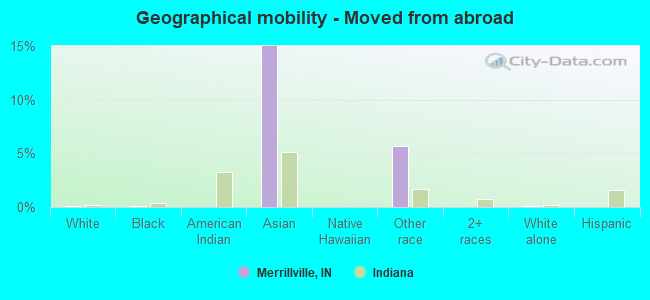
Geographical mobility - Moved from abroad (%)
Geographical mobility - Moved from abroad (%) - White
Geographical mobility - Moved from abroad (%) - Black or African American
Geographical mobility - Moved from abroad (%) - Asian
Geographical mobility - Moved from abroad (%) - Hispanic or Latino
Geographical mobility - Moved from abroad (%) - American Indian and Alaska Native
Geographical mobility - Moved from abroad (%) - Multirace
Geographical mobility - Moved from abroad (%) - Other Race
Place of birth for the foreign-born population - Ireland (%)
Place of birth for the foreign-born population - Denmark (%)
Place of birth for the foreign-born population - Norway (%)
Place of birth for the foreign-born population - Sweden (%)
Place of birth for the foreign-born population - United Kingdom (%)
Place of birth for the foreign-born population - England (%)
Place of birth for the foreign-born population - Scotland (%)
Place of birth for the foreign-born population - Other Northern Europe (%)
Place of birth for the foreign-born population - Austria (%)
Place of birth for the foreign-born population - Belgium (%)
Place of birth for the foreign-born population - France (%)
Place of birth for the foreign-born population - Germany (%)
Place of birth for the foreign-born population - Netherlands (%)
Place of birth for the foreign-born population - Switzerland (%)
Place of birth for the foreign-born population - Other Western Europe (%)
Place of birth for the foreign-born population - Greece (%)
Place of birth for the foreign-born population - Italy (%)
Place of birth for the foreign-born population - Portugal (%)
Place of birth for the foreign-born population - Spain (%)
Place of birth for the foreign-born population - Other Southern Europe (%)
Place of birth for the foreign-born population - Albania (%)
Place of birth for the foreign-born population - Belarus (%)
Place of birth for the foreign-born population - Bosnia and Herzegovina (%)
Place of birth for the foreign-born population - Bulgaria (%)
Place of birth for the foreign-born population - Croatia (%)
Place of birth for the foreign-born population - Czechoslovakia (%)
Place of birth for the foreign-born population - Hungary (%)
Place of birth for the foreign-born population - Latvia (%)
Place of birth for the foreign-born population - Lithuania (%)
Place of birth for the foreign-born population - North Macedonia (Macedonia) (%)
Place of birth for the foreign-born population - Moldova (%)
Place of birth for the foreign-born population - Poland (%)
Place of birth for the foreign-born population - Romania (%)
Place of birth for the foreign-born population - Russia (%)
Place of birth for the foreign-born population - Serbia (%)
Place of birth for the foreign-born population - Ukraine (%)
Place of birth for the foreign-born population - Other Eastern Europe (%)
Place of birth for the foreign-born population - China (%)
Place of birth for the foreign-born population - Hong Kong (%)
Place of birth for the foreign-born population - Taiwan (%)
Place of birth for the foreign-born population - Japan (%)
Place of birth for the foreign-born population - Korea (%)
Place of birth for the foreign-born population - Other Eastern Asia (%)
Place of birth for the foreign-born population - Afghanistan (%)
Place of birth for the foreign-born population - Bangladesh (%)
Place of birth for the foreign-born population - India (%)
Place of birth for the foreign-born population - Iran (%)
Place of birth for the foreign-born population - Kazakhstan (%)
Place of birth for the foreign-born population - Nepal (%)
Place of birth for the foreign-born population - Pakistan (%)
Place of birth for the foreign-born population - Sri Lanka (%)
Place of birth for the foreign-born population - Uzbekistan (%)
Place of birth for the foreign-born population - Other South Central Asia (%)
Place of birth for the foreign-born population - Burma (%)
Place of birth for the foreign-born population - Cambodia (%)
Place of birth for the foreign-born population - Indonesia (%)
Place of birth for the foreign-born population - Laos (%)
Place of birth for the foreign-born population - Malaysia (%)
Place of birth for the foreign-born population - Philippines (%)
Place of birth for the foreign-born population - Singapore (%)
Place of birth for the foreign-born population - Thailand (%)
Place of birth for the foreign-born population - Vietnam (%)
Place of birth for the foreign-born population - Other South Eastern Asia (%)
Place of birth for the foreign-born population - Armenia (%)
Place of birth for the foreign-born population - Iraq (%)
Place of birth for the foreign-born population - Israel (%)
Place of birth for the foreign-born population - Jordan (%)
Place of birth for the foreign-born population - Kuwait (%)
Place of birth for the foreign-born population - Lebanon (%)
Place of birth for the foreign-born population - Saudi Arabia (%)
Place of birth for the foreign-born population - Syria (%)
Place of birth for the foreign-born population - Turkey (%)
Place of birth for the foreign-born population - Yemen (%)
Place of birth for the foreign-born population - Other Western Asia (%)
Place of birth for the foreign-born population - Eritrea (%)
Place of birth for the foreign-born population - Ethiopia (%)
Place of birth for the foreign-born population - Kenya (%)
Place of birth for the foreign-born population - Somalia (%)
Place of birth for the foreign-born population - Uganda (%)
Place of birth for the foreign-born population - Zimbabwe (%)
Place of birth for the foreign-born population - Other Eastern Africa (%)
Place of birth for the foreign-born population - Cameroon (%)
Place of birth for the foreign-born population - Congo (%)
Place of birth for the foreign-born population - Democratic Republic of Congo (Zaire) (%)
Place of birth for the foreign-born population - Other Middle Africa (%)
Place of birth for the foreign-born population - Egypt (%)
Place of birth for the foreign-born population - Morocco (%)
Place of birth for the foreign-born population - Sudan (%)
Place of birth for the foreign-born population - Other Northern Africa (%)
Place of birth for the foreign-born population - South Africa (%)
Place of birth for the foreign-born population - Other Southern Africa (%)
Place of birth for the foreign-born population - Cabo Verde (%)
Place of birth for the foreign-born population - Ghana (%)
Place of birth for the foreign-born population - Liberia (%)
Place of birth for the foreign-born population - Nigeria (%)
Place of birth for the foreign-born population - Senegal (%)
Place of birth for the foreign-born population - Sierra Leone (%)
Place of birth for the foreign-born population - Other Western Africa (%)
Place of birth for the foreign-born population - Australia (%)
Place of birth for the foreign-born population - New Zealand (%)
Place of birth for the foreign-born population - Fiji (%)
Place of birth for the foreign-born population - Micronesia (%)
Place of birth for the foreign-born population - Bahamas (%)
Place of birth for the foreign-born population - Barbados (%)
Place of birth for the foreign-born population - Cuba (%)
Place of birth for the foreign-born population - Dominica (%)
Place of birth for the foreign-born population - Dominican Republic (%)
Place of birth for the foreign-born population - Grenada (%)
Place of birth for the foreign-born population - Haiti (%)
Place of birth for the foreign-born population - Jamaica (%)
Place of birth for the foreign-born population - St. Vincent and the Grenadines (%)
Place of birth for the foreign-born population - Trinidad and Tobago (%)
Place of birth for the foreign-born population - West Indies (%)
Place of birth for the foreign-born population - Other Caribbean (%)
Place of birth for the foreign-born population - Belize (%)
Place of birth for the foreign-born population - Costa Rica (%)
Place of birth for the foreign-born population - El Salvador (%)
Place of birth for the foreign-born population - Guatemala (%)
Place of birth for the foreign-born population - Honduras (%)
Place of birth for the foreign-born population - Mexico (%)
Place of birth for the foreign-born population - Nicaragua (%)
Place of birth for the foreign-born population - Panama (%)
Place of birth for the foreign-born population - Other Central America (%)
Place of birth for the foreign-born population - Argentina (%)
Place of birth for the foreign-born population - Bolivia (%)
Place of birth for the foreign-born population - Brazil (%)
Place of birth for the foreign-born population - Chile (%)
Place of birth for the foreign-born population - Colombia (%)
Place of birth for the foreign-born population - Ecuador (%)
Place of birth for the foreign-born population - Guyana (%)
Place of birth for the foreign-born population - Peru (%)
Place of birth for the foreign-born population - Uruguay (%)
Place of birth for the foreign-born population - Venezuela (%)
Place of birth for the foreign-born population - Other South America (%)
Place of birth for the foreign-born population - Canada (%)
Place of birth for the foreign-born population - Other Northern America (%)
Place of birth for the foreign-born population - Other (%)
Latest news about races in Merrillville, IN collected exclusively by city-data.com from local newspapers, TV, and radio stations
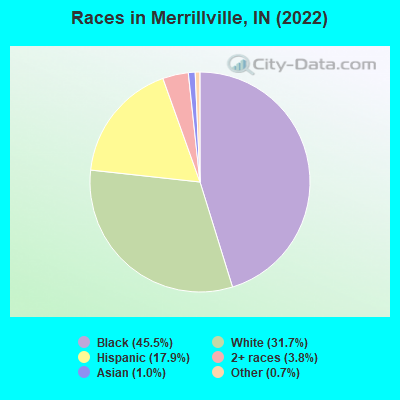
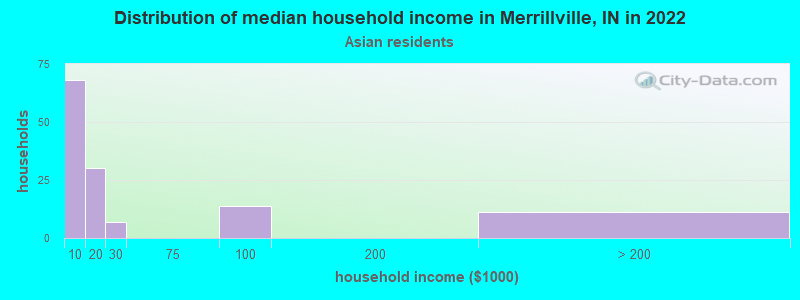
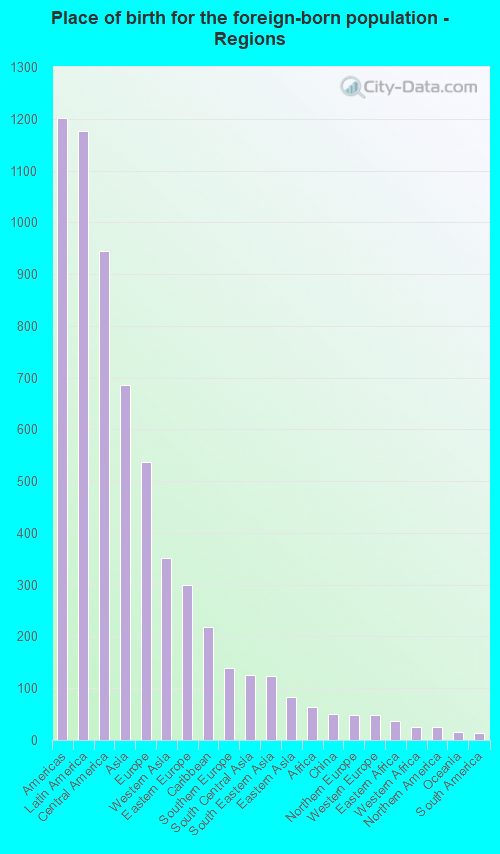
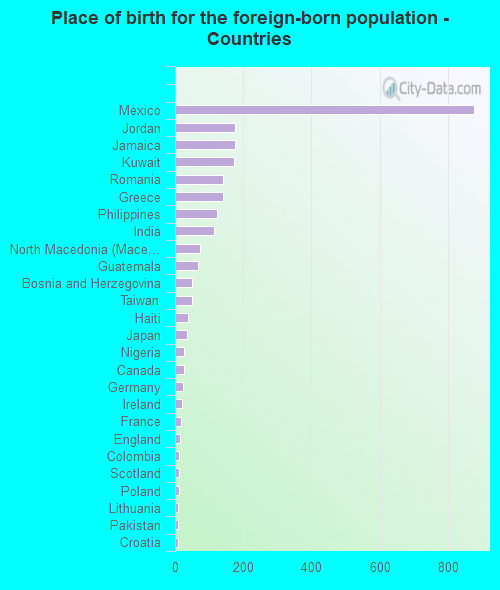
According to 2022 data, the most numerous races in Merrillville, IN are White alone (11,539 residents), Black alone (16,546 residents), and Hispanic (6,524 residents). 85.9% of Merrillville residents speak English at home. 6.9% of Merrillville, IN residents are foreign-born (3.0% born in Latin America, 1.7% born in Asia, 1.4% born in Europe), which is 12.9% greater than the foreign-born rate of 6.0% across the entire state of Indiana.
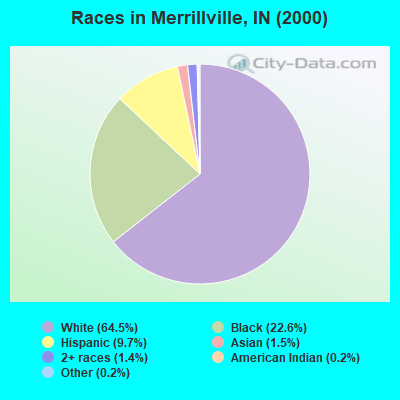
Race distribution in Merrillville
2000 2022
5,219,373 85.8% White alone 505,462 8.3% Black alone 214,536 3.5% Hispanic 61,115 1.0% Two or more races 58,424 1.0% Asian alone 13,654 0.2% American Indian alone 6,348 0.1% Other race alone 1,573 0.03% Native Hawaiian and Other
5,192,455 76.0% White alone 628,054 9.2% Black alone 534,528 7.8% Hispanic 263,242 3.9% Two or more races 172,880 2.5% Asian alone 33,467 0.5% Other race alone 5,866 0.09% American Indian alone 2,545 0.04% Native Hawaiian and Other
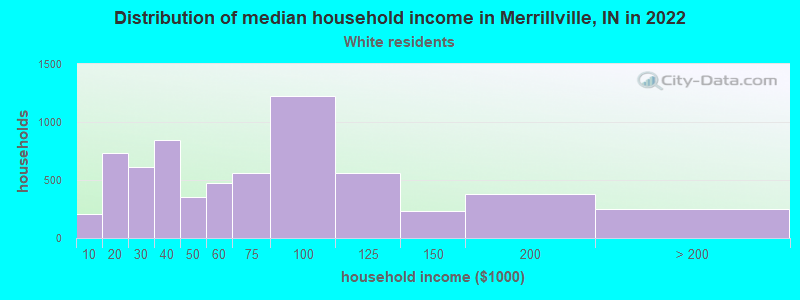
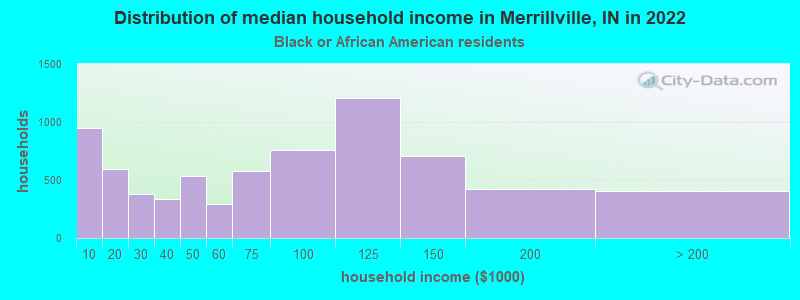
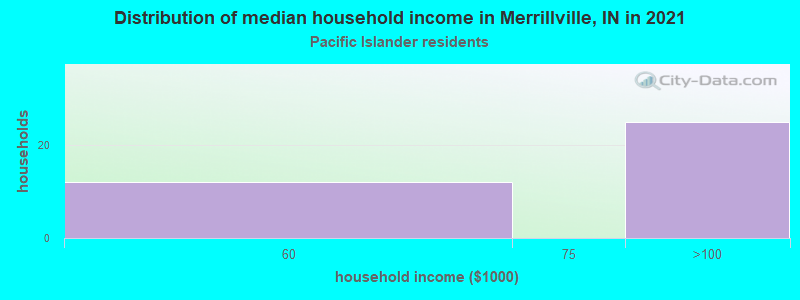
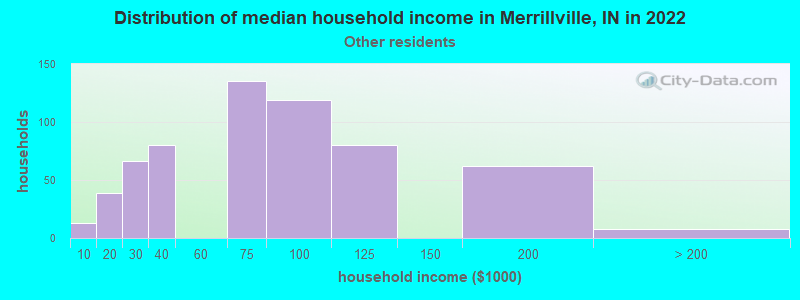
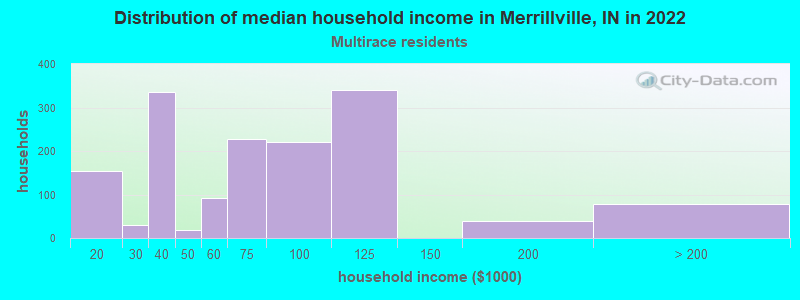
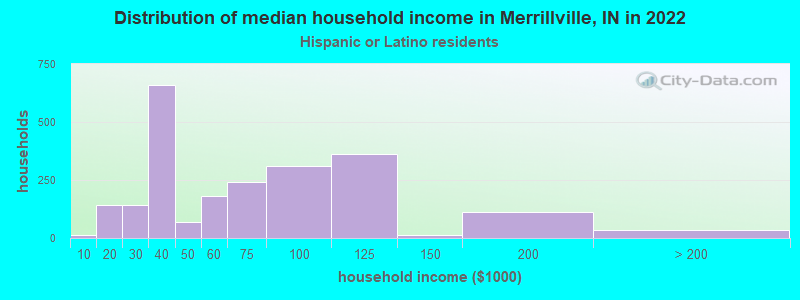
Income and house value in Merrillville Median household income in 2022 $59,909 White non-Hispanic householders$70,127 Black householders$72,931 Some other race householders$62,267 Two or more races householders$56,975 Hispanic or Latino race householdersMedian 2022 house value $200,022 White Non-Hispanic householders$220,145 Black or African American householders$226,383 American Indian or Alaska Native householders $270,050 Asian householders$203,040 Some other race householders$178,088 Two or more races householders$197,205 Hispanic or Latino householders
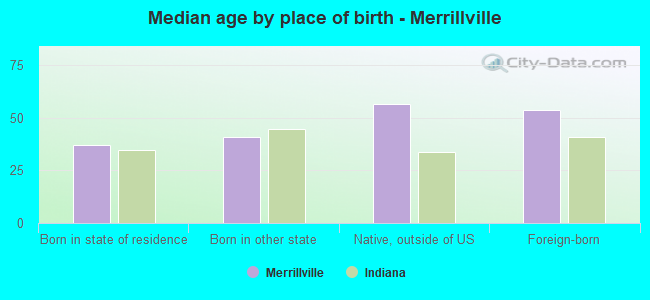
Median age by race in Merrillville
49.1 Median age for White residents42.6 50.9 37.5 Median age for Black or African American residents32.8 42.3 -483,210,482.7 Median age for American Indian / Alaska Native residents-531,041,069.2 -482,477,587.1 32.0 Median age for Asian residents24.9 40.4 -664,335,663.7 Median age for Native Hawaiian / Pacific Islander residents-644,025,156.6 -664,437,011.6 40.1 Median age for Other race residents45.5 34.7 26.0 Median age for Two or more races residents29.1 24.0 50.4 Median age for White alone residents44.2 57.5 30.7 Median age for Hispanic or Latino residents35.8 24.9
Owner/renter occupied households by race in Merrillville
House owners and renters - White residents 4,645 72.8% Owner occupied1,736 27.2% Renter occupiedHouse owners and renters - Black or African American residents 3,921 59.3% Owner occupied2,695 40.7% Renter occupiedHouse owners and renters - American Indian / Alaska Native residents 16 100.0% Owner occupiedHouse owners and renters - Asian residents 40 28.9% Owner occupied97 71.1% Renter occupiedHouse owners and renters - Native Hawaiian / Pacific Islander residents 22 74.0% Owner occupied8 26.0% Renter occupiedHouse owners and renters - Other race residents 445 65.0% Owner occupied239 35.0% Renter occupiedHouse owners and renters - Two or more races residents 1,249 83.9% Owner occupied240 16.1% Renter occupiedHouse owners and renters - White alone residents 4,189 72.1% Owner occupied1,621 27.9% Renter occupiedHouse owners and renters - Hispanic or Latino residents 1,741 82.0% Owner occupied383 18.0% Renter occupied
Language usage in Merrillville
English speakers - Total 85.9% of residents of Merrillville speak English at home.
8.6% of residents speak Spanish at home 2,637 89.1% Speak English very well323 10.9% Speak English less than very well5.7% of residents speak other language at home 1,364 69.9% Speak English very well586 30.1% Speak English less than very well
English speakers - Born in the United States 91.3% of residents of Merrillville speak English at home.
6.5% of residents speak Spanish at home 849 92.4% Speak English very well70 7.6% Speak English less than very well2.0% of residents speak other language at home 284 100.0% Speak English very well
English speakers - Native, born elsewhere 24.4% of residents of Merrillville speak English at home.
72.4% of residents speak Spanish at home 75 66.4% Speak English very well38 33.6% Speak English less than very well
English speakers - Foreign-born 21.0% of residents of Merrillville speak English at home.
36.0% of residents speak Spanish at home 697 79.8% Speak English very well176 20.2% Speak English less than very well45.9% of residents speak other language at home 588 52.7% Speak English very well527 47.3% Speak English less than very well
White (Caucasian) - Speak only English Native:
89.3% (10,100)Foreign-born:
25.2% (296)
White (Caucasian) - Speak another language Native:
10.4% (1,172)Foreign-born:
72.9% (855)
Black or African American - Speak only English Native:
98.8% (15,469)Foreign-born:
14.1% (47)
Black or African American - Speak another language Native:
1.2% (186)Foreign-born:
62.9% (208)
Native Hawaiian / Pacific Islander - Speak another language Native:
100.0% (21)Foreign-born:
100.0% (7)
Other race - Speak another language Native:
40.8% (565)Foreign-born:
97.6% (265)
Two or more races - Speak only English Native:
74.4% (2,946)Foreign-born:
20.9% (63)
Two or more races - Speak another language Native:
19.7% (779)Foreign-born:
77.1% (230)
White alone - Speak only English Native:
93.8% (9,680)Foreign-born:
32.0% (285)
White alone - Speak another language Native:
6.9% (713)Foreign-born:
58.1% (517)
Hispanic or Latino - Speak only English Native:
61.1% (3,048)Foreign-born:
4.4% (39)
Hispanic or Latino - Speak another language Native:
38.6% (1,925)Foreign-born:
95.6% (854)
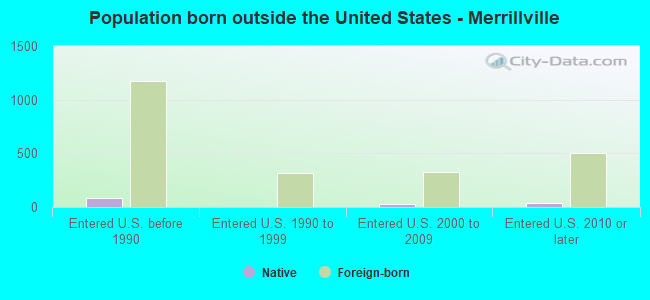
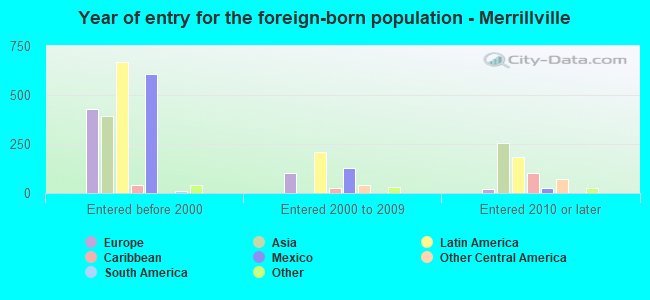
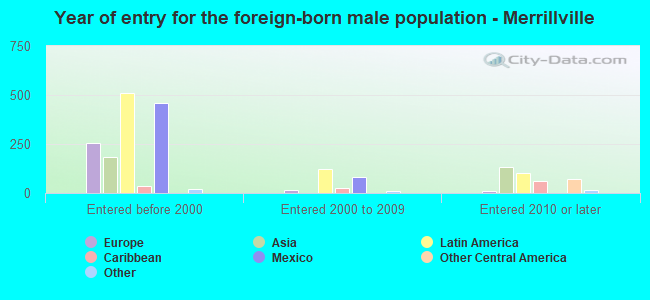
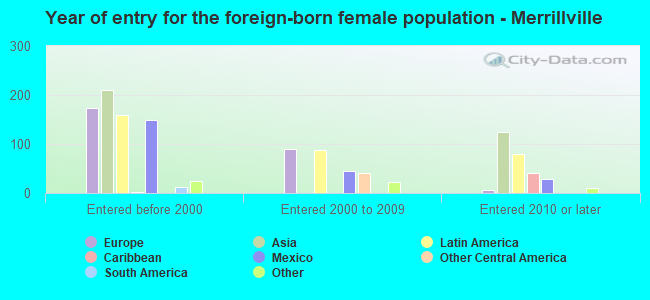
Foreign-born residents in Merrillville 2,504 residents are foreign born (3.0% Latin America , 1.7% Asia , 1.4% Europe ).
This city:
6.9%Indiana:
5.6%
Marital status for residents in Merrillville Marital status - White (Caucasian) population 15 years and over
Males 37.7% Never married45.2% Now married0.1% Separated6.4% Widowed10.6% DivorcedFemales 24.5% Never married42.0% Now married1.6% Separated17.9% Widowed14.1% DivorcedWomen who gave birth in the past 12 months Now married:
93.7% (125)Unmarried:
6.3% (8)
Women who did not give birth in the past 12 months Now married:
40.9% (994)Unmarried:
59.1% (1,434)
Marital status - Black or African American population 15 years and over
Males 46.4% Never married35.5% Now married1.4% Separated1.4% Widowed15.4% DivorcedFemales 46.7% Never married26.0% Now married1.8% Separated9.2% Widowed16.3% DivorcedWomen who gave birth in the past 12 months Now married:
43.9% (99)Unmarried:
56.1% (126)
Women who did not give birth in the past 12 months Now married:
24.5% (967)Unmarried:
75.5% (2,979)
Marital status - American Indian / Alaska Native population 15 years and over
Males 100.0% Never married0.0% Now married0.0% Separated0.0% Widowed0.0% DivorcedFemales 0.0% Never married100.0% Now married0.0% Separated0.0% Widowed0.0% DivorcedWomen who did not give birth in the past 12 months Now married:
100.0% (17)Unmarried:
0.0% (0)
Marital status - Asian population 15 years and over
Males 79.4% Never married14.7% Now married0.0% Separated5.9% Widowed0.0% DivorcedFemales 0.0% Never married77.9% Now married0.0% Separated22.1% Widowed0.0% DivorcedWomen who did not give birth in the past 12 months Now married:
100.0% (76)Unmarried:
0.0% (0)
Marital status - Other race population 15 years and over
Males 29.2% Never married48.2% Now married4.0% Separated10.2% Widowed8.4% DivorcedFemales 44.7% Never married41.7% Now married0.0% Separated6.4% Widowed7.2% DivorcedWomen who did not give birth in the past 12 months Now married:
40.5% (196)Unmarried:
59.5% (288)
Marital status - Two or more races population 15 years and over
Males 53.6% Never married25.0% Now married2.9% Separated2.0% Widowed16.4% DivorcedFemales 43.2% Never married27.0% Now married1.6% Separated12.3% Widowed15.9% DivorcedWomen who gave birth in the past 12 months Now married:
46.2% (102)Unmarried:
53.8% (118)
Women who did not give birth in the past 12 months Now married:
25.6% (243)Unmarried:
74.4% (706)
Marital status - White alone, not Hispanic / Latino population 15 years and over
Males 39.4% Never married41.9% Now married0.1% Separated6.9% Widowed11.6% DivorcedFemales 22.3% Never married40.9% Now married1.8% Separated19.1% Widowed15.9% DivorcedWomen who gave birth in the past 12 months Now married:
89.0% (71)Unmarried:
11.0% (9)
Women who did not give birth in the past 12 months Now married:
39.7% (792)Unmarried:
60.3% (1,201)
Marital status - Hispanic or Latino population 15 years and over
Males 39.5% Never married42.1% Now married3.4% Separated5.0% Widowed10.0% DivorcedFemales 43.4% Never married43.6% Now married0.0% Separated9.5% Widowed3.5% DivorcedWomen who gave birth in the past 12 months Now married:
85.5% (118)Unmarried:
14.5% (20)
Women who did not give birth in the past 12 months Now married:
39.9% (601)Unmarried:
60.1% (904)
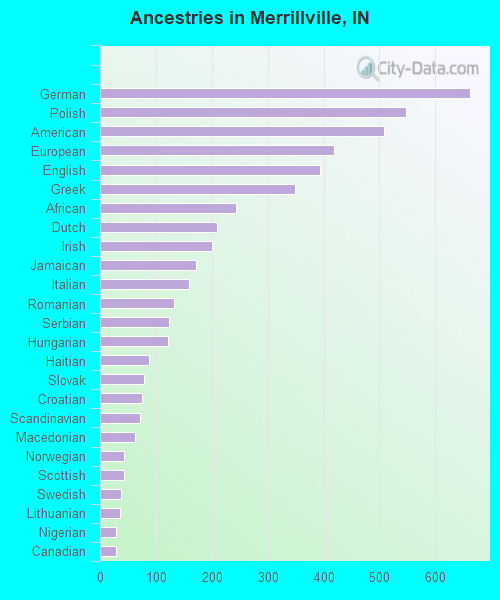
Ancestries in Merrillville
663 3.0% German548 2.5% Polish509 2.3% American418 1.9% European393 1.8% English349 1.6% Greek243 1.1% African210 0.9% Dutch201 0.9% Irish171 0.8% Jamaican160 0.7% Italian132 0.6% Romanian124 0.6% Serbian121 0.5% Hungarian88 0.4% Haitian79 0.4% Slovak75 0.3% Croatian71 0.3% Scandinavian62 0.3% Macedonian43 0.2% Norwegian43 0.2% Scottish37 0.2% Swedish35 0.2% Lithuanian29 0.1% Nigerian28 0.1% Canadian21 0.09% Russian19 0.09% Ukrainian16 0.07% Lebanese16 0.07% British12 0.05% Somali9 0.04% Scotch-Irish6 0.03% French6 0.03% Ethiopian6 0.03% Yugoslavian2 0.01% West Indian
Geographical mobility in Merrillville Same house 1 year ago 12,082 93.4% White (Caucasian)15,163 90.7% Black or African American32 100.0% American Indian / Alaska Native163 47.2% Asian28 100.0% Native Hawaiian / Pacific Islander1,673 92.0% Other race4,486 94.2% Two or more races10,796 94.0% White alone, not Hispanic / Latino6,043 95.3% Hispanic or LatinoMoved within same county 498 3.9% White / Caucasian1,590 9.5% Black or African American100 5.5% Other race353 7.4% Two or more races391 3.4% White alone, not Hispanic / Latino346 5.5% Hispanic or LatinoMoved within same state 33 0.3% White / Caucasian26 0.2% Black or African American54 15.6% Asian34 0.3% White alone, not Hispanic / LatinoMoved from different state 325 2.5% White / Caucasian125 0.8% Black or African American89 26.0% Asian29 1.6% Other race15 0.3% Two or more races278 2.4% White alone, not Hispanic / Latino61 1.0% Hispanic or LatinoMoved from abroad 10 0.1% White22 0.1% Black or African American52 15.0% Asian104 5.7% Other race10 0.1% White alone, not Hispanic / Latino
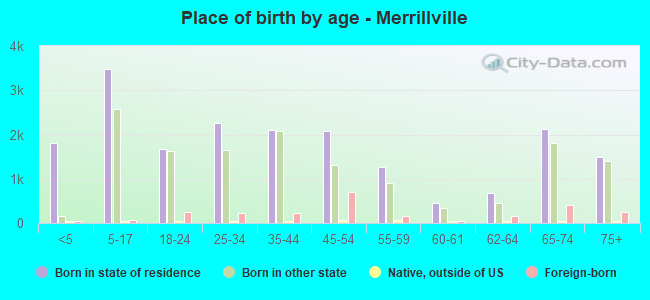
Children Nativity (place of birth) in Merrillville
Children under 6 years - Living with two parents Both parents native 855 100.0% NativeBoth parents foreign-born 161 95.8% Native7 4.2% Foreign-bornOne native, one foreign-born parent 22 100.0% NativeChildren under 6 years - Living with one parent Native parent 1,063 100.0% NativeForeign-born parent 41 100.0% NativeChildren 6 to 17 years - Living with two parents Both parents native 2,396 99.6% Native9 0.4% Foreign-bornBoth parents foreign-born 625 91.1% Native61 8.9% Foreign-bornOne native, one foreign-born parent 179 91.3% Native17 8.7% Foreign-bornChildren 6 to 17 years - Living with one parent Native parent 2,236 100.0% NativeForeign-born parent 56 47.4% Native62 52.6% Foreign-born
Grandparents responsible for own grandchildren in Merrillville
Grandparents (30 to 59 years) White / Caucasian 30 49.0% Responsible for grandchildren31 51.0% Not responsible for grandchildrenBlack or African American 52 26.8% Responsible for grandchildren142 73.2% Not responsible for grandchildrenTwo or more races 288 100.0% Responsible for grandchildrenWhite alone, not Hispanic / Latino 31 77.8% Responsible for grandchildren9 22.2% Not responsible for grandchildrenHispanic or Latino 292 89.8% Responsible for grandchildren33 10.2% Not responsible for grandchildrenGrandparents (60 years and over) White / Caucasian 89 54.5% Responsible for grandchildren74 45.5% Not responsible for grandchildrenBlack or African American 46 28.6% Responsible for grandchildren113 71.4% Not responsible for grandchildrenTwo or more races 22 100.0% Not responsible for grandchildrenWhite alone, not Hispanic / Latino 95 56.8% Responsible for grandchildren72 43.2% Not responsible for grandchildren