Races in Metuchen, New Jersey (NJ) Detailed Stats
Data:
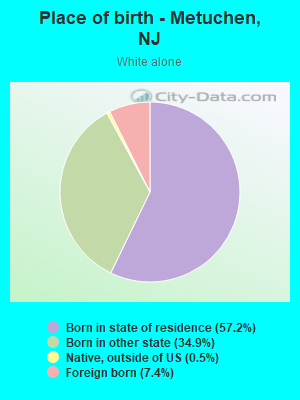
Races - White alone (%)
Races - White alone (% change since 2000)
Races - Black alone (%)
Races - Black alone (% change since 2000)
Races - American Indian alone (%)
Races - American Indian alone (% change since 2000)
Races - Asian alone (%)
Races - Asian alone (% change since 2000)
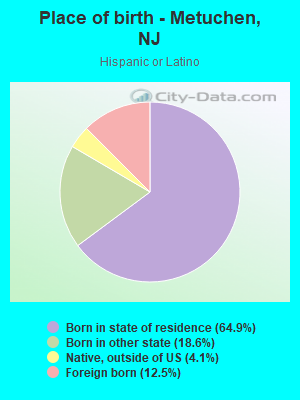
Races - Hispanic (%)
Races - Hispanic (% change since 2000)
Races - Native Hawaiian and Other Pacific Islander alone (%)
Races - Native Hawaiian and Other Pacific Islander alone (% change since 2000)
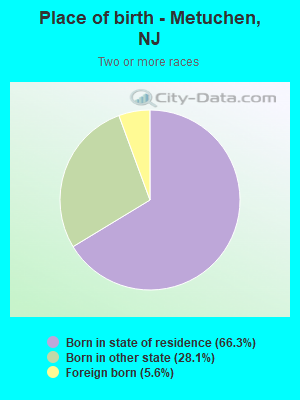
Races - Two or more races(%)
Races - Two or more races(% change since 2000)
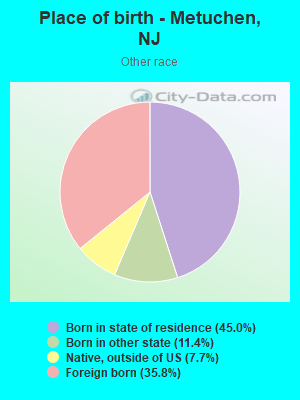
Races - Other race alone (%)
Races - Other race alone (% change since 2000)
Racial diversity
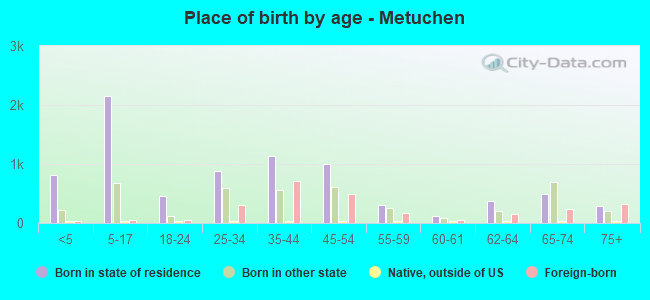
Place of birth - Born in state of residence (%)
Place of birth - Born in state of residence (%) - White
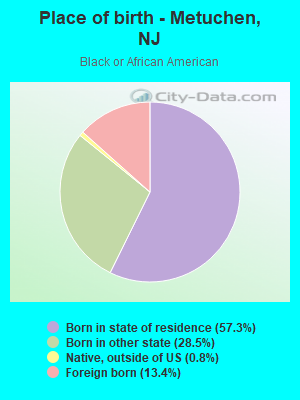
Place of birth - Born in state of residence (%) - Black or African American
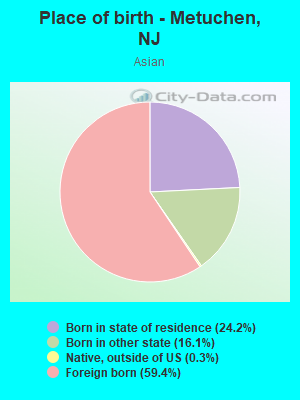
Place of birth - Born in state of residence (%) - Asian
Place of birth - Born in state of residence (%) - Hispanic or Latino
Place of birth - Born in state of residence (%) - American Indian and Alaska Native
Place of birth - Born in state of residence (%) - Multirace
Place of birth - Born in state of residence (%) - Other Race
Place of birth - Born in other state (%)
Place of birth - Born in other state (%) - White
Place of birth - Born in other state (%) - Black or African American
Place of birth - Born in other state (%) - Asian
Place of birth - Born in other state (%) - Hispanic or Latino
Place of birth - Born in other state (%) - American Indian and Alaska Native
Place of birth - Born in other state (%) - Multirace
Place of birth - Born in other state (%) - Other Race
Place of birth - Native, outside of US (%)
Place of birth - Native, outside of US (%) - White
Place of birth - Native, outside of US (%) - Black or African American
Place of birth - Native, outside of US (%) - Asian
Place of birth - Native, outside of US (%) - Hispanic or Latino
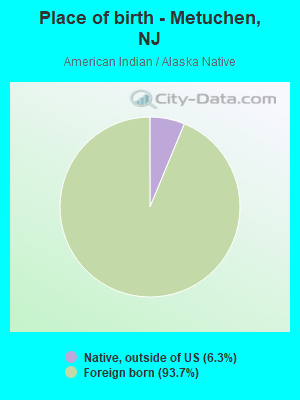
Place of birth - Native, outside of US (%) - American Indian and Alaska Native
Place of birth - Native, outside of US (%) - Multirace
Place of birth - Native, outside of US (%) - Other Race
Place of birth - Foreign born (%)
Place of birth - Foreign born (%) - White
Place of birth - Foreign born (%) - Black or African American
Place of birth - Foreign born (%) - Asian
Place of birth - Foreign born (%) - Hispanic or Latino
Place of birth - Foreign born (%) - American Indian and Alaska Native
Place of birth - Foreign born (%) - Multirace
Place of birth - Foreign born (%) - Other Race
Residents speaking English at home (%)
Residents speaking English at home - Born in the United States (%)
Residents speaking English at home - Native, born elsewhere (%)
Residents speaking English at home - Foreign born (%)
Residents speaking Spanish at home (%)
Residents speaking Spanish at home - Born in the United States (%)
Residents speaking Spanish at home - Native, born elsewhere (%)
Residents speaking Spanish at home - Foreign born (%)
Residents speaking other language at home (%)
Residents speaking other language at home - Born in the United States (%)
Residents speaking other language at home - Native, born elsewhere (%)
Residents speaking other language at home - Foreign born (%)
Marital status - Never married (%)
Marital status - Now married (%)
Marital status - Separated (%)
Marital status - Widowed (%)
Marital status - Divorced (%)
Ancestries Reported - Arab (%)
Ancestries Reported - Czech (%)
Ancestries Reported - Danish (%)
Ancestries Reported - Dutch (%)
Ancestries Reported - English (%)
Ancestries Reported - French (%)
Ancestries Reported - French Canadian (%)
Ancestries Reported - German (%)
Ancestries Reported - Greek (%)
Ancestries Reported - Hungarian (%)
Ancestries Reported - Irish (%)
Ancestries Reported - Italian (%)
Ancestries Reported - Lithuanian (%)
Ancestries Reported - Norwegian (%)
Ancestries Reported - Polish (%)
Ancestries Reported - Portuguese (%)
Ancestries Reported - Russian (%)
Ancestries Reported - Scotch-Irish (%)
Ancestries Reported - Scottish (%)
Ancestries Reported - Slovak (%)
Ancestries Reported - Subsaharan African (%)
Ancestries Reported - Swedish (%)
Ancestries Reported - Swiss (%)
Ancestries Reported - Ukrainian (%)
Ancestries Reported - United States (%)
Ancestries Reported - Welsh (%)
Ancestries Reported - West Indian (%)
Ancestries Reported - Other (%)
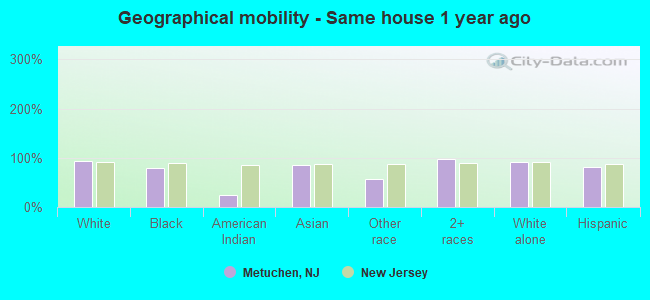
Geographical mobility - Same house 1 year ago (%)
Geographical mobility - Same house 1 year ago (%) - White
Geographical mobility - Same house 1 year ago (%) - Black or African American
Geographical mobility - Same house 1 year ago (%) - Asian
Geographical mobility - Same house 1 year ago (%) - Hispanic or Latino
Geographical mobility - Same house 1 year ago (%) - American Indian and Alaska Native
Geographical mobility - Same house 1 year ago (%) - Multirace
Geographical mobility - Same house 1 year ago (%) - Other Race
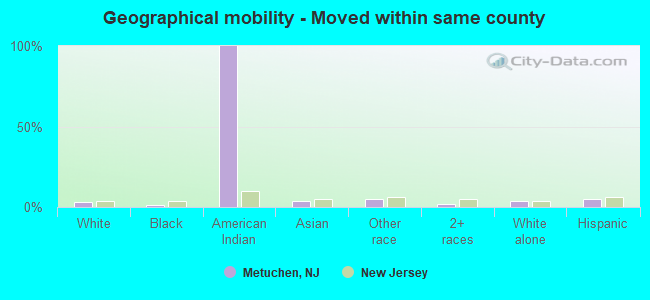
Geographical mobility - Moved within same county (%)
Geographical mobility - Moved within same county (%) - White
Geographical mobility - Moved within same county (%) - Black or African American
Geographical mobility - Moved within same county (%) - Asian
Geographical mobility - Moved within same county (%) - Hispanic or Latino
Geographical mobility - Moved within same county (%) - American Indian and Alaska Native
Geographical mobility - Moved within same county (%) - Multirace
Geographical mobility - Moved within same county (%) - Other Race
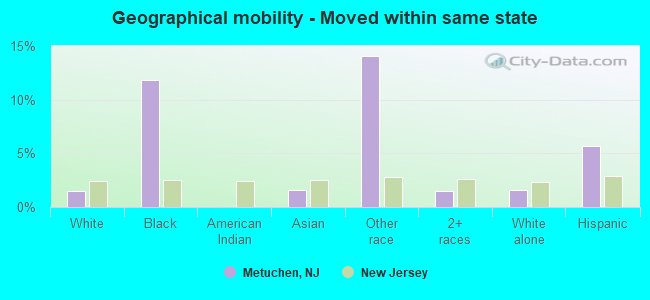
Geographical mobility - Moved from different county within same state (%)
Geographical mobility - Moved from different county within same state (%) - White
Geographical mobility - Moved from different county within same state (%) - Black or African American
Geographical mobility - Moved from different county within same state (%) - Asian
Geographical mobility - Moved from different county within same state (%) - Hispanic or Latino
Geographical mobility - Moved from different county within same state (%) - American Indian and Alaska Native
Geographical mobility - Moved from different county within same state (%) - Multirace
Geographical mobility - Moved from different county within same state (%) - Other Race
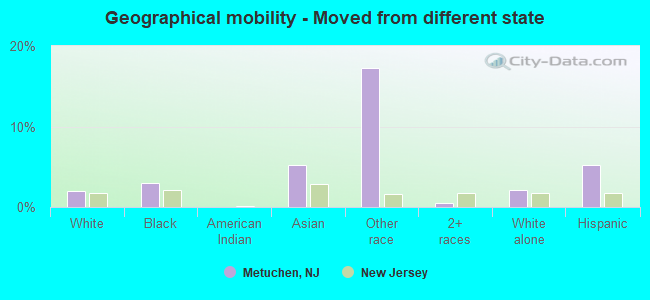
Geographical mobility - Moved from different state (%)
Geographical mobility - Moved from different state (%) - White
Geographical mobility - Moved from different state (%) - Black or African American
Geographical mobility - Moved from different state (%) - Asian
Geographical mobility - Moved from different state (%) - Hispanic or Latino
Geographical mobility - Moved from different state (%) - American Indian and Alaska Native
Geographical mobility - Moved from different state (%) - Multirace
Geographical mobility - Moved from different state (%) - Other Race
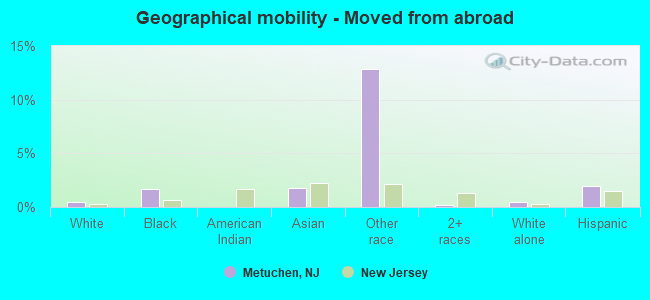
Geographical mobility - Moved from abroad (%)
Geographical mobility - Moved from abroad (%) - White
Geographical mobility - Moved from abroad (%) - Black or African American
Geographical mobility - Moved from abroad (%) - Asian
Geographical mobility - Moved from abroad (%) - Hispanic or Latino
Geographical mobility - Moved from abroad (%) - American Indian and Alaska Native
Geographical mobility - Moved from abroad (%) - Multirace
Geographical mobility - Moved from abroad (%) - Other Race
Place of birth for the foreign-born population - Ireland (%)
Place of birth for the foreign-born population - Denmark (%)
Place of birth for the foreign-born population - Norway (%)
Place of birth for the foreign-born population - Sweden (%)
Place of birth for the foreign-born population - United Kingdom (%)
Place of birth for the foreign-born population - England (%)
Place of birth for the foreign-born population - Scotland (%)
Place of birth for the foreign-born population - Other Northern Europe (%)
Place of birth for the foreign-born population - Austria (%)
Place of birth for the foreign-born population - Belgium (%)
Place of birth for the foreign-born population - France (%)
Place of birth for the foreign-born population - Germany (%)
Place of birth for the foreign-born population - Netherlands (%)
Place of birth for the foreign-born population - Switzerland (%)
Place of birth for the foreign-born population - Other Western Europe (%)
Place of birth for the foreign-born population - Greece (%)
Place of birth for the foreign-born population - Italy (%)
Place of birth for the foreign-born population - Portugal (%)
Place of birth for the foreign-born population - Spain (%)
Place of birth for the foreign-born population - Other Southern Europe (%)
Place of birth for the foreign-born population - Albania (%)
Place of birth for the foreign-born population - Belarus (%)
Place of birth for the foreign-born population - Bosnia and Herzegovina (%)
Place of birth for the foreign-born population - Bulgaria (%)
Place of birth for the foreign-born population - Croatia (%)
Place of birth for the foreign-born population - Czechoslovakia (%)
Place of birth for the foreign-born population - Hungary (%)
Place of birth for the foreign-born population - Latvia (%)
Place of birth for the foreign-born population - Lithuania (%)
Place of birth for the foreign-born population - North Macedonia (Macedonia) (%)
Place of birth for the foreign-born population - Moldova (%)
Place of birth for the foreign-born population - Poland (%)
Place of birth for the foreign-born population - Romania (%)
Place of birth for the foreign-born population - Russia (%)
Place of birth for the foreign-born population - Serbia (%)
Place of birth for the foreign-born population - Ukraine (%)
Place of birth for the foreign-born population - Other Eastern Europe (%)
Place of birth for the foreign-born population - China (%)
Place of birth for the foreign-born population - Hong Kong (%)
Place of birth for the foreign-born population - Taiwan (%)
Place of birth for the foreign-born population - Japan (%)
Place of birth for the foreign-born population - Korea (%)
Place of birth for the foreign-born population - Other Eastern Asia (%)
Place of birth for the foreign-born population - Afghanistan (%)
Place of birth for the foreign-born population - Bangladesh (%)
Place of birth for the foreign-born population - India (%)
Place of birth for the foreign-born population - Iran (%)
Place of birth for the foreign-born population - Kazakhstan (%)
Place of birth for the foreign-born population - Nepal (%)
Place of birth for the foreign-born population - Pakistan (%)
Place of birth for the foreign-born population - Sri Lanka (%)
Place of birth for the foreign-born population - Uzbekistan (%)
Place of birth for the foreign-born population - Other South Central Asia (%)
Place of birth for the foreign-born population - Burma (%)
Place of birth for the foreign-born population - Cambodia (%)
Place of birth for the foreign-born population - Indonesia (%)
Place of birth for the foreign-born population - Laos (%)
Place of birth for the foreign-born population - Malaysia (%)
Place of birth for the foreign-born population - Philippines (%)
Place of birth for the foreign-born population - Singapore (%)
Place of birth for the foreign-born population - Thailand (%)
Place of birth for the foreign-born population - Vietnam (%)
Place of birth for the foreign-born population - Other South Eastern Asia (%)
Place of birth for the foreign-born population - Armenia (%)
Place of birth for the foreign-born population - Iraq (%)
Place of birth for the foreign-born population - Israel (%)
Place of birth for the foreign-born population - Jordan (%)
Place of birth for the foreign-born population - Kuwait (%)
Place of birth for the foreign-born population - Lebanon (%)
Place of birth for the foreign-born population - Saudi Arabia (%)
Place of birth for the foreign-born population - Syria (%)
Place of birth for the foreign-born population - Turkey (%)
Place of birth for the foreign-born population - Yemen (%)
Place of birth for the foreign-born population - Other Western Asia (%)
Place of birth for the foreign-born population - Eritrea (%)
Place of birth for the foreign-born population - Ethiopia (%)
Place of birth for the foreign-born population - Kenya (%)
Place of birth for the foreign-born population - Somalia (%)
Place of birth for the foreign-born population - Uganda (%)
Place of birth for the foreign-born population - Zimbabwe (%)
Place of birth for the foreign-born population - Other Eastern Africa (%)
Place of birth for the foreign-born population - Cameroon (%)
Place of birth for the foreign-born population - Congo (%)
Place of birth for the foreign-born population - Democratic Republic of Congo (Zaire) (%)
Place of birth for the foreign-born population - Other Middle Africa (%)
Place of birth for the foreign-born population - Egypt (%)
Place of birth for the foreign-born population - Morocco (%)
Place of birth for the foreign-born population - Sudan (%)
Place of birth for the foreign-born population - Other Northern Africa (%)
Place of birth for the foreign-born population - South Africa (%)
Place of birth for the foreign-born population - Other Southern Africa (%)
Place of birth for the foreign-born population - Cabo Verde (%)
Place of birth for the foreign-born population - Ghana (%)
Place of birth for the foreign-born population - Liberia (%)
Place of birth for the foreign-born population - Nigeria (%)
Place of birth for the foreign-born population - Senegal (%)
Place of birth for the foreign-born population - Sierra Leone (%)
Place of birth for the foreign-born population - Other Western Africa (%)
Place of birth for the foreign-born population - Australia (%)
Place of birth for the foreign-born population - New Zealand (%)
Place of birth for the foreign-born population - Fiji (%)
Place of birth for the foreign-born population - Micronesia (%)
Place of birth for the foreign-born population - Bahamas (%)
Place of birth for the foreign-born population - Barbados (%)
Place of birth for the foreign-born population - Cuba (%)
Place of birth for the foreign-born population - Dominica (%)
Place of birth for the foreign-born population - Dominican Republic (%)
Place of birth for the foreign-born population - Grenada (%)
Place of birth for the foreign-born population - Haiti (%)
Place of birth for the foreign-born population - Jamaica (%)
Place of birth for the foreign-born population - St. Vincent and the Grenadines (%)
Place of birth for the foreign-born population - Trinidad and Tobago (%)
Place of birth for the foreign-born population - West Indies (%)
Place of birth for the foreign-born population - Other Caribbean (%)
Place of birth for the foreign-born population - Belize (%)
Place of birth for the foreign-born population - Costa Rica (%)
Place of birth for the foreign-born population - El Salvador (%)
Place of birth for the foreign-born population - Guatemala (%)
Place of birth for the foreign-born population - Honduras (%)
Place of birth for the foreign-born population - Mexico (%)
Place of birth for the foreign-born population - Nicaragua (%)
Place of birth for the foreign-born population - Panama (%)
Place of birth for the foreign-born population - Other Central America (%)
Place of birth for the foreign-born population - Argentina (%)
Place of birth for the foreign-born population - Bolivia (%)
Place of birth for the foreign-born population - Brazil (%)
Place of birth for the foreign-born population - Chile (%)
Place of birth for the foreign-born population - Colombia (%)
Place of birth for the foreign-born population - Ecuador (%)
Place of birth for the foreign-born population - Guyana (%)
Place of birth for the foreign-born population - Peru (%)
Place of birth for the foreign-born population - Uruguay (%)
Place of birth for the foreign-born population - Venezuela (%)
Place of birth for the foreign-born population - Other South America (%)
Place of birth for the foreign-born population - Canada (%)
Place of birth for the foreign-born population - Other Northern America (%)
Place of birth for the foreign-born population - Other (%)
Latest news about races in Metuchen, NJ collected exclusively by city-data.com from local newspapers, TV, and radio stations
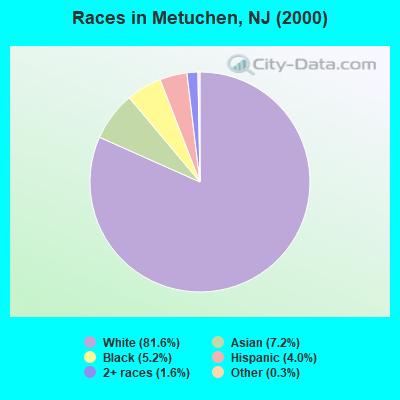
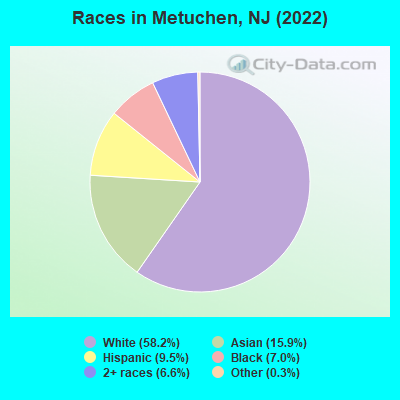
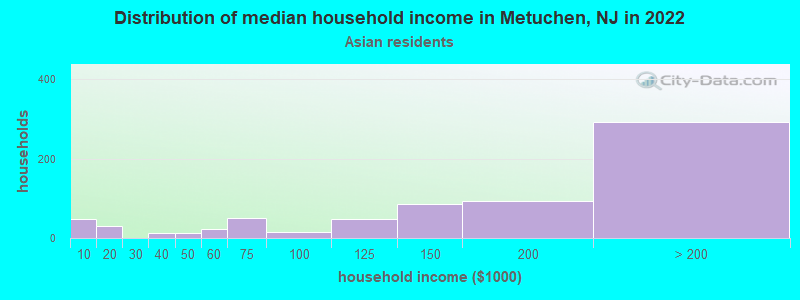
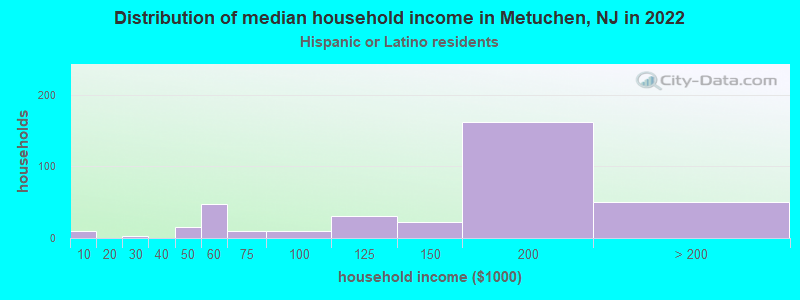
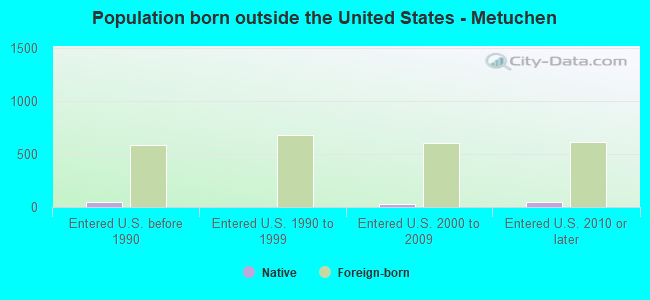
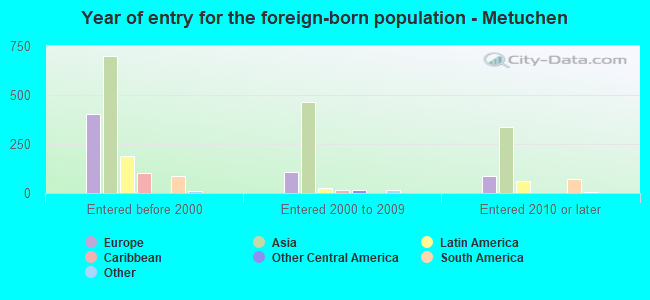
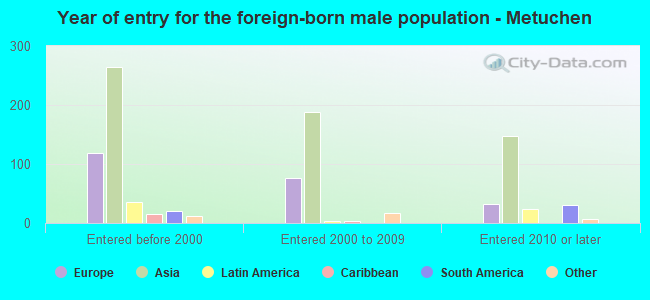
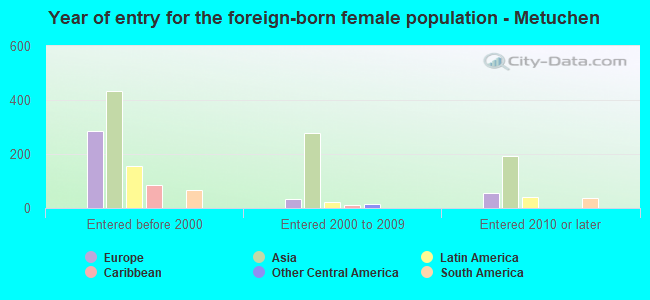
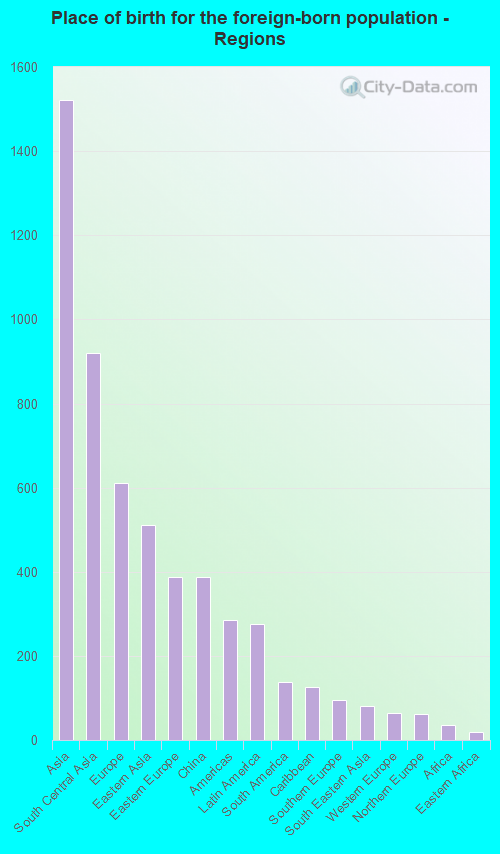
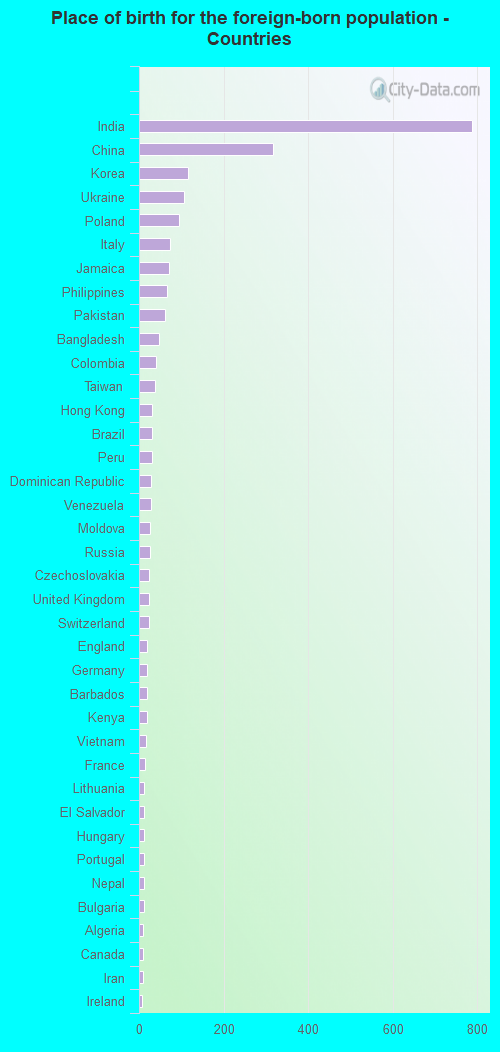
According to 2022 data, the most numerous races in Metuchen, NJ are White alone (8,711 residents), Hispanic (1,427 residents), and Black alone (1,045 residents). 77.6% of Metuchen residents speak English at home. 16.4% of Metuchen, NJ residents are foreign-born (10.0% born in Asia, 4.0% born in Europe, 1.8% born in Latin America), which is 40.3% less than the foreign-born rate of 23.0% across the entire state of New Jersey.
Race distribution in Metuchen
2000 2022
5,557,209 66.0% White alone 1,117,191 13.3% Hispanic 1,096,171 13.0% Black alone 477,012 5.7% Asian alone 133,689 1.6% Two or more races 19,565 0.2% Other race alone 11,338 0.1% American Indian alone 2,175 0.03% Native Hawaiian and Other
4,766,476 51.5% White alone 2,028,470 21.9% Hispanic 1,111,632 12.0% Black alone 923,546 10.0% Asian alone 332,237 3.6% Two or more races 89,847 1.0% Other race alone 8,557 0.09% American Indian alone 934 0.01% Native Hawaiian and Other
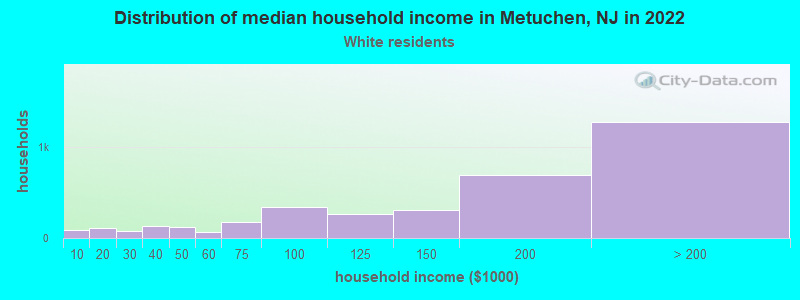
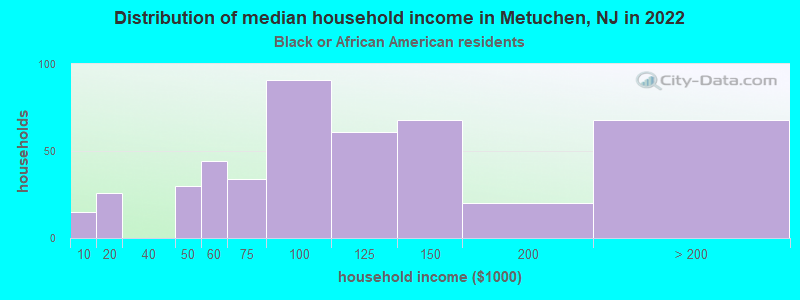
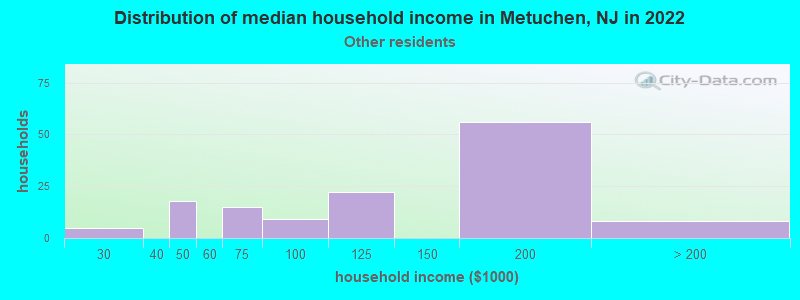
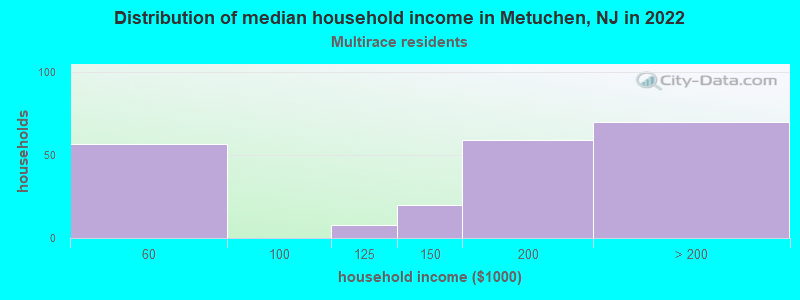
Income and house value in Metuchen Median household income in 2022 $156,621 White non-Hispanic householders$107,747 Black householders$153,818 Asian householders$105,806 Some other race householders$141,879 Two or more races householders$156,315 Hispanic or Latino race householdersMedian 2022 house value $574,515 White Non-Hispanic householders$536,038 Black or African American householders $597,719 Asian householders$582,152 Some other race householders$514,009 Two or more races householders$625,329 Hispanic or Latino householders
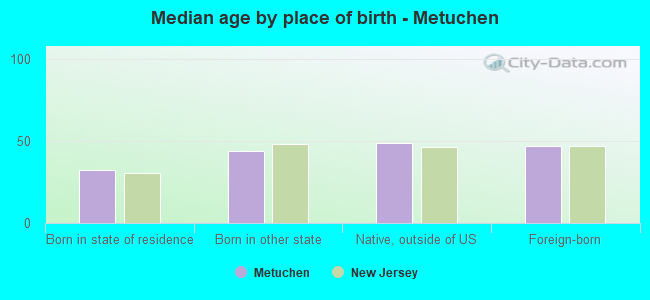
Median age by race in Metuchen
45.9 Median age for White residents44.5 47.6 41.4 Median age for Black or African American residents37.2 51.3 39.9 Median age for American Indian / Alaska Native residents-624,624,624.0 -739,999,999.3 38.2 Median age for Asian residents34.7 39.1 -939,393,938.5 Median age for Native Hawaiian / Pacific Islander residents-860,335,194.7 -713,070,378.3 35.4 Median age for Other race residents40.4 23.1 17.7 Median age for Two or more races residents14.4 25.8 45.8 Median age for White alone residents44.4 46.8 22.6 Median age for Hispanic or Latino residents15.4 28.1
Owner/renter occupied households by race in Metuchen
House owners and renters - White residents 2,920 80.3% Owner occupied718 19.7% Renter occupiedHouse owners and renters - Black or African American residents 255 58.6% Owner occupied180 41.4% Renter occupiedHouse owners and renters - American Indian / Alaska Native residents 13 100.0% Renter occupiedHouse owners and renters - Asian residents 585 80.0% Owner occupied147 20.0% Renter occupiedHouse owners and renters - Other race residents 99 67.5% Owner occupied48 32.5% Renter occupiedHouse owners and renters - Two or more races residents 124 59.4% Owner occupied85 40.6% Renter occupiedHouse owners and renters - White alone residents 2,976 78.3% Owner occupied827 21.7% Renter occupiedHouse owners and renters - Hispanic or Latino residents 241 64.8% Owner occupied131 35.2% Renter occupied
Language usage in Metuchen
English speakers - Total 77.6% of residents of Metuchen speak English at home.
4.1% of residents speak Spanish at home 369 64.3% Speak English very well205 35.7% Speak English less than very well18.3% of residents speak other language at home 1,839 72.1% Speak English very well710 27.9% Speak English less than very well
English speakers - Born in the United States 93.7% of residents of Metuchen speak English at home.
2.5% of residents speak Spanish at home 46 45.5% Speak English very well55 54.5% Speak English less than very well5.0% of residents speak other language at home 201 100.0% Speak English very well
English speakers - Native, born elsewhere 73.5% of residents of Metuchen speak English at home.
30.1% of residents speak Spanish at home 26 76.5% Speak English very well8 23.5% Speak English less than very well
English speakers - Foreign-born 19.3% of residents of Metuchen speak English at home.
7.1% of residents speak Spanish at home 101 56.4% Speak English very well78 43.6% Speak English less than very well71.9% of residents speak other language at home 1,102 60.9% Speak English very well709 39.1% Speak English less than very well
White (Caucasian) - Speak only English Native:
100.0% (7,631)Foreign-born:
38.2% (182)
White (Caucasian) - Speak another language Native:
2.7% (205)Foreign-born:
67.7% (322)
Black or African American - Speak only English Native:
96.1% (832)Foreign-born:
68.8% (98)
Black or African American - Speak another language Native:
4.3% (37)Foreign-born:
19.2% (27)
American Indian / Alaska Native - Speak only English Native:
69.1% (1)Foreign-born:
12.5% (2)
Asian - Speak only English Native:
42.2% (319)Foreign-born:
9.3% (132)
Asian - Speak another language Native:
57.8% (436)Foreign-born:
90.8% (1,291)
Other race - Speak another language Native:
43.9% (133)Foreign-born:
97.4% (186)
Two or more races - Speak only English Native:
78.2% (1,075)Foreign-born:
36.4% (37)
Two or more races - Speak another language Native:
21.0% (289)Foreign-born:
62.7% (64)
White alone - Speak only English Native:
99.0% (7,650)Foreign-born:
31.0% (198)
White alone - Speak another language Native:
2.3% (176)Foreign-born:
69.8% (445)
Hispanic or Latino - Speak another language Native:
33.1% (318)Foreign-born:
97.4% (166)
Foreign-born residents in Metuchen 2,455 residents are foreign born (10.0% Asia , 4.0% Europe , 1.8% Latin America ).
This city:
16.4%New Jersey:
23.2%
Marital status for residents in Metuchen Marital status - White (Caucasian) population 15 years and over
Males 22.5% Never married69.9% Now married0.2% Separated2.0% Widowed5.4% DivorcedFemales 20.0% Never married57.8% Now married2.4% Separated8.9% Widowed11.0% DivorcedWomen who gave birth in the past 12 months Now married:
100.0% (87)Unmarried:
0.0% (0)
Women who did not give birth in the past 12 months Now married:
58.8% (897)Unmarried:
41.2% (629)
Marital status - Black or African American population 15 years and over
Males 69.2% Never married26.9% Now married0.0% Separated0.0% Widowed3.8% DivorcedFemales 39.6% Never married17.8% Now married0.0% Separated14.7% Widowed27.9% DivorcedWomen who did not give birth in the past 12 months Now married:
15.7% (33)Unmarried:
84.3% (176)
Marital status - American Indian / Alaska Native population 15 years and over
Males 0.0% Never married100.0% Now married0.0% Separated0.0% Widowed0.0% DivorcedFemales 0.0% Never married100.0% Now married0.0% Separated0.0% Widowed0.0% DivorcedWomen who did not give birth in the past 12 months Now married:
100.0% (2)Unmarried:
0.0% (0)
Marital status - Asian population 15 years and over
Males 22.6% Never married72.9% Now married1.5% Separated1.5% Widowed1.4% DivorcedFemales 17.0% Never married71.5% Now married0.0% Separated7.6% Widowed3.9% DivorcedWomen who gave birth in the past 12 months Now married:
100.0% (59)Unmarried:
0.0% (0)
Women who did not give birth in the past 12 months Now married:
70.6% (481)Unmarried:
29.4% (200)
Marital status - Other race population 15 years and over
Males 44.4% Never married55.6% Now married0.0% Separated0.0% Widowed0.0% DivorcedFemales 56.5% Never married21.6% Now married0.0% Separated10.8% Widowed11.2% DivorcedWomen who gave birth in the past 12 months Now married:
100.0% (8)Unmarried:
0.0% (0)
Women who did not give birth in the past 12 months Now married:
15.6% (39)Unmarried:
84.4% (214)
Marital status - Two or more races population 15 years and over
Males 71.6% Never married25.3% Now married0.0% Separated3.1% Widowed0.0% DivorcedFemales 57.8% Never married33.7% Now married0.0% Separated6.6% Widowed1.9% DivorcedWomen who gave birth in the past 12 months Now married:
100.0% (16)Unmarried:
0.0% (0)
Women who did not give birth in the past 12 months Now married:
32.7% (190)Unmarried:
67.3% (390)
Marital status - White alone, not Hispanic / Latino population 15 years and over
Males 21.1% Never married71.2% Now married0.2% Separated2.0% Widowed5.5% DivorcedFemales 20.7% Never married56.7% Now married2.6% Separated9.1% Widowed11.0% DivorcedWomen who gave birth in the past 12 months Now married:
100.0% (56)Unmarried:
0.0% (0)
Women who did not give birth in the past 12 months Now married:
57.4% (956)Unmarried:
42.6% (711)
Marital status - Hispanic or Latino population 15 years and over
Males 61.4% Never married37.1% Now married0.0% Separated1.4% Widowed0.0% DivorcedFemales 37.9% Never married46.4% Now married0.0% Separated6.8% Widowed8.9% DivorcedWomen who gave birth in the past 12 months Now married:
100.0% (70)Unmarried:
0.0% (0)
Women who did not give birth in the past 12 months Now married:
37.5% (152)Unmarried:
62.5% (253)
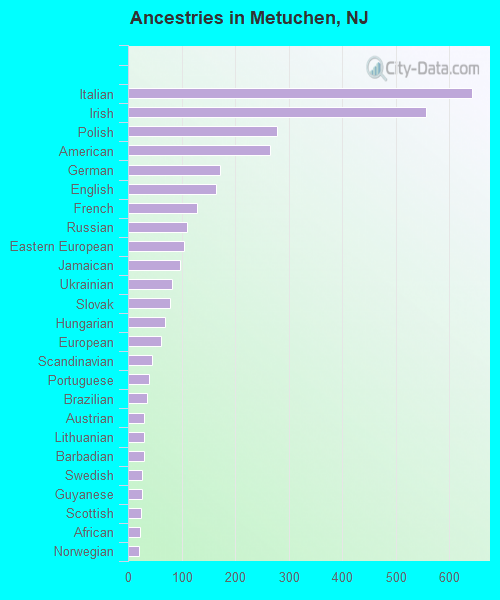
Ancestries in Metuchen
642 10.0% Italian557 8.6% Irish279 4.3% Polish265 4.1% American171 2.7% German164 2.5% English128 2.0% French111 1.7% Russian104 1.6% Eastern European98 1.5% Jamaican83 1.3% Ukrainian79 1.2% Slovak70 1.1% Hungarian62 1.0% European44 0.7% Scandinavian40 0.6% Portuguese35 0.5% Brazilian29 0.5% Austrian29 0.5% Lithuanian29 0.5% Barbadian27 0.4% Swedish26 0.4% Guyanese25 0.4% Scottish22 0.3% African20 0.3% Norwegian18 0.3% Kenyan13 0.2% Slavic10 0.2% Iranian10 0.2% Czech10 0.2% French Canadian9 0.1% Danish8 0.1% Finnish7 0.1% Greek7 0.1% Ghanaian6 0.09% Serbian6 0.09% Yugoslavian3 0.05% British3 0.05% Lebanese2 0.03% Trinidadian and Tobagonian
Geographical mobility in Metuchen Same house 1 year ago 7,571 92.8% White (Caucasian)866 79.5% Black or African American3 24.2% American Indian / Alaska Native2,037 85.9% Asian302 56.6% Other race1,695 97.2% Two or more races7,952 92.1% White alone, not Hispanic / Latino1,052 81.8% Hispanic or LatinoMoved within same county 264 3.2% White / Caucasian9 0.8% Black or African American13 100.0% American Indian / Alaska Native96 4.0% Asian26 4.9% Other race34 2.0% Two or more races304 3.5% White alone, not Hispanic / Latino61 4.7% Hispanic or LatinoMoved within same state 122 1.5% White / Caucasian129 11.8% Black or African American37 1.6% Asian75 14.0% Other race27 1.5% Two or more races137 1.6% White alone, not Hispanic / Latino73 5.7% Hispanic or LatinoMoved from different state 158 1.9% White / Caucasian32 3.0% Black or African American124 5.2% Asian92 17.2% Other race8 0.5% Two or more races186 2.2% White alone, not Hispanic / Latino68 5.3% Hispanic or LatinoMoved from abroad 38 0.5% White18 1.7% Black or African American41 1.7% Asian69 12.9% Other race3 0.1% Two or more races39 0.5% White alone, not Hispanic / Latino25 2.0% Hispanic or Latino
Children Nativity (place of birth) in Metuchen
Children under 6 years - Living with two parents Both parents native 587 100.0% NativeBoth parents foreign-born 181 94.2% Native11 5.8% Foreign-bornOne native, one foreign-born parent 420 100.0% NativeChildren under 6 years - Living with one parent Native parent 58 100.0% NativeForeign-born parent 14 100.0% NativeChildren 6 to 17 years - Living with two parents Both parents native 1,486 100.0% NativeBoth parents foreign-born 346 88.7% Native44 11.3% Foreign-bornOne native, one foreign-born parent 314 100.0% NativeChildren 6 to 17 years - Living with one parent Native parent 420 100.0% NativeForeign-born parent 66 52.6% Native59 47.4% Foreign-born
Grandparents responsible for own grandchildren in Metuchen
Grandparents (30 to 59 years) White / Caucasian 30 100.0% Responsible for grandchildrenAsian 1 10.0% Responsible for grandchildren8 90.0% Not responsible for grandchildrenWhite alone, not Hispanic / Latino 36 100.0% Responsible for grandchildrenGrandparents (60 years and over) White / Caucasian 31 38.3% Responsible for grandchildren50 61.7% Not responsible for grandchildrenAsian 21 22.0% Responsible for grandchildren75 78.0% Not responsible for grandchildrenWhite alone, not Hispanic / Latino 42 41.8% Responsible for grandchildren59 58.2% Not responsible for grandchildren