Races in Michigan City, Indiana (IN) Detailed Stats
Data:
Races - White alone (%)
Races - White alone (% change since 2000)
Races - Black alone (%)
Races - Black alone (% change since 2000)
Races - American Indian alone (%)
Races - American Indian alone (% change since 2000)
Races - Asian alone (%)
Races - Asian alone (% change since 2000)
Races - Hispanic (%)
Races - Hispanic (% change since 2000)
Races - Native Hawaiian and Other Pacific Islander alone (%)
Races - Native Hawaiian and Other Pacific Islander alone (% change since 2000)
Races - Two or more races(%)
Races - Two or more races(% change since 2000)
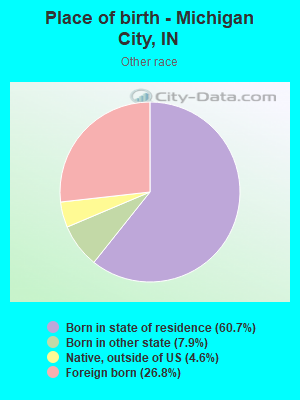
Races - Other race alone (%)
Races - Other race alone (% change since 2000)
Racial diversity
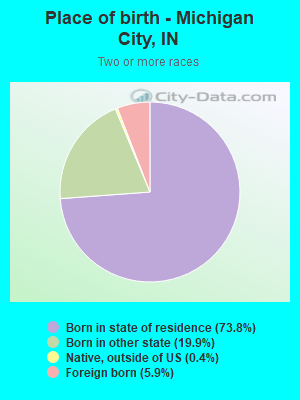
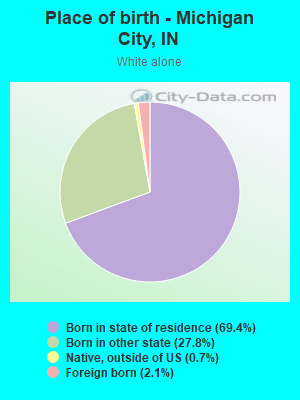
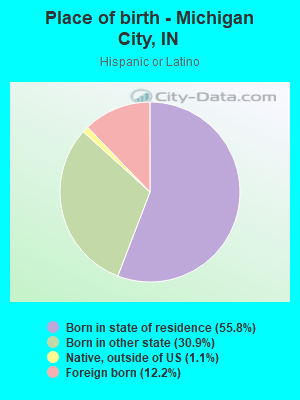
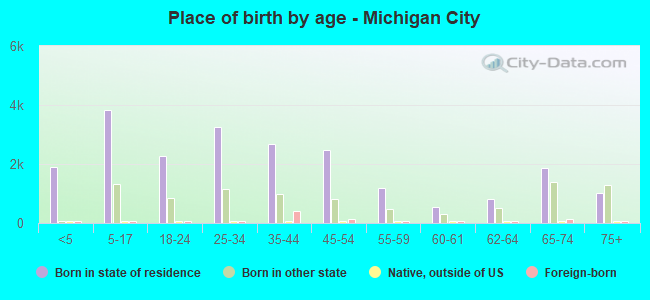
Place of birth - Born in state of residence (%)
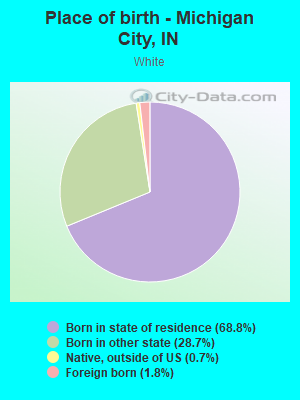
Place of birth - Born in state of residence (%) - White
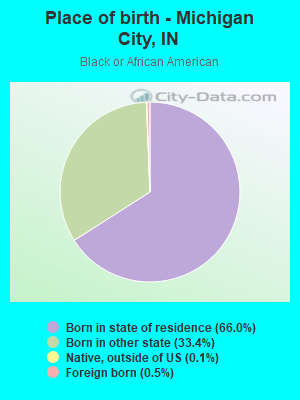
Place of birth - Born in state of residence (%) - Black or African American
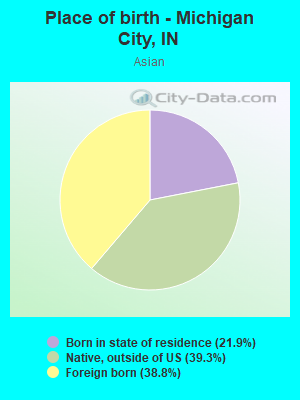
Place of birth - Born in state of residence (%) - Asian
Place of birth - Born in state of residence (%) - Hispanic or Latino
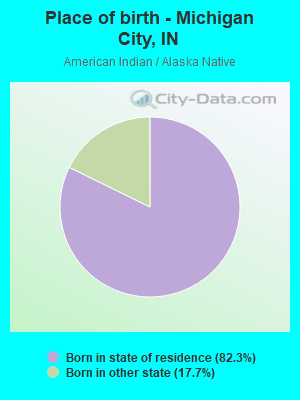
Place of birth - Born in state of residence (%) - American Indian and Alaska Native
Place of birth - Born in state of residence (%) - Multirace
Place of birth - Born in state of residence (%) - Other Race
Place of birth - Born in other state (%)
Place of birth - Born in other state (%) - White
Place of birth - Born in other state (%) - Black or African American
Place of birth - Born in other state (%) - Asian
Place of birth - Born in other state (%) - Hispanic or Latino
Place of birth - Born in other state (%) - American Indian and Alaska Native
Place of birth - Born in other state (%) - Multirace
Place of birth - Born in other state (%) - Other Race
Place of birth - Native, outside of US (%)
Place of birth - Native, outside of US (%) - White
Place of birth - Native, outside of US (%) - Black or African American
Place of birth - Native, outside of US (%) - Asian
Place of birth - Native, outside of US (%) - Hispanic or Latino
Place of birth - Native, outside of US (%) - American Indian and Alaska Native
Place of birth - Native, outside of US (%) - Multirace
Place of birth - Native, outside of US (%) - Other Race
Place of birth - Foreign born (%)
Place of birth - Foreign born (%) - White
Place of birth - Foreign born (%) - Black or African American
Place of birth - Foreign born (%) - Asian
Place of birth - Foreign born (%) - Hispanic or Latino
Place of birth - Foreign born (%) - American Indian and Alaska Native
Place of birth - Foreign born (%) - Multirace
Place of birth - Foreign born (%) - Other Race
Residents speaking English at home (%)
Residents speaking English at home - Born in the United States (%)
Residents speaking English at home - Native, born elsewhere (%)
Residents speaking English at home - Foreign born (%)
Residents speaking Spanish at home (%)
Residents speaking Spanish at home - Born in the United States (%)
Residents speaking Spanish at home - Native, born elsewhere (%)
Residents speaking Spanish at home - Foreign born (%)
Residents speaking other language at home (%)
Residents speaking other language at home - Born in the United States (%)
Residents speaking other language at home - Native, born elsewhere (%)
Residents speaking other language at home - Foreign born (%)
Marital status - Never married (%)
Marital status - Now married (%)
Marital status - Separated (%)
Marital status - Widowed (%)
Marital status - Divorced (%)
Ancestries Reported - Arab (%)
Ancestries Reported - Czech (%)
Ancestries Reported - Danish (%)
Ancestries Reported - Dutch (%)
Ancestries Reported - English (%)
Ancestries Reported - French (%)
Ancestries Reported - French Canadian (%)
Ancestries Reported - German (%)
Ancestries Reported - Greek (%)
Ancestries Reported - Hungarian (%)
Ancestries Reported - Irish (%)
Ancestries Reported - Italian (%)
Ancestries Reported - Lithuanian (%)
Ancestries Reported - Norwegian (%)
Ancestries Reported - Polish (%)
Ancestries Reported - Portuguese (%)
Ancestries Reported - Russian (%)
Ancestries Reported - Scotch-Irish (%)
Ancestries Reported - Scottish (%)
Ancestries Reported - Slovak (%)
Ancestries Reported - Subsaharan African (%)
Ancestries Reported - Swedish (%)
Ancestries Reported - Swiss (%)
Ancestries Reported - Ukrainian (%)
Ancestries Reported - United States (%)
Ancestries Reported - Welsh (%)
Ancestries Reported - West Indian (%)
Ancestries Reported - Other (%)
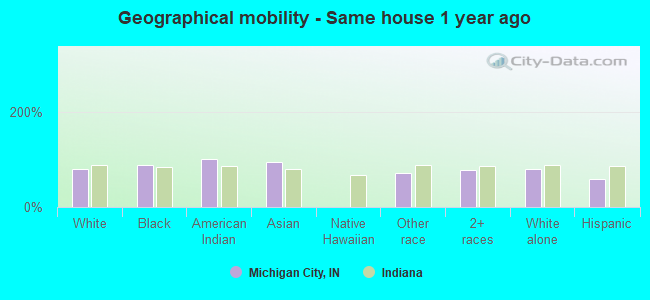
Geographical mobility - Same house 1 year ago (%)
Geographical mobility - Same house 1 year ago (%) - White
Geographical mobility - Same house 1 year ago (%) - Black or African American
Geographical mobility - Same house 1 year ago (%) - Asian
Geographical mobility - Same house 1 year ago (%) - Hispanic or Latino
Geographical mobility - Same house 1 year ago (%) - American Indian and Alaska Native
Geographical mobility - Same house 1 year ago (%) - Multirace
Geographical mobility - Same house 1 year ago (%) - Other Race
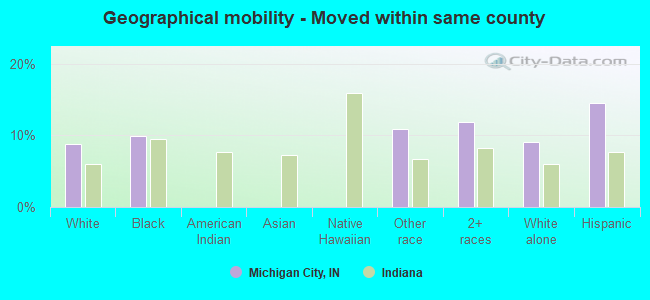
Geographical mobility - Moved within same county (%)
Geographical mobility - Moved within same county (%) - White
Geographical mobility - Moved within same county (%) - Black or African American
Geographical mobility - Moved within same county (%) - Asian
Geographical mobility - Moved within same county (%) - Hispanic or Latino
Geographical mobility - Moved within same county (%) - American Indian and Alaska Native
Geographical mobility - Moved within same county (%) - Multirace
Geographical mobility - Moved within same county (%) - Other Race
Geographical mobility - Moved from different county within same state (%)
Geographical mobility - Moved from different county within same state (%) - White
Geographical mobility - Moved from different county within same state (%) - Black or African American
Geographical mobility - Moved from different county within same state (%) - Asian
Geographical mobility - Moved from different county within same state (%) - Hispanic or Latino
Geographical mobility - Moved from different county within same state (%) - American Indian and Alaska Native
Geographical mobility - Moved from different county within same state (%) - Multirace
Geographical mobility - Moved from different county within same state (%) - Other Race
Geographical mobility - Moved from different state (%)
Geographical mobility - Moved from different state (%) - White
Geographical mobility - Moved from different state (%) - Black or African American
Geographical mobility - Moved from different state (%) - Asian
Geographical mobility - Moved from different state (%) - Hispanic or Latino
Geographical mobility - Moved from different state (%) - American Indian and Alaska Native
Geographical mobility - Moved from different state (%) - Multirace
Geographical mobility - Moved from different state (%) - Other Race
Geographical mobility - Moved from abroad (%)
Geographical mobility - Moved from abroad (%) - White
Geographical mobility - Moved from abroad (%) - Black or African American
Geographical mobility - Moved from abroad (%) - Asian
Geographical mobility - Moved from abroad (%) - Hispanic or Latino
Geographical mobility - Moved from abroad (%) - American Indian and Alaska Native
Geographical mobility - Moved from abroad (%) - Multirace
Geographical mobility - Moved from abroad (%) - Other Race
Place of birth for the foreign-born population - Ireland (%)
Place of birth for the foreign-born population - Denmark (%)
Place of birth for the foreign-born population - Norway (%)
Place of birth for the foreign-born population - Sweden (%)
Place of birth for the foreign-born population - United Kingdom (%)
Place of birth for the foreign-born population - England (%)
Place of birth for the foreign-born population - Scotland (%)
Place of birth for the foreign-born population - Other Northern Europe (%)
Place of birth for the foreign-born population - Austria (%)
Place of birth for the foreign-born population - Belgium (%)
Place of birth for the foreign-born population - France (%)
Place of birth for the foreign-born population - Germany (%)
Place of birth for the foreign-born population - Netherlands (%)
Place of birth for the foreign-born population - Switzerland (%)
Place of birth for the foreign-born population - Other Western Europe (%)
Place of birth for the foreign-born population - Greece (%)
Place of birth for the foreign-born population - Italy (%)
Place of birth for the foreign-born population - Portugal (%)
Place of birth for the foreign-born population - Spain (%)
Place of birth for the foreign-born population - Other Southern Europe (%)
Place of birth for the foreign-born population - Albania (%)
Place of birth for the foreign-born population - Belarus (%)
Place of birth for the foreign-born population - Bosnia and Herzegovina (%)
Place of birth for the foreign-born population - Bulgaria (%)
Place of birth for the foreign-born population - Croatia (%)
Place of birth for the foreign-born population - Czechoslovakia (%)
Place of birth for the foreign-born population - Hungary (%)
Place of birth for the foreign-born population - Latvia (%)
Place of birth for the foreign-born population - Lithuania (%)
Place of birth for the foreign-born population - North Macedonia (Macedonia) (%)
Place of birth for the foreign-born population - Moldova (%)
Place of birth for the foreign-born population - Poland (%)
Place of birth for the foreign-born population - Romania (%)
Place of birth for the foreign-born population - Russia (%)
Place of birth for the foreign-born population - Serbia (%)
Place of birth for the foreign-born population - Ukraine (%)
Place of birth for the foreign-born population - Other Eastern Europe (%)
Place of birth for the foreign-born population - China (%)
Place of birth for the foreign-born population - Hong Kong (%)
Place of birth for the foreign-born population - Taiwan (%)
Place of birth for the foreign-born population - Japan (%)
Place of birth for the foreign-born population - Korea (%)
Place of birth for the foreign-born population - Other Eastern Asia (%)
Place of birth for the foreign-born population - Afghanistan (%)
Place of birth for the foreign-born population - Bangladesh (%)
Place of birth for the foreign-born population - India (%)
Place of birth for the foreign-born population - Iran (%)
Place of birth for the foreign-born population - Kazakhstan (%)
Place of birth for the foreign-born population - Nepal (%)
Place of birth for the foreign-born population - Pakistan (%)
Place of birth for the foreign-born population - Sri Lanka (%)
Place of birth for the foreign-born population - Uzbekistan (%)
Place of birth for the foreign-born population - Other South Central Asia (%)
Place of birth for the foreign-born population - Burma (%)
Place of birth for the foreign-born population - Cambodia (%)
Place of birth for the foreign-born population - Indonesia (%)
Place of birth for the foreign-born population - Laos (%)
Place of birth for the foreign-born population - Malaysia (%)
Place of birth for the foreign-born population - Philippines (%)
Place of birth for the foreign-born population - Singapore (%)
Place of birth for the foreign-born population - Thailand (%)
Place of birth for the foreign-born population - Vietnam (%)
Place of birth for the foreign-born population - Other South Eastern Asia (%)
Place of birth for the foreign-born population - Armenia (%)
Place of birth for the foreign-born population - Iraq (%)
Place of birth for the foreign-born population - Israel (%)
Place of birth for the foreign-born population - Jordan (%)
Place of birth for the foreign-born population - Kuwait (%)
Place of birth for the foreign-born population - Lebanon (%)
Place of birth for the foreign-born population - Saudi Arabia (%)
Place of birth for the foreign-born population - Syria (%)
Place of birth for the foreign-born population - Turkey (%)
Place of birth for the foreign-born population - Yemen (%)
Place of birth for the foreign-born population - Other Western Asia (%)
Place of birth for the foreign-born population - Eritrea (%)
Place of birth for the foreign-born population - Ethiopia (%)
Place of birth for the foreign-born population - Kenya (%)
Place of birth for the foreign-born population - Somalia (%)
Place of birth for the foreign-born population - Uganda (%)
Place of birth for the foreign-born population - Zimbabwe (%)
Place of birth for the foreign-born population - Other Eastern Africa (%)
Place of birth for the foreign-born population - Cameroon (%)
Place of birth for the foreign-born population - Congo (%)
Place of birth for the foreign-born population - Democratic Republic of Congo (Zaire) (%)
Place of birth for the foreign-born population - Other Middle Africa (%)
Place of birth for the foreign-born population - Egypt (%)
Place of birth for the foreign-born population - Morocco (%)
Place of birth for the foreign-born population - Sudan (%)
Place of birth for the foreign-born population - Other Northern Africa (%)
Place of birth for the foreign-born population - South Africa (%)
Place of birth for the foreign-born population - Other Southern Africa (%)
Place of birth for the foreign-born population - Cabo Verde (%)
Place of birth for the foreign-born population - Ghana (%)
Place of birth for the foreign-born population - Liberia (%)
Place of birth for the foreign-born population - Nigeria (%)
Place of birth for the foreign-born population - Senegal (%)
Place of birth for the foreign-born population - Sierra Leone (%)
Place of birth for the foreign-born population - Other Western Africa (%)
Place of birth for the foreign-born population - Australia (%)
Place of birth for the foreign-born population - New Zealand (%)
Place of birth for the foreign-born population - Fiji (%)
Place of birth for the foreign-born population - Micronesia (%)
Place of birth for the foreign-born population - Bahamas (%)
Place of birth for the foreign-born population - Barbados (%)
Place of birth for the foreign-born population - Cuba (%)
Place of birth for the foreign-born population - Dominica (%)
Place of birth for the foreign-born population - Dominican Republic (%)
Place of birth for the foreign-born population - Grenada (%)
Place of birth for the foreign-born population - Haiti (%)
Place of birth for the foreign-born population - Jamaica (%)
Place of birth for the foreign-born population - St. Vincent and the Grenadines (%)
Place of birth for the foreign-born population - Trinidad and Tobago (%)
Place of birth for the foreign-born population - West Indies (%)
Place of birth for the foreign-born population - Other Caribbean (%)
Place of birth for the foreign-born population - Belize (%)
Place of birth for the foreign-born population - Costa Rica (%)
Place of birth for the foreign-born population - El Salvador (%)
Place of birth for the foreign-born population - Guatemala (%)
Place of birth for the foreign-born population - Honduras (%)
Place of birth for the foreign-born population - Mexico (%)
Place of birth for the foreign-born population - Nicaragua (%)
Place of birth for the foreign-born population - Panama (%)
Place of birth for the foreign-born population - Other Central America (%)
Place of birth for the foreign-born population - Argentina (%)
Place of birth for the foreign-born population - Bolivia (%)
Place of birth for the foreign-born population - Brazil (%)
Place of birth for the foreign-born population - Chile (%)
Place of birth for the foreign-born population - Colombia (%)
Place of birth for the foreign-born population - Ecuador (%)
Place of birth for the foreign-born population - Guyana (%)
Place of birth for the foreign-born population - Peru (%)
Place of birth for the foreign-born population - Uruguay (%)
Place of birth for the foreign-born population - Venezuela (%)
Place of birth for the foreign-born population - Other South America (%)
Place of birth for the foreign-born population - Canada (%)
Place of birth for the foreign-born population - Other Northern America (%)
Place of birth for the foreign-born population - Other (%)
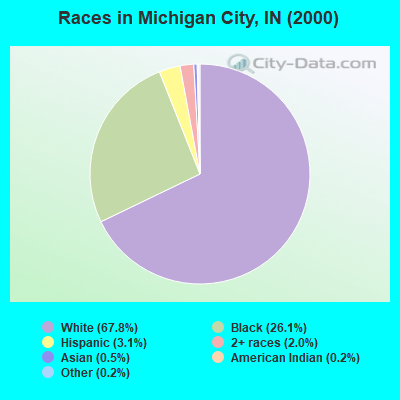
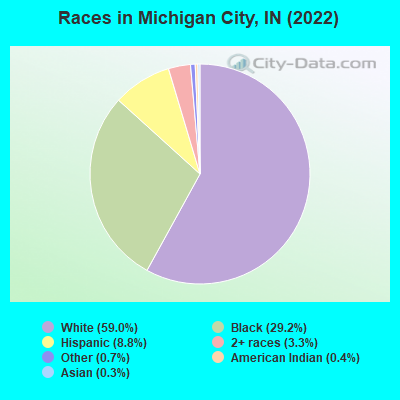
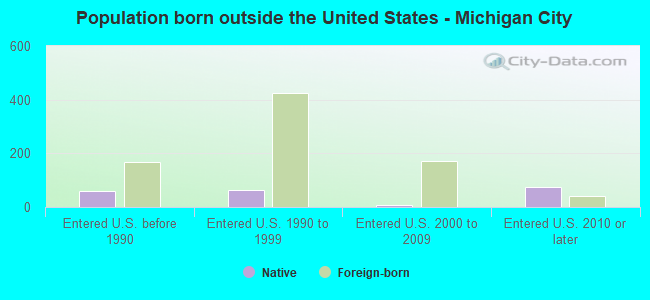
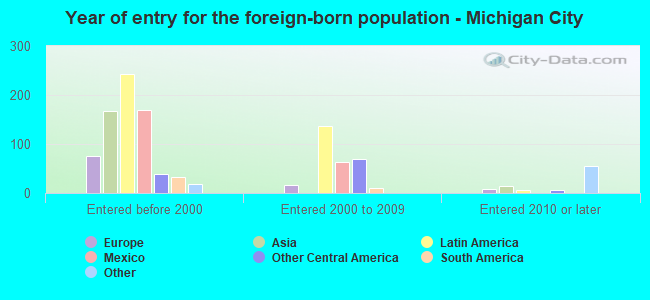
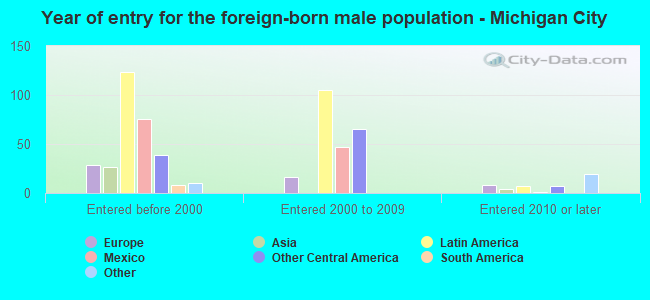
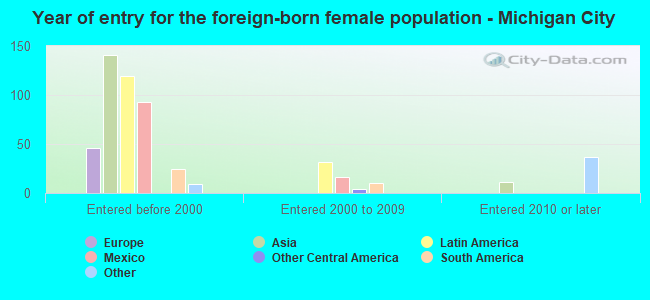
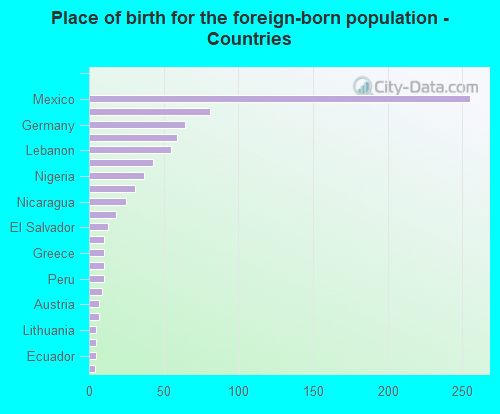
According to 2022 data, the most numerous races in Michigan City, IN are White alone (18,777 residents), Black alone (9,293 residents), and Hispanic (2,799 residents). 95.3% of Michigan City residents speak English at home. 2.6% of Michigan City, IN residents are foreign-born (1.2% born in Latin America, 0.6% born in Asia, 0.3% born in Europe), which is 135.2% less than the foreign-born rate of 6.0% across the entire state of Indiana.
Race distribution in Michigan City
2000 2022
5,219,373 85.8% White alone 505,462 8.3% Black alone 214,536 3.5% Hispanic 61,115 1.0% Two or more races 58,424 1.0% Asian alone 13,654 0.2% American Indian alone 6,348 0.1% Other race alone 1,573 0.03% Native Hawaiian and Other
5,192,455 76.0% White alone 628,054 9.2% Black alone 534,528 7.8% Hispanic 263,242 3.9% Two or more races 172,880 2.5% Asian alone 33,467 0.5% Other race alone 5,866 0.09% American Indian alone 2,545 0.04% Native Hawaiian and Other
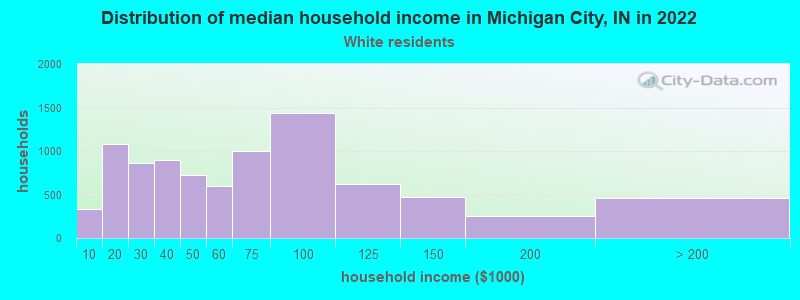
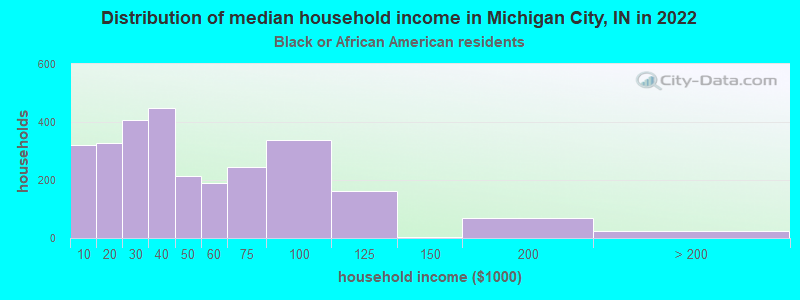
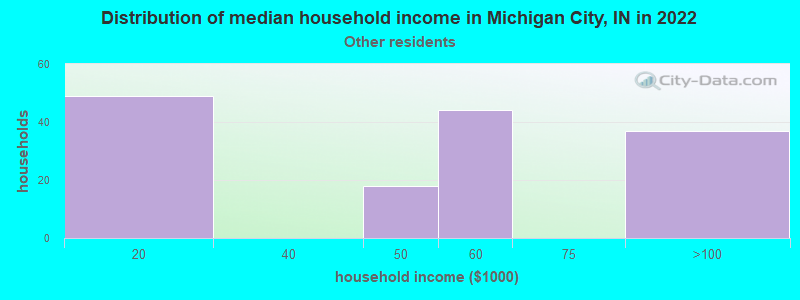
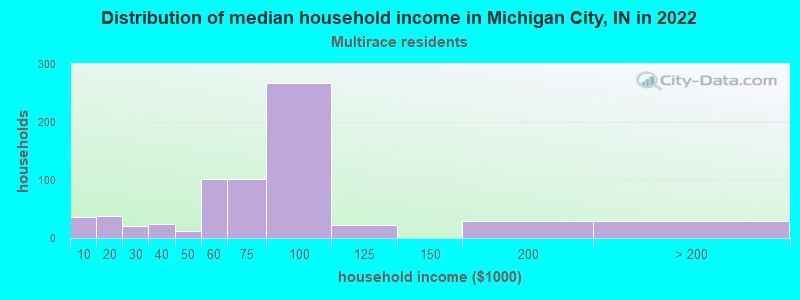
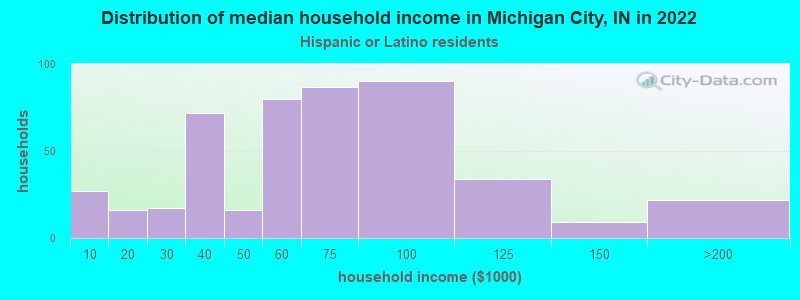
Income and house value in Michigan City Median household income in 2022 $56,156 White non-Hispanic householders$35,121 Black householders$33,375 Some other race householders$86,286 Two or more races householders$52,600 Hispanic or Latino race householdersMedian 2022 house value $130,867 White Non-Hispanic householders$113,441 Black or African American householders$188,509 American Indian or Alaska Native householders$118,300 Some other race householders$141,089 Two or more races householders$118,970 Hispanic or Latino householders
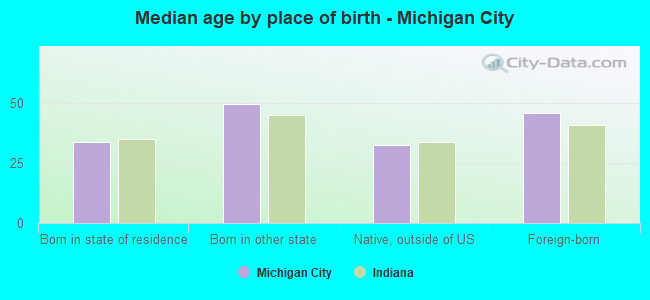
Median age by race in Michigan City
45.3 Median age for White residents43.7 47.8 29.9 Median age for Black or African American residents26.1 37.3 25.4 Median age for American Indian / Alaska Native residents34.2 17.6 39.0 Median age for Asian residents31.6 49.1 -664,335,663.7 Median age for Native Hawaiian / Pacific Islander residents-666,666,666.0 -666,666,666.0 36.3 Median age for Other race residents37.2 23.9 24.2 Median age for Two or more races residents26.2 19.8 46.7 Median age for White alone residents44.2 49.5 24.5 Median age for Hispanic or Latino residents22.6 25.9
Owner/renter occupied households by race in Michigan City
House owners and renters - White residents 5,523 63.1% Owner occupied3,234 36.9% Renter occupiedHouse owners and renters - Black or African American residents 1,395 47.4% Owner occupied1,549 52.6% Renter occupiedHouse owners and renters - American Indian / Alaska Native residents 39 70.6% Owner occupied16 29.4% Renter occupiedHouse owners and renters - Asian residents 18 100.0% Renter occupiedHouse owners and renters - Other race residents 29 17.4% Owner occupied138 82.6% Renter occupiedHouse owners and renters - Two or more races residents 279 42.1% Owner occupied384 57.9% Renter occupiedHouse owners and renters - White alone residents 5,349 62.5% Owner occupied3,208 37.5% Renter occupiedHouse owners and renters - Hispanic or Latino residents 314 61.9% Owner occupied194 38.1% Renter occupied
Language usage in Michigan City
English speakers - Total 95.3% of residents of Michigan City speak English at home.
2.2% of residents speak Spanish at home 501 76.5% Speak English very well154 23.5% Speak English less than very well2.0% of residents speak other language at home 449 75.0% Speak English very well150 25.0% Speak English less than very well
English speakers - Born in the United States 95.6% of residents of Michigan City speak English at home.
2.9% of residents speak Spanish at home 256 100.0% Speak English very well1.4% of residents speak other language at home 127 100.0% Speak English very well
English speakers - Native, born elsewhere 98.1% of residents of Michigan City speak English at home.
1.9% of residents speak other language at home 5 100.0% Speak English very well
English speakers - Foreign-born 24.4% of residents of Michigan City speak English at home.
28.8% of residents speak Spanish at home 111 47.2% Speak English very well124 52.8% Speak English less than very well45.6% of residents speak other language at home 244 65.6% Speak English very well128 34.4% Speak English less than very well
White (Caucasian) - Speak only English Native:
98.2% (18,154)Foreign-born:
17.0% (60)
White (Caucasian) - Speak another language Native:
1.8% (332)Foreign-born:
81.7% (290)
Black or African American - Speak only English Native:
99.2% (7,641)Foreign-born:
15.7% (12)
Black or African American - Speak another language Native:
0.3% (26)Foreign-born:
87.6% (69)
Other race - Speak only English Native:
49.4% (290)Foreign-born:
40.1% (91)
Other race - Speak another language Native:
44.3% (260)Foreign-born:
45.5% (104)
Two or more races - Speak only English Native:
93.8% (2,315)Foreign-born:
24.6% (38)
Two or more races - Speak another language Native:
4.0% (99)Foreign-born:
76.3% (119)
White alone - Speak only English Native:
98.1% (17,190)Foreign-born:
12.9% (50)
White alone - Speak another language Native:
1.9% (325)Foreign-born:
93.6% (366)
Hispanic or Latino - Speak only English Native:
76.3% (1,727)Foreign-born:
49.4% (169)
Hispanic or Latino - Speak another language Native:
15.0% (340)Foreign-born:
62.0% (212)
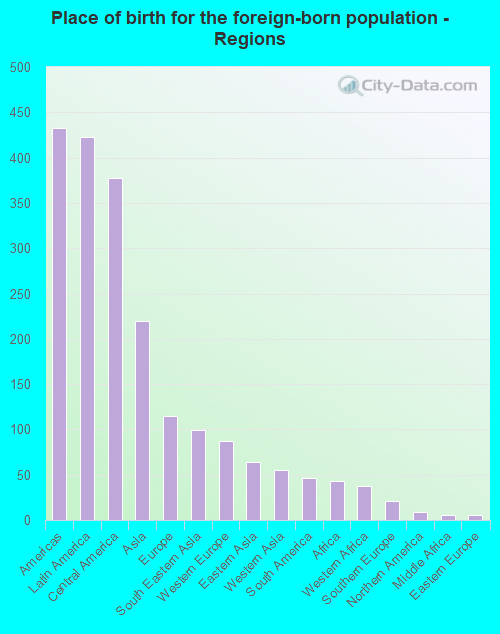
Foreign-born residents in Michigan City 812 residents are foreign born (1.2% Latin America , 0.6% Asia , 0.3% Europe ).
This city:
2.6%Indiana:
5.6%
Marital status for residents in Michigan City Marital status - White (Caucasian) population 15 years and over
Males 37.3% Never married38.8% Now married0.4% Separated3.4% Widowed20.1% DivorcedFemales 25.8% Never married37.2% Now married1.6% Separated15.0% Widowed20.3% DivorcedWomen who gave birth in the past 12 months Now married:
53.8% (150)Unmarried:
46.2% (128)
Women who did not give birth in the past 12 months Now married:
37.7% (1,250)Unmarried:
62.3% (2,062)
Marital status - Black or African American population 15 years and over
Males 59.1% Never married20.6% Now married2.6% Separated3.0% Widowed14.7% DivorcedFemales 48.7% Never married16.6% Now married4.5% Separated7.7% Widowed22.6% DivorcedWomen who gave birth in the past 12 months Now married:
10.6% (22)Unmarried:
89.4% (185)
Women who did not give birth in the past 12 months Now married:
21.9% (376)Unmarried:
78.1% (1,341)
Marital status - American Indian / Alaska Native population 15 years and over
Males 65.8% Never married34.2% Now married0.0% Separated0.0% Widowed0.0% DivorcedFemales 22.2% Never married68.9% Now married0.0% Separated0.0% Widowed8.9% DivorcedWomen who did not give birth in the past 12 months Now married:
60.0% (50)Unmarried:
40.0% (33)
Marital status - Asian population 15 years and over
Males 0.0% Never married86.4% Now married0.0% Separated13.6% Widowed0.0% DivorcedFemales 39.3% Never married60.7% Now married0.0% Separated0.0% Widowed0.0% DivorcedWomen who did not give birth in the past 12 months Now married:
52.9% (56)Unmarried:
47.1% (50)
Marital status - Other race population 15 years and over
Males 16.2% Never married63.5% Now married0.0% Separated2.2% Widowed18.1% DivorcedFemales 42.9% Never married57.1% Now married0.0% Separated0.0% Widowed0.0% DivorcedWomen who did not give birth in the past 12 months Now married:
46.8% (80)Unmarried:
53.2% (91)
Marital status - Two or more races population 15 years and over
Males 64.9% Never married24.2% Now married0.5% Separated1.2% Widowed9.2% DivorcedFemales 58.2% Never married23.0% Now married0.0% Separated1.2% Widowed17.5% DivorcedWomen who gave birth in the past 12 months Now married:
100.0% (25)Unmarried:
0.0% (0)
Women who did not give birth in the past 12 months Now married:
9.2% (53)Unmarried:
90.8% (529)
Marital status - White alone, not Hispanic / Latino population 15 years and over
Males 36.9% Never married39.2% Now married0.4% Separated3.5% Widowed20.0% DivorcedFemales 24.7% Never married37.5% Now married1.6% Separated15.6% Widowed20.7% DivorcedWomen who gave birth in the past 12 months Now married:
53.8% (148)Unmarried:
46.2% (127)
Women who did not give birth in the past 12 months Now married:
38.8% (1,156)Unmarried:
61.2% (1,822)
Marital status - Hispanic or Latino population 15 years and over
Males 42.6% Never married40.5% Now married0.0% Separated0.7% Widowed16.2% DivorcedFemales 50.8% Never married37.6% Now married1.3% Separated2.1% Widowed8.1% DivorcedWomen who gave birth in the past 12 months Now married:
100.0% (24)Unmarried:
0.0% (0)
Women who did not give birth in the past 12 months Now married:
30.6% (278)Unmarried:
69.4% (630)
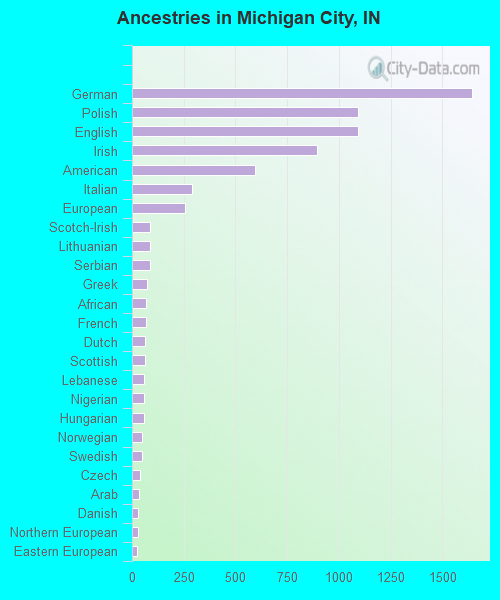
Ancestries in Michigan City
1,643 11.4% German1,093 7.6% Polish1,093 7.6% English892 6.2% Irish592 4.1% American290 2.0% Italian256 1.8% European88 0.6% Scotch-Irish86 0.6% Lithuanian85 0.6% Serbian74 0.5% Greek66 0.5% African66 0.5% French65 0.5% Dutch62 0.4% Scottish59 0.4% Lebanese58 0.4% Nigerian56 0.4% Hungarian49 0.3% Norwegian47 0.3% Swedish40 0.3% Czech32 0.2% Arab30 0.2% Danish27 0.2% Northern European26 0.2% Eastern European21 0.1% Croatian20 0.1% Russian18 0.1% Scandinavian11 0.08% Slovak10 0.07% Czechoslovakian8 0.06% French Canadian7 0.05% Luxembourger7 0.05% Austrian6 0.04% British6 0.04% Belizean5 0.03% Welsh4 0.03% Slavic4 0.03% Assyrian2 0.01% Moroccan
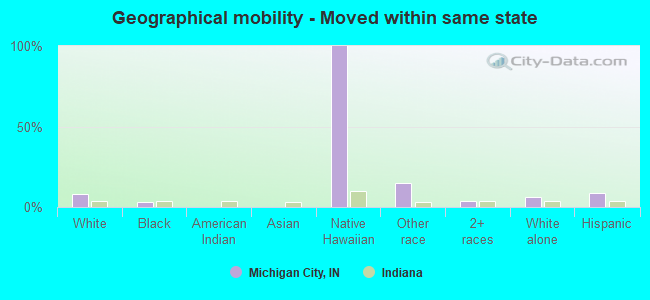
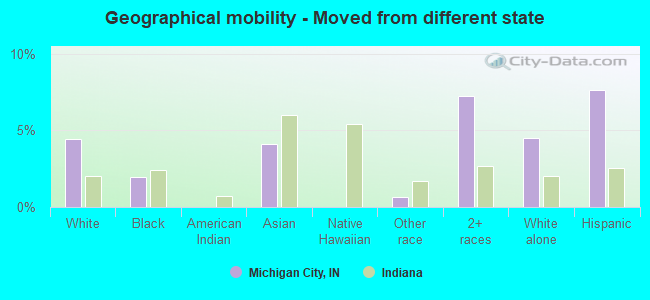
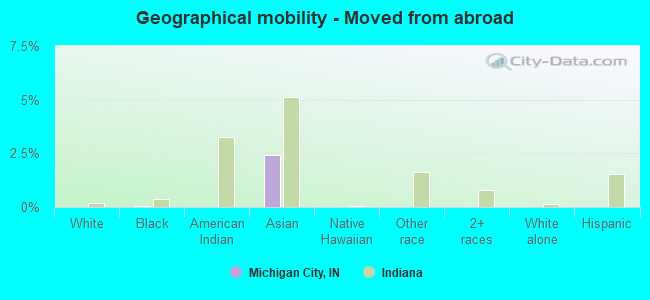
Geographical mobility in Michigan City Same house 1 year ago 15,377 78.7% White (Caucasian)8,320 88.3% Black or African American178 100.0% American Indian / Alaska Native228 94.0% Asian518 70.8% Other race2,213 77.2% Two or more races14,883 80.1% White alone, not Hispanic / Latino1,660 58.7% Hispanic or LatinoMoved within same county 1,731 8.9% White / Caucasian936 9.9% Black or African American80 11.0% Other race339 11.8% Two or more races1,690 9.1% White alone, not Hispanic / Latino409 14.5% Hispanic or LatinoMoved within same state 1,599 8.2% White / Caucasian261 2.8% Black or African American31 100.0% Native Hawaiian / Pacific Islander108 14.8% Other race101 3.5% Two or more races1,152 6.2% White alone, not Hispanic / Latino267 9.5% Hispanic or LatinoMoved from different state 864 4.4% White / Caucasian182 1.9% Black or African American10 4.1% Asian5 0.6% Other race207 7.2% Two or more races840 4.5% White alone, not Hispanic / Latino215 7.6% Hispanic or LatinoMoved from abroad 2 0.0% Black or African American6 2.4% Asian
Children Nativity (place of birth) in Michigan City
Children under 6 years - Living with two parents Both parents native 593 100.0% NativeBoth parents foreign-born 17 100.0% NativeOne native, one foreign-born parent 81 100.0% NativeChildren under 6 years - Living with one parent Native parent 1,479 100.0% Native
Children 6 to 17 years - Living with two parents Both parents native 1,252 97.6% Native31 2.4% Foreign-bornBoth parents foreign-born 86 100.0% NativeOne native, one foreign-born parent 163 100.0% NativeChildren 6 to 17 years - Living with one parent Native parent 2,747 100.0% Native
Grandparents responsible for own grandchildren in Michigan City
Grandparents (30 to 59 years) White / Caucasian 74 68.0% Responsible for grandchildren35 32.0% Not responsible for grandchildrenBlack or African American 40 100.0% Not responsible for grandchildrenTwo or more races 3 100.0% Responsible for grandchildrenWhite alone, not Hispanic / Latino 76 72.6% Responsible for grandchildren29 27.4% Not responsible for grandchildrenHispanic or Latino 9 100.0% Not responsible for grandchildrenGrandparents (60 years and over) White / Caucasian 90 42.5% Responsible for grandchildren122 57.5% Not responsible for grandchildrenBlack or African American 23 20.6% Responsible for grandchildren90 79.4% Not responsible for grandchildrenTwo or more races 12 100.0% Not responsible for grandchildrenWhite alone, not Hispanic / Latino 91 42.6% Responsible for grandchildren123 57.4% Not responsible for grandchildrenHispanic or Latino 1 100.0% Not responsible for grandchildren