Races in Middle Valley, Tennessee (TN) Detailed Stats
Data:
Races - White alone (%)
Races - White alone (% change since 2000)
Races - Black alone (%)
Races - Black alone (% change since 2000)
Races - American Indian alone (%)
Races - American Indian alone (% change since 2000)
Races - Asian alone (%)
Races - Asian alone (% change since 2000)
Races - Hispanic (%)
Races - Hispanic (% change since 2000)
Races - Native Hawaiian and Other Pacific Islander alone (%)
Races - Native Hawaiian and Other Pacific Islander alone (% change since 2000)
Races - Two or more races(%)
Races - Two or more races(% change since 2000)
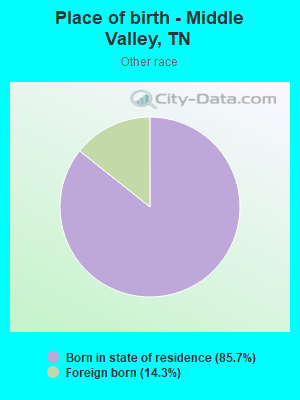
Races - Other race alone (%)
Races - Other race alone (% change since 2000)
Racial diversity
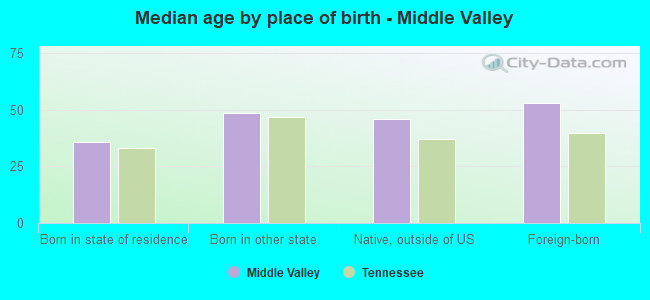
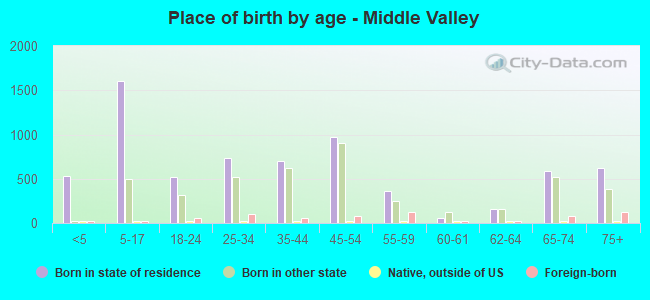
Place of birth - Born in state of residence (%)
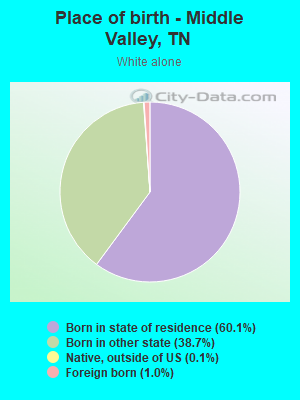
Place of birth - Born in state of residence (%) - White
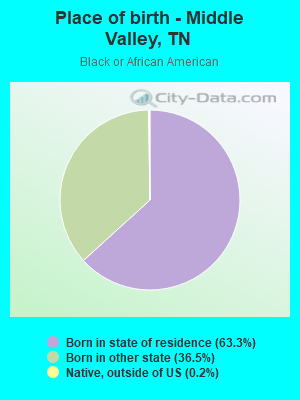
Place of birth - Born in state of residence (%) - Black or African American
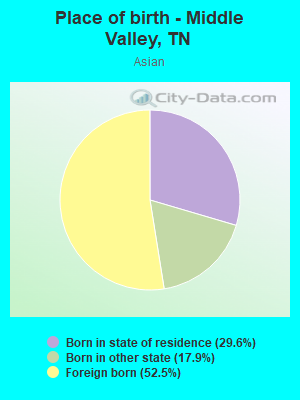
Place of birth - Born in state of residence (%) - Asian
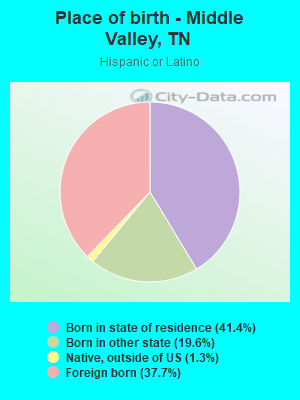
Place of birth - Born in state of residence (%) - Hispanic or Latino
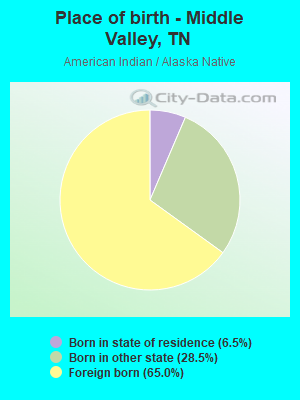
Place of birth - Born in state of residence (%) - American Indian and Alaska Native
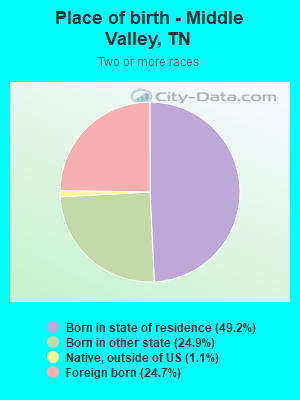
Place of birth - Born in state of residence (%) - Multirace
Place of birth - Born in state of residence (%) - Other Race
Place of birth - Born in other state (%)
Place of birth - Born in other state (%) - White
Place of birth - Born in other state (%) - Black or African American
Place of birth - Born in other state (%) - Asian
Place of birth - Born in other state (%) - Hispanic or Latino
Place of birth - Born in other state (%) - American Indian and Alaska Native
Place of birth - Born in other state (%) - Multirace
Place of birth - Born in other state (%) - Other Race
Place of birth - Native, outside of US (%)
Place of birth - Native, outside of US (%) - White
Place of birth - Native, outside of US (%) - Black or African American
Place of birth - Native, outside of US (%) - Asian
Place of birth - Native, outside of US (%) - Hispanic or Latino
Place of birth - Native, outside of US (%) - American Indian and Alaska Native
Place of birth - Native, outside of US (%) - Multirace
Place of birth - Native, outside of US (%) - Other Race
Place of birth - Foreign born (%)
Place of birth - Foreign born (%) - White
Place of birth - Foreign born (%) - Black or African American
Place of birth - Foreign born (%) - Asian
Place of birth - Foreign born (%) - Hispanic or Latino
Place of birth - Foreign born (%) - American Indian and Alaska Native
Place of birth - Foreign born (%) - Multirace
Place of birth - Foreign born (%) - Other Race
Residents speaking English at home (%)
Residents speaking English at home - Born in the United States (%)
Residents speaking English at home - Native, born elsewhere (%)
Residents speaking English at home - Foreign born (%)
Residents speaking Spanish at home (%)
Residents speaking Spanish at home - Born in the United States (%)
Residents speaking Spanish at home - Native, born elsewhere (%)
Residents speaking Spanish at home - Foreign born (%)
Residents speaking other language at home (%)
Residents speaking other language at home - Born in the United States (%)
Residents speaking other language at home - Native, born elsewhere (%)
Residents speaking other language at home - Foreign born (%)
Marital status - Never married (%)
Marital status - Now married (%)
Marital status - Separated (%)
Marital status - Widowed (%)
Marital status - Divorced (%)
Ancestries Reported - Arab (%)
Ancestries Reported - Czech (%)
Ancestries Reported - Danish (%)
Ancestries Reported - Dutch (%)
Ancestries Reported - English (%)
Ancestries Reported - French (%)
Ancestries Reported - French Canadian (%)
Ancestries Reported - German (%)
Ancestries Reported - Greek (%)
Ancestries Reported - Hungarian (%)
Ancestries Reported - Irish (%)
Ancestries Reported - Italian (%)
Ancestries Reported - Lithuanian (%)
Ancestries Reported - Norwegian (%)
Ancestries Reported - Polish (%)
Ancestries Reported - Portuguese (%)
Ancestries Reported - Russian (%)
Ancestries Reported - Scotch-Irish (%)
Ancestries Reported - Scottish (%)
Ancestries Reported - Slovak (%)
Ancestries Reported - Subsaharan African (%)
Ancestries Reported - Swedish (%)
Ancestries Reported - Swiss (%)
Ancestries Reported - Ukrainian (%)
Ancestries Reported - United States (%)
Ancestries Reported - Welsh (%)
Ancestries Reported - West Indian (%)
Ancestries Reported - Other (%)
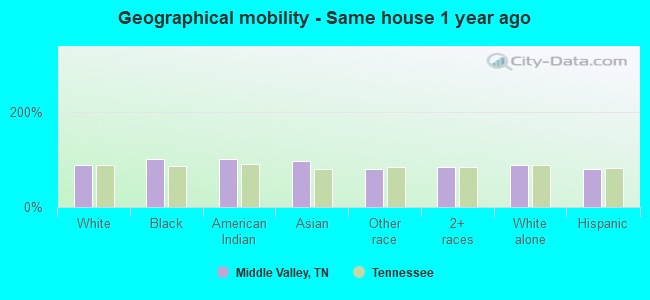
Geographical mobility - Same house 1 year ago (%)
Geographical mobility - Same house 1 year ago (%) - White
Geographical mobility - Same house 1 year ago (%) - Black or African American
Geographical mobility - Same house 1 year ago (%) - Asian
Geographical mobility - Same house 1 year ago (%) - Hispanic or Latino
Geographical mobility - Same house 1 year ago (%) - American Indian and Alaska Native
Geographical mobility - Same house 1 year ago (%) - Multirace
Geographical mobility - Same house 1 year ago (%) - Other Race
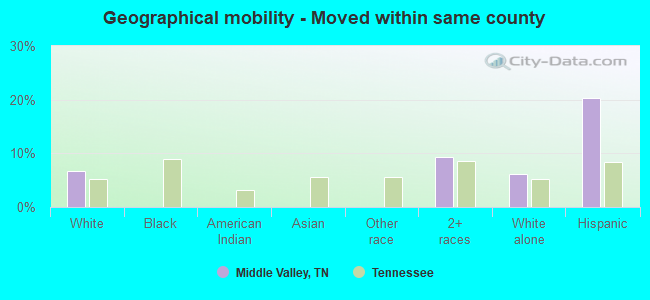
Geographical mobility - Moved within same county (%)
Geographical mobility - Moved within same county (%) - White
Geographical mobility - Moved within same county (%) - Black or African American
Geographical mobility - Moved within same county (%) - Asian
Geographical mobility - Moved within same county (%) - Hispanic or Latino
Geographical mobility - Moved within same county (%) - American Indian and Alaska Native
Geographical mobility - Moved within same county (%) - Multirace
Geographical mobility - Moved within same county (%) - Other Race
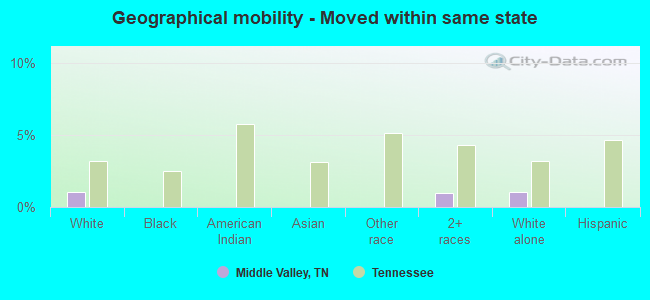
Geographical mobility - Moved from different county within same state (%)
Geographical mobility - Moved from different county within same state (%) - White
Geographical mobility - Moved from different county within same state (%) - Black or African American
Geographical mobility - Moved from different county within same state (%) - Asian
Geographical mobility - Moved from different county within same state (%) - Hispanic or Latino
Geographical mobility - Moved from different county within same state (%) - American Indian and Alaska Native
Geographical mobility - Moved from different county within same state (%) - Multirace
Geographical mobility - Moved from different county within same state (%) - Other Race
Geographical mobility - Moved from different state (%)
Geographical mobility - Moved from different state (%) - White
Geographical mobility - Moved from different state (%) - Black or African American
Geographical mobility - Moved from different state (%) - Asian
Geographical mobility - Moved from different state (%) - Hispanic or Latino
Geographical mobility - Moved from different state (%) - American Indian and Alaska Native
Geographical mobility - Moved from different state (%) - Multirace
Geographical mobility - Moved from different state (%) - Other Race
Geographical mobility - Moved from abroad (%)
Geographical mobility - Moved from abroad (%) - White
Geographical mobility - Moved from abroad (%) - Black or African American
Geographical mobility - Moved from abroad (%) - Asian
Geographical mobility - Moved from abroad (%) - Hispanic or Latino
Geographical mobility - Moved from abroad (%) - American Indian and Alaska Native
Geographical mobility - Moved from abroad (%) - Multirace
Geographical mobility - Moved from abroad (%) - Other Race
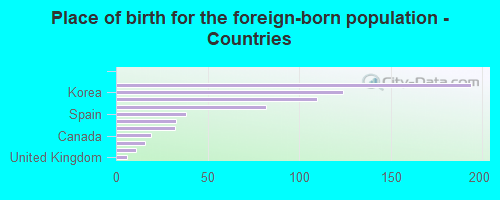
Place of birth for the foreign-born population - Ireland (%)
Place of birth for the foreign-born population - Denmark (%)
Place of birth for the foreign-born population - Norway (%)
Place of birth for the foreign-born population - Sweden (%)
Place of birth for the foreign-born population - United Kingdom (%)
Place of birth for the foreign-born population - England (%)
Place of birth for the foreign-born population - Scotland (%)
Place of birth for the foreign-born population - Other Northern Europe (%)
Place of birth for the foreign-born population - Austria (%)
Place of birth for the foreign-born population - Belgium (%)
Place of birth for the foreign-born population - France (%)
Place of birth for the foreign-born population - Germany (%)
Place of birth for the foreign-born population - Netherlands (%)
Place of birth for the foreign-born population - Switzerland (%)
Place of birth for the foreign-born population - Other Western Europe (%)
Place of birth for the foreign-born population - Greece (%)
Place of birth for the foreign-born population - Italy (%)
Place of birth for the foreign-born population - Portugal (%)
Place of birth for the foreign-born population - Spain (%)
Place of birth for the foreign-born population - Other Southern Europe (%)
Place of birth for the foreign-born population - Albania (%)
Place of birth for the foreign-born population - Belarus (%)
Place of birth for the foreign-born population - Bosnia and Herzegovina (%)
Place of birth for the foreign-born population - Bulgaria (%)
Place of birth for the foreign-born population - Croatia (%)
Place of birth for the foreign-born population - Czechoslovakia (%)
Place of birth for the foreign-born population - Hungary (%)
Place of birth for the foreign-born population - Latvia (%)
Place of birth for the foreign-born population - Lithuania (%)
Place of birth for the foreign-born population - North Macedonia (Macedonia) (%)
Place of birth for the foreign-born population - Moldova (%)
Place of birth for the foreign-born population - Poland (%)
Place of birth for the foreign-born population - Romania (%)
Place of birth for the foreign-born population - Russia (%)
Place of birth for the foreign-born population - Serbia (%)
Place of birth for the foreign-born population - Ukraine (%)
Place of birth for the foreign-born population - Other Eastern Europe (%)
Place of birth for the foreign-born population - China (%)
Place of birth for the foreign-born population - Hong Kong (%)
Place of birth for the foreign-born population - Taiwan (%)
Place of birth for the foreign-born population - Japan (%)
Place of birth for the foreign-born population - Korea (%)
Place of birth for the foreign-born population - Other Eastern Asia (%)
Place of birth for the foreign-born population - Afghanistan (%)
Place of birth for the foreign-born population - Bangladesh (%)
Place of birth for the foreign-born population - India (%)
Place of birth for the foreign-born population - Iran (%)
Place of birth for the foreign-born population - Kazakhstan (%)
Place of birth for the foreign-born population - Nepal (%)
Place of birth for the foreign-born population - Pakistan (%)
Place of birth for the foreign-born population - Sri Lanka (%)
Place of birth for the foreign-born population - Uzbekistan (%)
Place of birth for the foreign-born population - Other South Central Asia (%)
Place of birth for the foreign-born population - Burma (%)
Place of birth for the foreign-born population - Cambodia (%)
Place of birth for the foreign-born population - Indonesia (%)
Place of birth for the foreign-born population - Laos (%)
Place of birth for the foreign-born population - Malaysia (%)
Place of birth for the foreign-born population - Philippines (%)
Place of birth for the foreign-born population - Singapore (%)
Place of birth for the foreign-born population - Thailand (%)
Place of birth for the foreign-born population - Vietnam (%)
Place of birth for the foreign-born population - Other South Eastern Asia (%)
Place of birth for the foreign-born population - Armenia (%)
Place of birth for the foreign-born population - Iraq (%)
Place of birth for the foreign-born population - Israel (%)
Place of birth for the foreign-born population - Jordan (%)
Place of birth for the foreign-born population - Kuwait (%)
Place of birth for the foreign-born population - Lebanon (%)
Place of birth for the foreign-born population - Saudi Arabia (%)
Place of birth for the foreign-born population - Syria (%)
Place of birth for the foreign-born population - Turkey (%)
Place of birth for the foreign-born population - Yemen (%)
Place of birth for the foreign-born population - Other Western Asia (%)
Place of birth for the foreign-born population - Eritrea (%)
Place of birth for the foreign-born population - Ethiopia (%)
Place of birth for the foreign-born population - Kenya (%)
Place of birth for the foreign-born population - Somalia (%)
Place of birth for the foreign-born population - Uganda (%)
Place of birth for the foreign-born population - Zimbabwe (%)
Place of birth for the foreign-born population - Other Eastern Africa (%)
Place of birth for the foreign-born population - Cameroon (%)
Place of birth for the foreign-born population - Congo (%)
Place of birth for the foreign-born population - Democratic Republic of Congo (Zaire) (%)
Place of birth for the foreign-born population - Other Middle Africa (%)
Place of birth for the foreign-born population - Egypt (%)
Place of birth for the foreign-born population - Morocco (%)
Place of birth for the foreign-born population - Sudan (%)
Place of birth for the foreign-born population - Other Northern Africa (%)
Place of birth for the foreign-born population - South Africa (%)
Place of birth for the foreign-born population - Other Southern Africa (%)
Place of birth for the foreign-born population - Cabo Verde (%)
Place of birth for the foreign-born population - Ghana (%)
Place of birth for the foreign-born population - Liberia (%)
Place of birth for the foreign-born population - Nigeria (%)
Place of birth for the foreign-born population - Senegal (%)
Place of birth for the foreign-born population - Sierra Leone (%)
Place of birth for the foreign-born population - Other Western Africa (%)
Place of birth for the foreign-born population - Australia (%)
Place of birth for the foreign-born population - New Zealand (%)
Place of birth for the foreign-born population - Fiji (%)
Place of birth for the foreign-born population - Micronesia (%)
Place of birth for the foreign-born population - Bahamas (%)
Place of birth for the foreign-born population - Barbados (%)
Place of birth for the foreign-born population - Cuba (%)
Place of birth for the foreign-born population - Dominica (%)
Place of birth for the foreign-born population - Dominican Republic (%)
Place of birth for the foreign-born population - Grenada (%)
Place of birth for the foreign-born population - Haiti (%)
Place of birth for the foreign-born population - Jamaica (%)
Place of birth for the foreign-born population - St. Vincent and the Grenadines (%)
Place of birth for the foreign-born population - Trinidad and Tobago (%)
Place of birth for the foreign-born population - West Indies (%)
Place of birth for the foreign-born population - Other Caribbean (%)
Place of birth for the foreign-born population - Belize (%)
Place of birth for the foreign-born population - Costa Rica (%)
Place of birth for the foreign-born population - El Salvador (%)
Place of birth for the foreign-born population - Guatemala (%)
Place of birth for the foreign-born population - Honduras (%)
Place of birth for the foreign-born population - Mexico (%)
Place of birth for the foreign-born population - Nicaragua (%)
Place of birth for the foreign-born population - Panama (%)
Place of birth for the foreign-born population - Other Central America (%)
Place of birth for the foreign-born population - Argentina (%)
Place of birth for the foreign-born population - Bolivia (%)
Place of birth for the foreign-born population - Brazil (%)
Place of birth for the foreign-born population - Chile (%)
Place of birth for the foreign-born population - Colombia (%)
Place of birth for the foreign-born population - Ecuador (%)
Place of birth for the foreign-born population - Guyana (%)
Place of birth for the foreign-born population - Peru (%)
Place of birth for the foreign-born population - Uruguay (%)
Place of birth for the foreign-born population - Venezuela (%)
Place of birth for the foreign-born population - Other South America (%)
Place of birth for the foreign-born population - Canada (%)
Place of birth for the foreign-born population - Other Northern America (%)
Place of birth for the foreign-born population - Other (%)
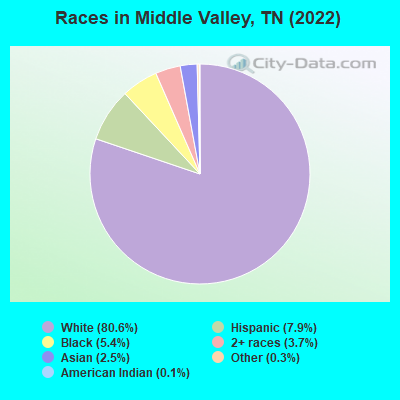
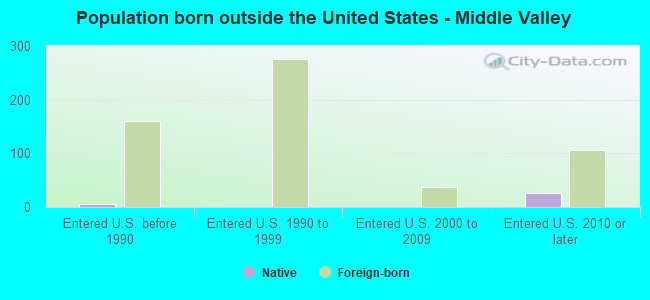
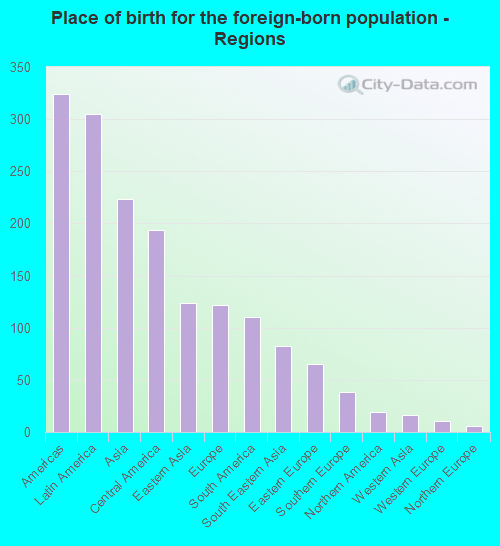
According to 2022 data, the most numerous races in Middle Valley, TN are White alone (9,558 residents), Black alone (640 residents), and Hispanic (938 residents). 90.7% of Middle Valley residents speak English at home. 5.7% of Middle Valley, TN residents are foreign-born (2.5% born in Latin America, 1.8% born in Asia, 1.0% born in Europe), which is 11.5% greater than the foreign-born rate of 5.0% across the entire state of Tennessee.
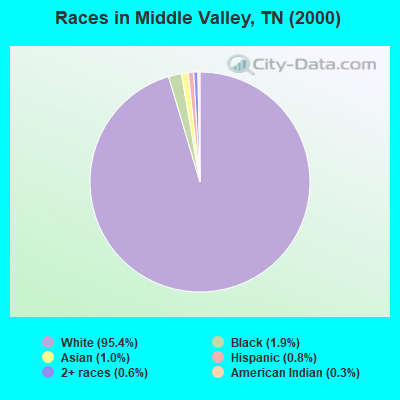
Race distribution in Middle Valley
2000 2022
4,505,930 79.2% White alone 928,204 16.3% Black alone 123,838 2.2% Hispanic 54,824 1.0% Two or more races 56,077 1.0% Asian alone 13,820 0.2% American Indian alone 4,780 0.08% Other race alone 1,810 0.03% Native Hawaiian and Other
5,070,026 71.9% White alone 1,089,738 15.5% Black alone 442,629 6.3% Hispanic 279,381 4.0% Two or more races 131,817 1.9% Asian alone 26,972 0.4% Other race alone 6,387 0.09% American Indian alone 4,389 0.06% Native Hawaiian and Other
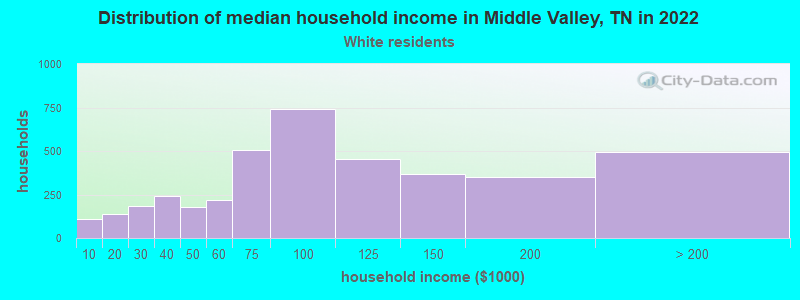
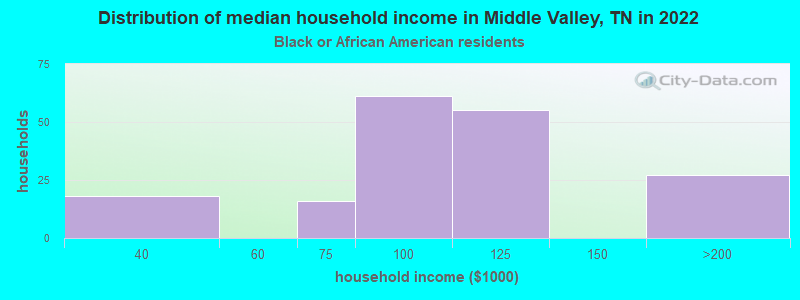
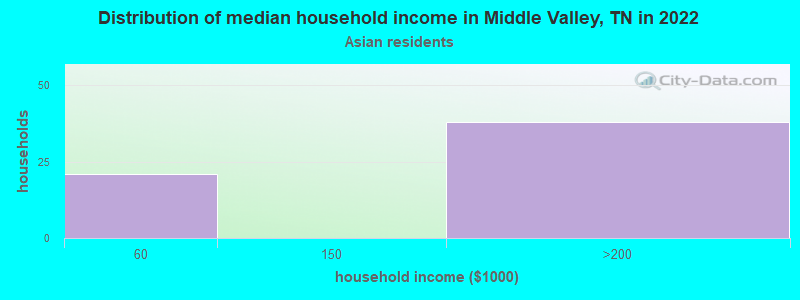
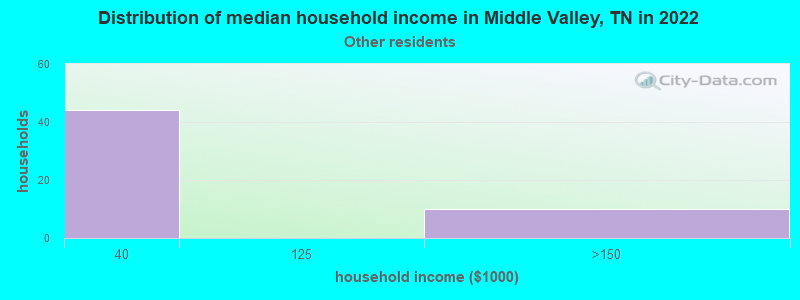
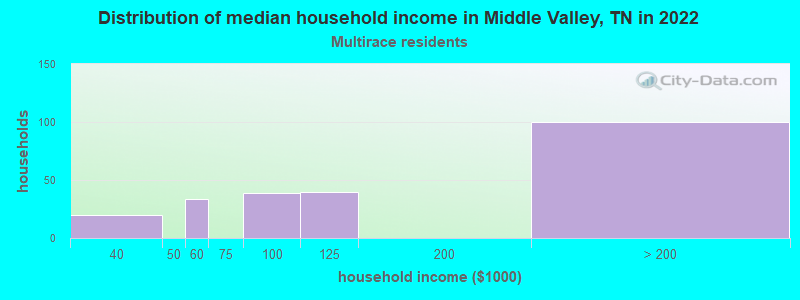
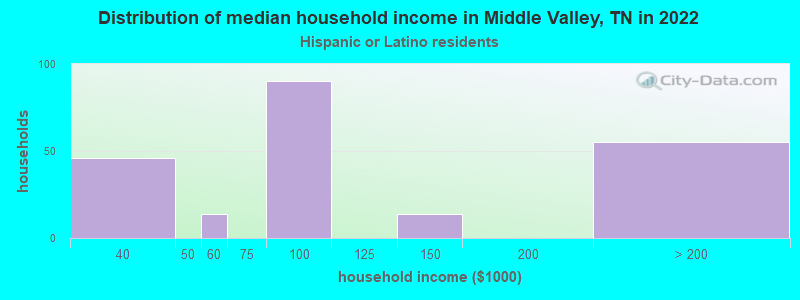
Income and house value in Middle Valley Median household income in 2022 $94,009 White non-Hispanic householders$87,009 Black householdersover $200,000 Two or more races householdersMedian 2022 house value $291,433 White Non-Hispanic householders$257,462 Black or African American householders$819,469 American Indian or Alaska Native householders $462,478 Asian householders$253,290 Some other race householders$227,067 Two or more races householders$268,190 Hispanic or Latino householders
Median age by race in Middle Valley
45.5 Median age for White residents40.8 48.8 27.7 Median age for Black or African American residents15.1 35.9 74.7 Median age for American Indian / Alaska Native residents-639,691,714.2 -773,049,644.6 49.3 Median age for Asian residents50.9 54.4 -963,888,887.9 Median age for Native Hawaiian / Pacific Islander residents-951,707,890.7 -735,930,735.2 34.6 Median age for Other race residents28.3 -849,673,201.8 23.2 Median age for Two or more races residents25.1 26.7 45.0 Median age for White alone residents40.3 48.0 23.6 Median age for Hispanic or Latino residents14.1 30.4
Owner/renter occupied households by race in Middle Valley
House owners and renters - White residents 3,400 85.7% Owner occupied569 14.3% Renter occupiedHouse owners and renters - Black or African American residents 38 25.1% Owner occupied114 74.9% Renter occupiedHouse owners and renters - Asian residents 26 57.9% Owner occupied19 42.1% Renter occupiedHouse owners and renters - Other race residents 65 100.0% Owner occupiedHouse owners and renters - Two or more races residents 223 75.8% Owner occupied71 24.2% Renter occupiedHouse owners and renters - White alone residents 3,334 85.5% Owner occupied565 14.5% Renter occupiedHouse owners and renters - Hispanic or Latino residents 245 88.9% Owner occupied31 11.1% Renter occupied
Language usage in Middle Valley
English speakers - Total 90.7% of residents of Middle Valley speak English at home.
6.5% of residents speak Spanish at home 623 84.3% Speak English very well116 15.7% Speak English less than very well3.0% of residents speak other language at home 210 62.5% Speak English very well126 37.5% Speak English less than very well
English speakers - Born in the United States 96.4% of residents of Middle Valley speak English at home.
2.5% of residents speak Spanish at home 105 100.0% Speak English very well1.1% of residents speak other language at home 48 100.0% Speak English very well
English speakers - Native, born elsewhere 63.2% of residents of Middle Valley speak English at home.
28.9% of residents speak Spanish at home 4 36.4% Speak English very well7 63.6% Speak English less than very well
English speakers - Foreign-born 12.9% of residents of Middle Valley speak English at home.
63.6% of residents speak Spanish at home 291 72.9% Speak English very well108 27.1% Speak English less than very well31.1% of residents speak other language at home 81 41.5% Speak English very well114 58.5% Speak English less than very well
White (Caucasian) - Speak only English Native:
98.5% (8,939)Foreign-born:
19.1% (24)
White (Caucasian) - Speak another language Native:
1.6% (144)Foreign-born:
80.5% (101)
Asian - Speak another language Native:
100.0% (140)Foreign-born:
98.9% (155)
Two or more races - Speak only English Native:
71.4% (613)Foreign-born:
21.9% (72)
Two or more races - Speak another language Native:
24.2% (208)Foreign-born:
81.8% (268)
White alone - Speak only English Native:
98.5% (8,896)Foreign-born:
25.9% (26)
White alone - Speak another language Native:
1.5% (135)Foreign-born:
73.6% (75)
Hispanic or Latino - Speak only English Native:
42.6% (190)Foreign-born:
3.2% (12)
Hispanic or Latino - Speak another language Native:
56.8% (254)Foreign-born:
96.8% (355)
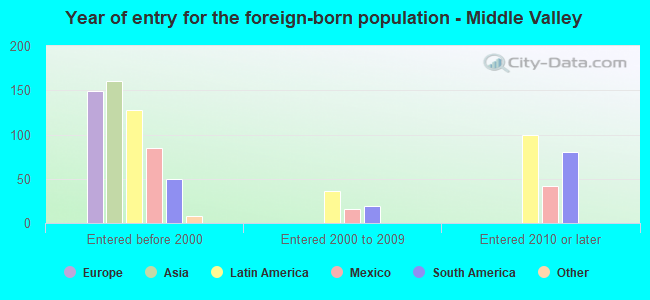
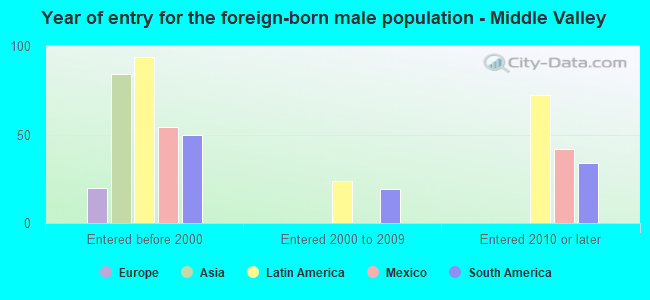
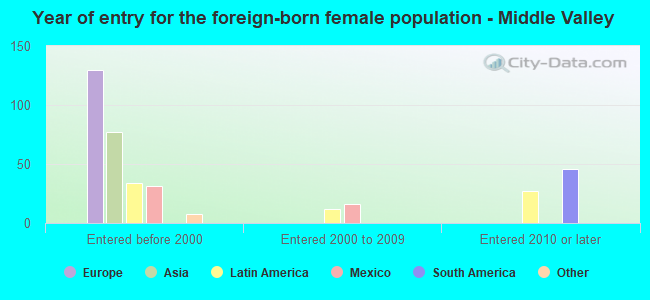
Foreign-born residents in Middle Valley 670 residents are foreign born (2.5% Latin America , 1.8% Asia , 1.0% Europe ).
This city:
5.7%Tennessee:
5.4%
Marital status for residents in Middle Valley Marital status - White (Caucasian) population 15 years and over
Males 32.1% Never married55.5% Now married0.2% Separated1.5% Widowed10.8% DivorcedFemales 12.4% Never married57.5% Now married2.8% Separated11.0% Widowed16.4% DivorcedWomen who gave birth in the past 12 months Now married:
80.1% (121)Unmarried:
19.9% (30)
Women who did not give birth in the past 12 months Now married:
59.2% (1,036)Unmarried:
40.8% (715)
Marital status - Black or African American population 15 years and over
Males 40.5% Never married57.5% Now married0.0% Separated0.0% Widowed2.0% DivorcedFemales 72.3% Never married27.7% Now married0.0% Separated0.0% Widowed0.0% DivorcedWomen who did not give birth in the past 12 months Now married:
37.2% (61)Unmarried:
62.8% (104)
Marital status - American Indian / Alaska Native population 15 years and over
Males 0.0% Never married100.0% Now married0.0% Separated0.0% Widowed0.0% DivorcedFemales 0.0% Never married100.0% Now married0.0% Separated0.0% Widowed0.0% DivorcedMarital status - Asian population 15 years and over
Males 47.7% Never married13.5% Now married0.0% Separated0.0% Widowed38.9% DivorcedFemales 36.2% Never married25.9% Now married0.0% Separated37.9% Widowed0.0% DivorcedWomen who did not give birth in the past 12 months Now married:
41.7% (31)Unmarried:
58.3% (44)
Marital status - Other race population 15 years and over
Males 74.3% Never married25.7% Now married0.0% Separated0.0% Widowed0.0% DivorcedFemales 100.0% Never married0.0% Now married0.0% Separated0.0% Widowed0.0% DivorcedWomen who did not give birth in the past 12 months Now married:
0.0% (0)Unmarried:
100.0% (15)
Marital status - Two or more races population 15 years and over
Males 43.5% Never married51.4% Now married0.0% Separated0.0% Widowed5.1% DivorcedFemales 38.9% Never married54.9% Now married5.7% Separated0.0% Widowed0.4% DivorcedWomen who did not give birth in the past 12 months Now married:
59.1% (188)Unmarried:
40.9% (131)
Marital status - White alone, not Hispanic / Latino population 15 years and over
Males 32.2% Never married55.2% Now married0.2% Separated1.5% Widowed10.9% DivorcedFemales 12.3% Never married58.7% Now married2.9% Separated10.4% Widowed15.8% DivorcedWomen who gave birth in the past 12 months Now married:
80.1% (122)Unmarried:
19.9% (30)
Women who did not give birth in the past 12 months Now married:
59.6% (1,030)Unmarried:
40.4% (699)
Marital status - Hispanic or Latino population 15 years and over
Males 42.8% Never married50.4% Now married0.0% Separated0.0% Widowed6.8% DivorcedFemales 43.1% Never married25.7% Now married4.9% Separated12.8% Widowed13.5% DivorcedWomen who did not give birth in the past 12 months Now married:
31.9% (68)Unmarried:
68.1% (145)
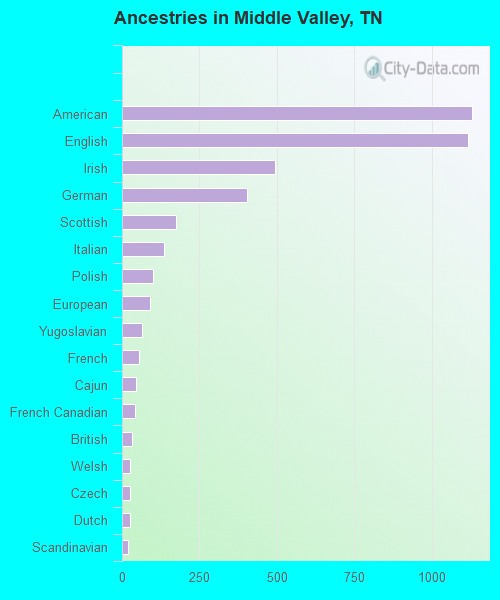
Ancestries in Middle Valley
1,128 19.9% American1,118 19.7% English493 8.7% Irish404 7.1% German175 3.1% Scottish137 2.4% Italian101 1.8% Polish90 1.6% European65 1.1% Yugoslavian54 1.0% French46 0.8% Cajun41 0.7% French Canadian31 0.5% British27 0.5% Welsh26 0.5% Czech25 0.4% Dutch19 0.3% Scandinavian10 0.2% African9 0.2% Norwegian5 0.09% Scotch-Irish
Children Nativity (place of birth) in Middle Valley
Children under 6 years - Living with two parents Both parents native 511 100.0% NativeChildren under 6 years - Living with one parent Native parent 164 100.0% Native
Children 6 to 17 years - Living with two parents Both parents native 1,033 100.0% NativeBoth parents foreign-born 92 100.0% NativeOne native, one foreign-born parent 76 100.0% NativeChildren 6 to 17 years - Living with one parent Native parent 666 100.0% Native
Grandparents responsible for own grandchildren in Middle Valley
Grandparents (30 to 59 years) White / Caucasian 23 66.9% Responsible for grandchildren12 33.1% Not responsible for grandchildrenBlack or African American 12 84.0% Responsible for grandchildren2 16.0% Not responsible for grandchildrenWhite alone, not Hispanic / Latino 20 59.7% Responsible for grandchildren14 40.3% Not responsible for grandchildren
Grandparents (60 years and over) Black or African American 75 100.0% Not responsible for grandchildren