Races in Middleburg-Clay Hill, Florida (FL) Detailed Stats
Ancestries, Foreign-born residents, place of birth
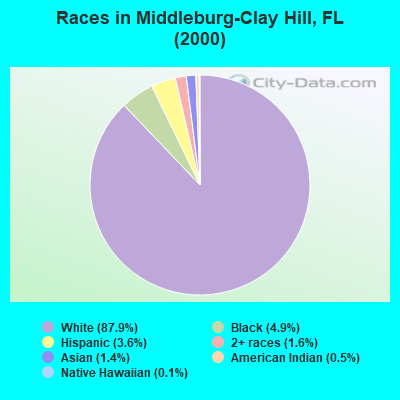
Race distribution in Middleburg-Clay Hill

- 25,26987.9%White alone
- 1,4154.9%Black alone
- 1,0343.6%Hispanic
- 4471.6%Two or more races
- 3901.4%Asian alone
- 1470.5%American Indian alone
- 310.1%Native Hawaiian and Other
Pacific Islander alone - 220.08%Other race alone
2000
2022
-
- 10,458,50965.4%White alone
- 2,682,71516.8%Hispanic
- 2,264,26814.2%Black alone
- 261,6931.6%Asian alone
- 236,9541.5%Two or more races
- 42,3580.3%American Indian alone
- 28,9940.2%Other race alone
- 6,8870.04%Native Hawaiian and Other
Pacific Islander alone

-
- 11,309,40350.8%White alone
- 6,025,03927.1%Hispanic
- 3,241,01514.6%Black alone
- 861,6303.9%Two or more races
- 623,6922.8%Asian alone
- 152,0540.7%Other race alone
- 22,5040.1%American Indian alone
- 9,4860.04%Native Hawaiian and Other
Pacific Islander alone

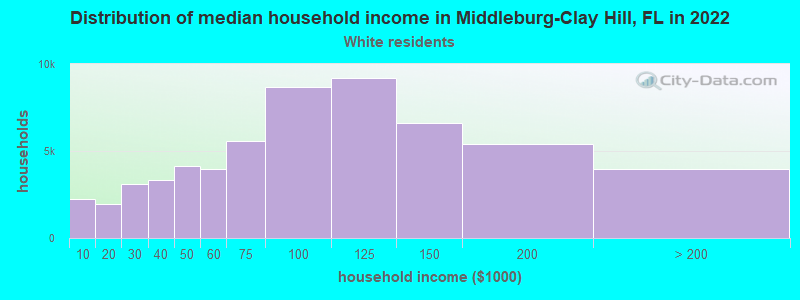
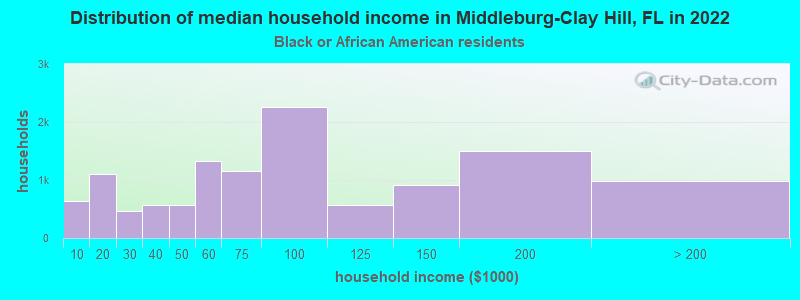
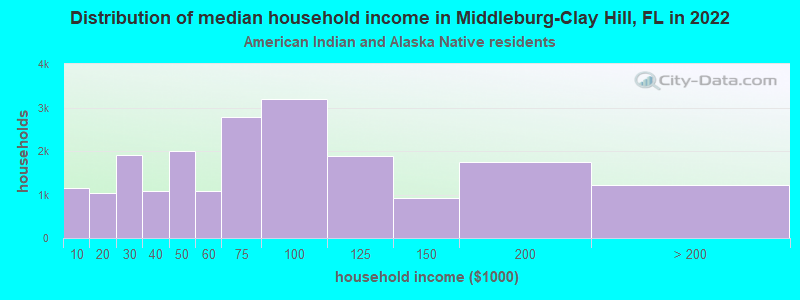
Income and house value in Middleburg-Clay Hill
- Median household income in 2022
- $85,498White non-Hispanic householders
- $112,230Black householders
- $80,545American Indian and Alaska Native householders
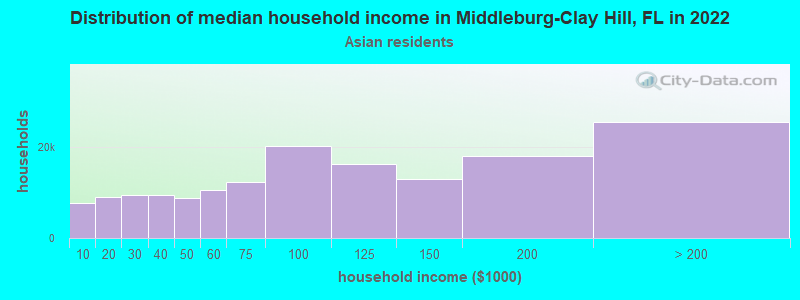
- $102,268Asian householders
- $48,780Some other race householders
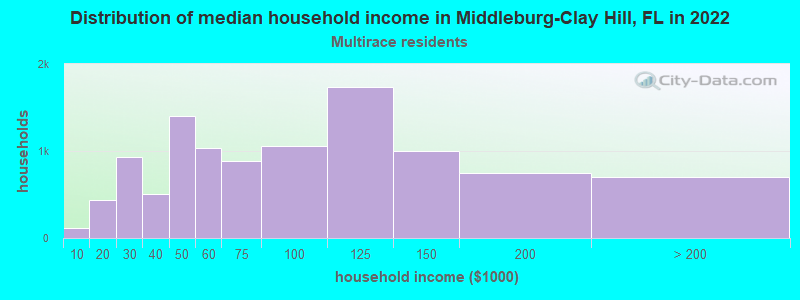
- $87,520Two or more races householders
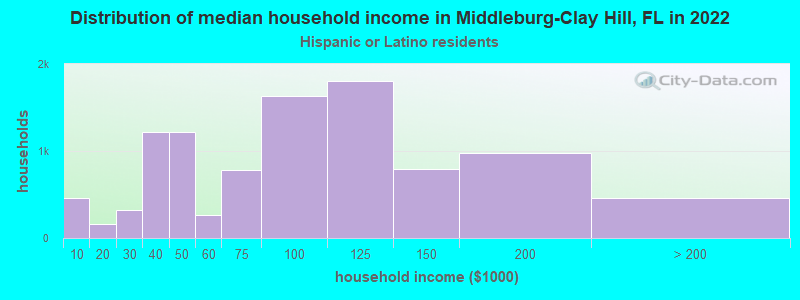
- $108,051Hispanic or Latino race householders
- Median 2022 house value
- $336,776White Non-Hispanic householders
- $361,441Black or African American householders
- $237,166American Indian or Alaska Native householders
- $406,028Asian householders
- $285,548Some other race householders
- $303,572Two or more races householders
- $326,340Hispanic or Latino householders
Household income for White non-Hispanic householders
Household income for Black householders
Household income for American Indian and Alaska Native householders
Household income for Asian householders
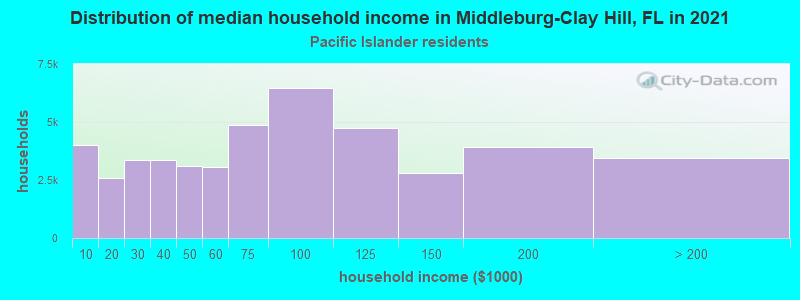
Household income for Native Hawaiian and other Pacific Islander householders
Household income for Two or more races householders
Household income for Hispanic or Latino race householders
Zip code: 32068