Races in Middleburg, Florida (FL) Detailed Stats
Ancestries, Foreign-born residents, place of birth
Settings
X


Recent posts about races in Middleburg, Florida on our local forum with over 2,400,000 registered users:
 | How to find a private new home construction inspector Middleburg Florida area? (10 replies) |
| Crime level in Fleming Island, Orange Park, Middleburg Areas? (2 replies) |
| New Home construction Tip (17 replies) |
| Green Cove Springs or Middleburg? (16 replies) |
| Best areas in Jacksonville / around Jacksonville for family of 4 (17 replies) |
| Moving from WV to FL, house hunt (5 replies) |
Latest news about races in Middleburg, FL collected exclusively by city-data.com from local newspapers, TV, and radio stations
According to 2022 data, the most numerous races in Middleburg, FL are White alone (10,484 residents), Hispanic (716 residents), and Black alone (338 residents). 95.1% of Middleburg residents speak English at home. 4.9% of Middleburg, FL residents are foreign-born (3.2% born in Latin America, 0.9% born in Europe), which is 328.8% less than the foreign-born rate of 21.0% across the entire state of Florida.
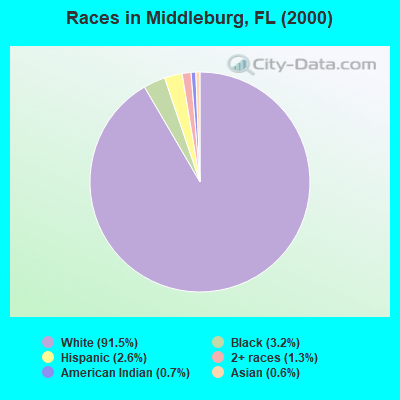
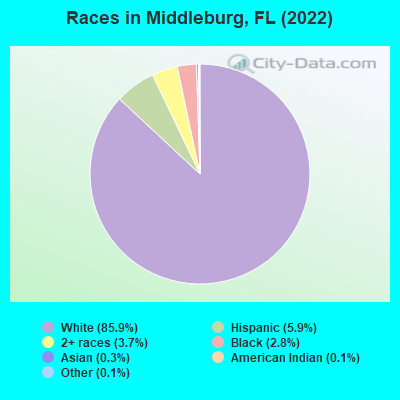
Race distribution in Middleburg
2000
2022

- 9,46091.5%White alone
- 3293.2%Black alone
- 2662.6%Hispanic
- 1391.3%Two or more races
- 720.7%American Indian alone
- 630.6%Asian alone
- 50.05%Native Hawaiian and Other
Pacific Islander alone - 40.04%Other race alone
-
- 10,48485.9%White alone
- 7165.9%Hispanic
- 4483.7%Two or more races
- 3382.8%Black alone
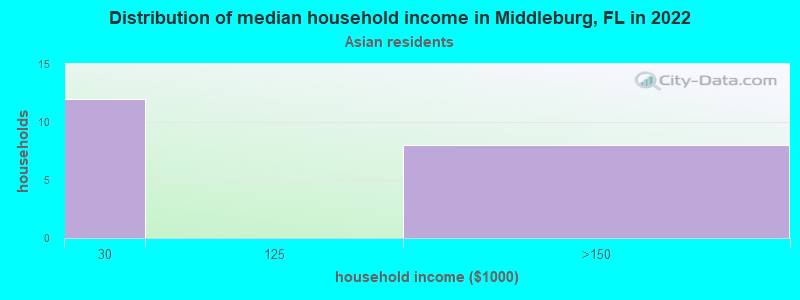
- 360.3%Asian alone
- 150.1%Other race alone
- 180.1%American Indian alone
2000
2022
-
- 10,458,50965.4%White alone
- 2,682,71516.8%Hispanic
- 2,264,26814.2%Black alone
- 261,6931.6%Asian alone
- 236,9541.5%Two or more races
- 42,3580.3%American Indian alone
- 28,9940.2%Other race alone
- 6,8870.04%Native Hawaiian and Other
Pacific Islander alone

-
- 11,309,40350.8%White alone
- 6,025,03927.1%Hispanic
- 3,241,01514.6%Black alone
- 861,6303.9%Two or more races
- 623,6922.8%Asian alone
- 152,0540.7%Other race alone
- 22,5040.1%American Indian alone
- 9,4860.04%Native Hawaiian and Other
Pacific Islander alone

Income and house value in Middleburg
- Median household income in 2022
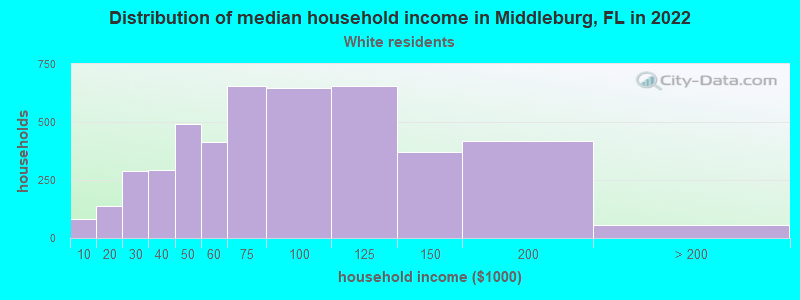
- $77,140White non-Hispanic householders
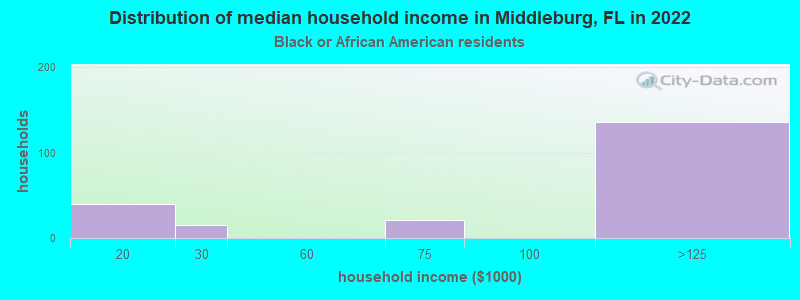
- $122,706Black householders
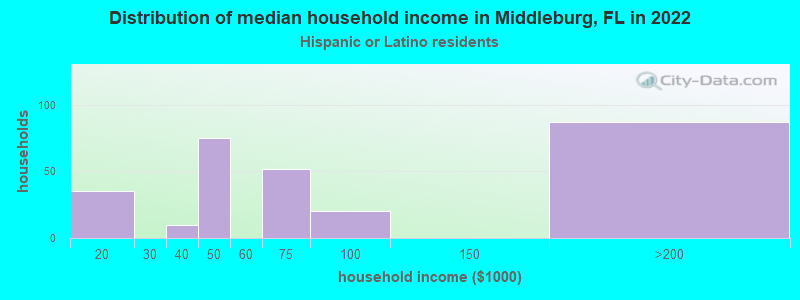
- $50,462Hispanic or Latino race householders
- Median 2022 house value
- $328,700White Non-Hispanic householders
- $240,560Black or African American householders
- $455,607American Indian or Alaska Native householders
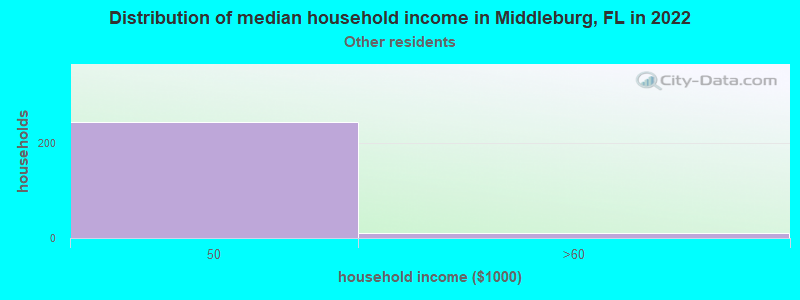
- $248,513Some other race householders
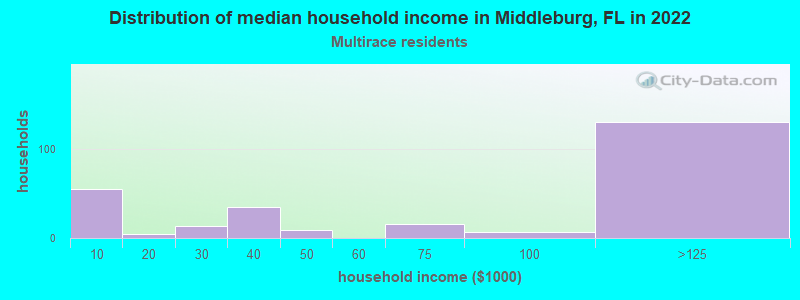
- $320,416Two or more races householders
- $281,648Hispanic or Latino householders
Household income for White non-Hispanic householders
Household income for Black householders
Household income for Asian householders
Household income for Some other race householders
Household income for Two or more races householders
Household income for Hispanic or Latino race householders
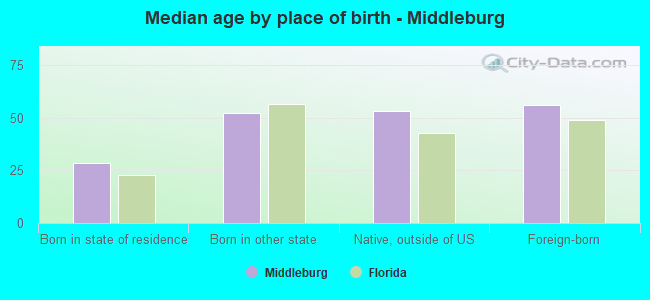
Median age by race in Middleburg
- 44.7Median age for White residents
- 41.7Males
- 48.4Females
- 44.7Median age for Black or African American residents
- 45.6Males
- -628,768,302.6Females
- -665,028,664.4Median age for American Indian / Alaska Native residents
- -673,283,704.9Males
- -594,925,633.7Females
- 64.1Median age for Asian residents
- -639,032,814.6Males
- 67.9Females
- -679,849,340.2Median age for Native Hawaiian / Pacific Islander residents
- -666,666,666.0Males
- -666,666,666.0Females
- 65.7Median age for Other race residents
- 52.4Males
- 60.4Females
- 59.7Median age for Two or more races residents
- 66.1Males
- 43.3Females
- 46.2Median age for White alone residents
- 42.0Males
- 48.7Females
- 50.8Median age for Hispanic or Latino residents
- 42.3Males
- 51.7Females
Owner/renter occupied households by race in Middleburg
- House owners and renters - White residents
- 3,81485.1%Owner occupied
- 66614.9%Renter occupied
- House owners and renters - Black or African American residents
- 13880.3%Owner occupied
- 3419.7%Renter occupied
- House owners and renters - Asian residents
- 24100.0%Owner occupied
- House owners and renters - Other race residents
- 203100.0%Owner occupied
- House owners and renters - Two or more races residents
- 24974.9%Owner occupied
- 8325.1%Renter occupied
- House owners and renters - White alone residents
- 3,75786.5%Owner occupied
- 58713.5%Renter occupied
- House owners and renters - Hispanic or Latino residents
- 34883.9%Owner occupied
- 6716.1%Renter occupied
Language usage in Middleburg
- English speakers - Total
- 95.1% of residents of Middleburg speak English at home.
- 3.8% of residents speak Spanish at home
- 32272.2%Speak English very well
- 12427.8%Speak English less than very well
- 1.6% of residents speak other language at home
- 16287.1%Speak English very well
- 2412.9%Speak English less than very well
- English speakers - Born in the United States
- 99.4% of residents of Middleburg speak English at home.
- 0.2% of residents speak Spanish at home
- 861.5%Speak English very well
- 538.5%Speak English less than very well
- 0.6% of residents speak other language at home
- 37100.0%Speak English very well
- English speakers - Native, born elsewhere
- 58.3% of residents of Middleburg speak English at home.
- 33.1% of residents speak Spanish at home
- 2136.2%Speak English very well
- 3763.8%Speak English less than very well
- 10.9% of residents speak other language at home
- 19100.0%Speak English very well
- English speakers - Foreign-born
- 16.6% of residents of Middleburg speak English at home.
- 51.6% of residents speak Spanish at home
- 21470.9%Speak English very well
- 8829.1%Speak English less than very well
- 16.2% of residents speak other language at home
- 7174.7%Speak English very well
- 2425.3%Speak English less than very well
White (Caucasian) - Speak only English
| Native: | 99.9% (9,990) |
| Foreign-born: | 5.3% (10) |
White (Caucasian) - Speak another language
| Native: | 1.0% (99) |
| Foreign-born: | 92.5% (175) |
Black or African American - Speak only English
| Native: | 99.8% (302) |
| Foreign-born: | 97.0% (51) |
Other race - Speak another language
| Native: | 75.6% (23) |
| Foreign-born: | 86.6% (351) |
Two or more races - Speak only English
| Native: | 100.0% (470) |
| Foreign-born: | 46.0% (14) |
White alone - Speak only English
| Native: | 99.2% (9,705) |
| Foreign-born: | 6.5% (10) |
White alone - Speak another language
| Native: | 0.9% (91) |
| Foreign-born: | 100.0% (158) |
Hispanic or Latino - Speak only English
| Native: | 86.5% (303) |
| Foreign-born: | 5.0% (15) |
Hispanic or Latino - Speak another language
| Native: | 19.9% (70) |
| Foreign-born: | 92.0% (269) |
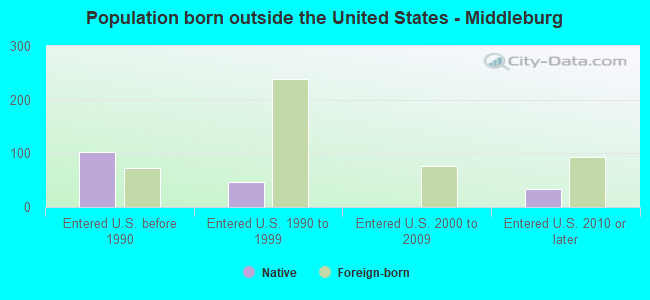
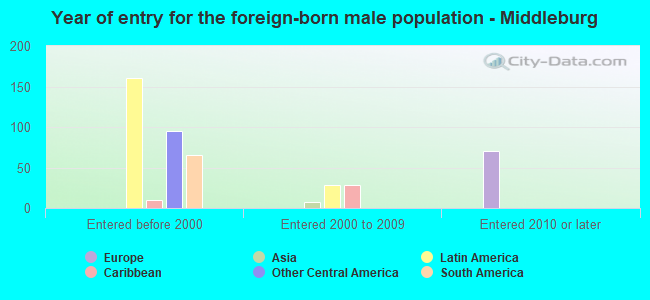
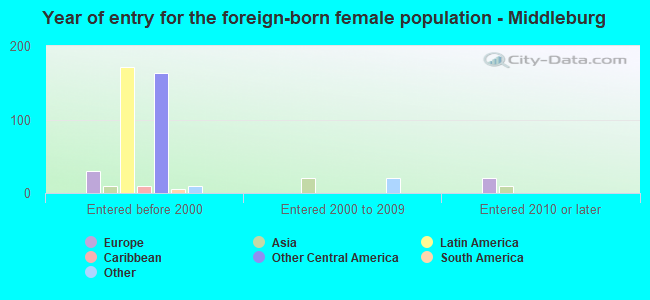
Foreign-born residents in Middleburg
598 residents are foreign born (3.2% Latin America, 0.9% Europe).
| This city: | 4.9% |
| Florida: | 21.1% |

Marital status for residents in Middleburg
Marital status - White (Caucasian) population 15 years and over
- Males
- 29.4%Never married
- 50.1%Now married
- 0.6%Separated
- 3.0%Widowed
- 17.0%Divorced
- Females
- 21.8%Never married
- 55.1%Now married
- 1.1%Separated
- 7.4%Widowed
- 14.6%Divorced
Women who gave birth in the past 12 months
| Now married: | 84.3% (74) |
| Unmarried: | 15.7% (14) |
Women who did not give birth in the past 12 months
| Now married: | 43.0% (924) |
| Unmarried: | 57.0% (1,222) |
Marital status - Black or African American population 15 years and over
- Males
- 0.0%Never married
- 69.8%Now married
- 10.0%Separated
- 0.0%Widowed
- 20.3%Divorced
- Females
- 0.0%Never married
- 56.5%Now married
- 0.0%Separated
- 43.5%Widowed
- 0.0%Divorced
Marital status - Asian population 15 years and over
- Males
- 0.0%Never married
- 100.0%Now married
- 0.0%Separated
- 0.0%Widowed
- 0.0%Divorced
- Females
- 0.0%Never married
- 63.2%Now married
- 0.0%Separated
- 36.8%Widowed
- 0.0%Divorced
Women who gave birth in the past 12 months
| Now married: | 100.0% (5) |
| Unmarried: | 0.0% (0) |
Women who did not give birth in the past 12 months
| Now married: | 100.0% (4) |
| Unmarried: | 0.0% (0) |
Marital status - Other race population 15 years and over
- Males
- 5.6%Never married
- 94.4%Now married
- 0.0%Separated
- 0.0%Widowed
- 0.0%Divorced
- Females
- 8.2%Never married
- 91.8%Now married
- 0.0%Separated
- 0.0%Widowed
- 0.0%Divorced
Women who did not give birth in the past 12 months
| Now married: | 0.0% (0) |
| Unmarried: | 100.0% (21) |
Marital status - Two or more races population 15 years and over
- Males
- 19.9%Never married
- 37.1%Now married
- 0.0%Separated
- 0.0%Widowed
- 43.0%Divorced
- Females
- 18.5%Never married
- 53.1%Now married
- 0.0%Separated
- 23.5%Widowed
- 4.9%Divorced
Women who did not give birth in the past 12 months
| Now married: | 31.8% (12) |
| Unmarried: | 68.2% (25) |
Marital status - White alone, not Hispanic / Latino population 15 years and over
- Males
- 30.0%Never married
- 49.9%Now married
- 0.6%Separated
- 3.1%Widowed
- 16.5%Divorced
- Females
- 20.6%Never married
- 56.2%Now married
- 0.9%Separated
- 7.7%Widowed
- 14.5%Divorced
Women who gave birth in the past 12 months
| Now married: | 84.3% (75) |
| Unmarried: | 15.7% (14) |
Women who did not give birth in the past 12 months
| Now married: | 44.6% (911) |
| Unmarried: | 55.4% (1,133) |
Marital status - Hispanic or Latino population 15 years and over
- Males
- 12.7%Never married
- 66.8%Now married
- 0.0%Separated
- 0.0%Widowed
- 20.5%Divorced
- Females
- 28.0%Never married
- 59.9%Now married
- 2.7%Separated
- 2.9%Widowed
- 6.5%Divorced
Women who did not give birth in the past 12 months
| Now married: | 15.8% (22) |
| Unmarried: | 84.2% (119) |
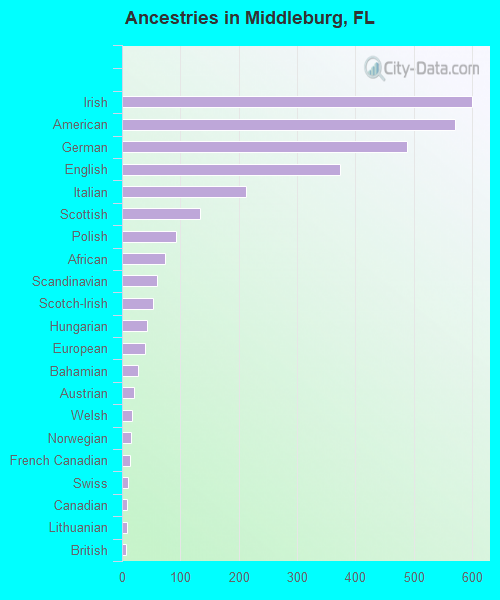
Ancestries in Middleburg

- 59915.5%Irish
- 57114.7%American
- 48812.6%German
- 3749.7%English
- 2135.5%Italian
- 1343.5%Scottish
- 922.4%Polish
- 731.9%African
- 601.5%Scandinavian
- 531.4%Scotch-Irish
- 431.1%Hungarian
- 391.0%European
- 280.7%Bahamian
- 210.5%Austrian
- 170.4%Welsh
- 160.4%Norwegian
- 130.3%French Canadian
- 100.3%Swiss
- 90.2%Canadian
- 80.2%Lithuanian
- 70.2%British
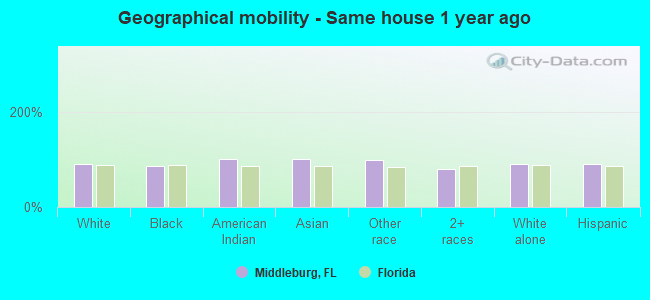
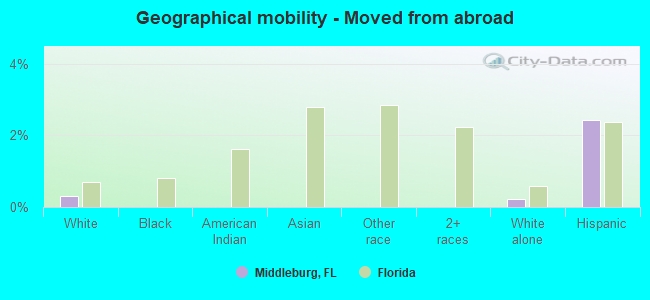
Geographical mobility in Middleburg

- Same house 1 year ago
- 9,66791.1%White (Caucasian)
- 29585.6%Black or African American
- 24100.0%American Indian / Alaska Native
- 48100.0%Asian
- 40198.6%Other race
- 38580.0%Two or more races
- 9,49291.4%White alone, not Hispanic / Latino
- 65290.0%Hispanic or Latino
-
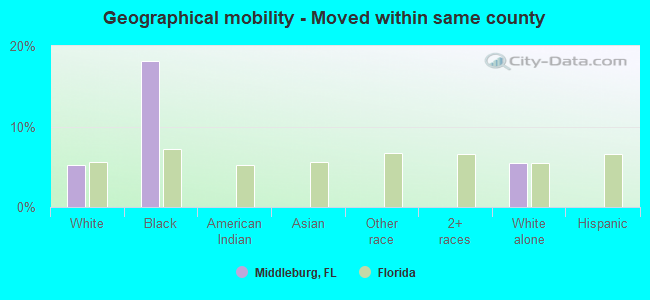
- Moved within same county
- 5525.2%White / Caucasian
- 6218.1%Black or African American
- 5635.4%White alone, not Hispanic / Latino
-
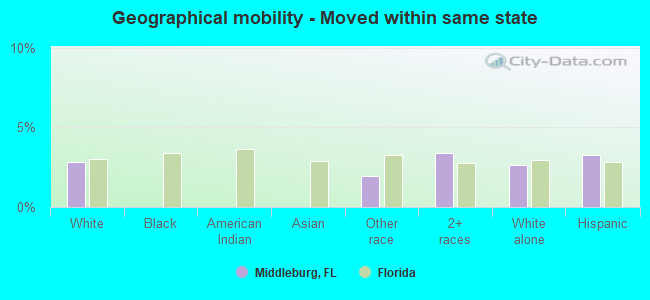
- Moved within same state
- 2972.8%White / Caucasian
- 81.9%Other race
- 163.4%Two or more races
- 2752.6%White alone, not Hispanic / Latino
- 243.3%Hispanic or Latino
-
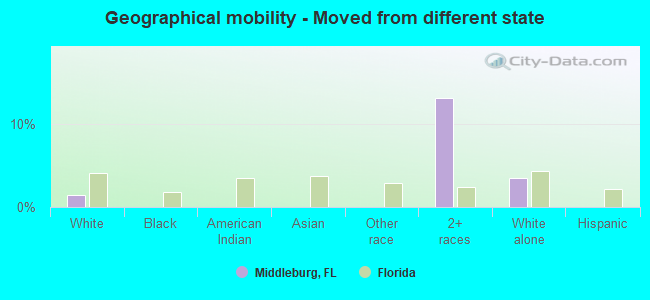
- Moved from different state
- 1511.4%White / Caucasian
- 6313.2%Two or more races
- 3653.5%White alone, not Hispanic / Latino
-
- Moved from abroad
- 320.3%White
- 220.2%White alone, not Hispanic / Latino
- 182.4%Hispanic or Latino
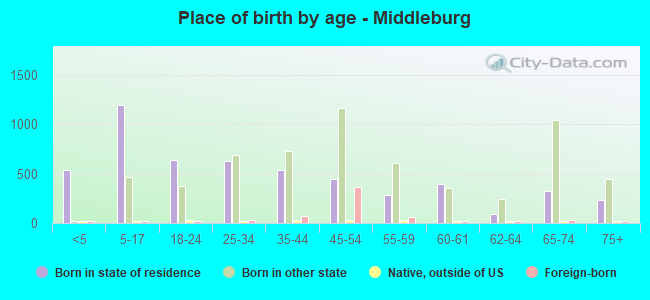
Children Nativity (place of birth) in Middleburg
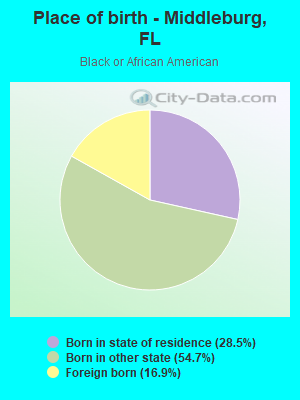
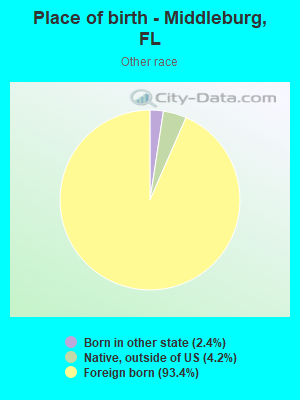
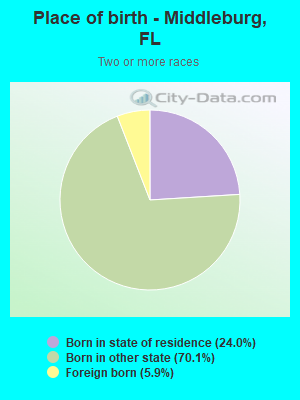
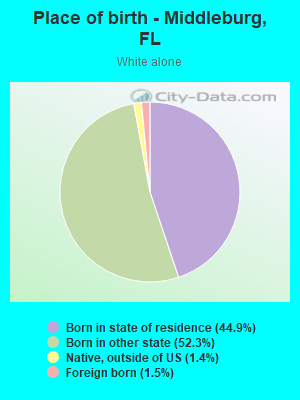
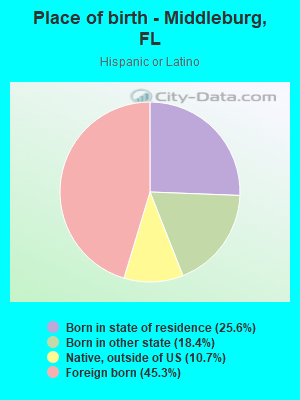
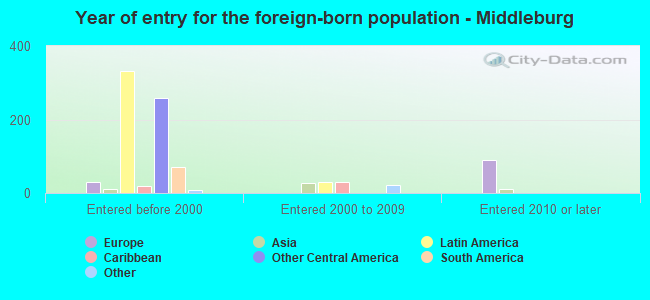
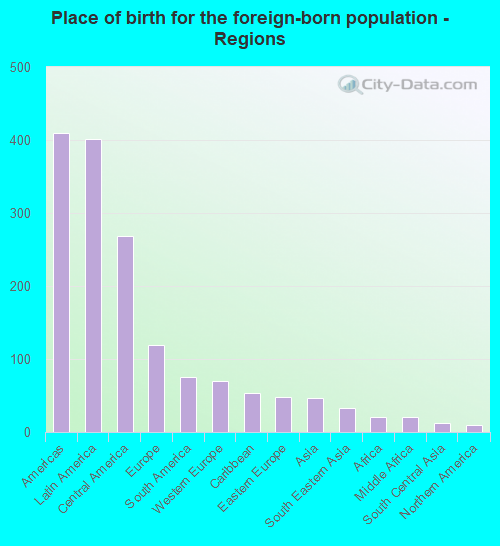
Place of birth for residents in Middleburg
![Place of birth for the foreign-born population - Regions]()
- 410Americas
- 401Latin America
- 269Central America
- 119Europe
- 76South America
- 70Western Europe
- 54Caribbean
- 48Eastern Europe
- 47Asia
- 33South Eastern Asia
- 21Africa
- 21Middle Africa
- 13South Central Asia
- 9Northern America
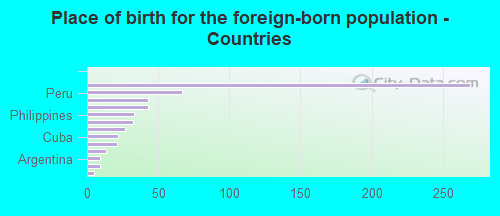
![Place of birth for the foreign-born population - Countries]()
- 269El Salvador
- 67Peru
- 43France
- 43Hungary
- 33Philippines
- 32Bahamas
- 27Germany
- 22Cuba
- 21Cameroon
- 13India
- 9Argentina
- 9Canada
- 5Poland
Grandparents responsible for own grandchildren in Middleburg
Zip codes: 32068.