Races in Middleburg Heights, Ohio (OH) Detailed Stats
Data:
Races - White alone (%)
Races - White alone (% change since 2000)
Races - Black alone (%)
Races - Black alone (% change since 2000)
Races - American Indian alone (%)
Races - American Indian alone (% change since 2000)
Races - Asian alone (%)
Races - Asian alone (% change since 2000)
Races - Hispanic (%)
Races - Hispanic (% change since 2000)
Races - Native Hawaiian and Other Pacific Islander alone (%)
Races - Native Hawaiian and Other Pacific Islander alone (% change since 2000)
Races - Two or more races(%)
Races - Two or more races(% change since 2000)
Races - Other race alone (%)
Races - Other race alone (% change since 2000)
Racial diversity
Place of birth - Born in state of residence (%)
Place of birth - Born in state of residence (%) - White
Place of birth - Born in state of residence (%) - Black or African American
Place of birth - Born in state of residence (%) - Asian
Place of birth - Born in state of residence (%) - Hispanic or Latino
Place of birth - Born in state of residence (%) - American Indian and Alaska Native
Place of birth - Born in state of residence (%) - Multirace
Place of birth - Born in state of residence (%) - Other Race
Place of birth - Born in other state (%)
Place of birth - Born in other state (%) - White
Place of birth - Born in other state (%) - Black or African American
Place of birth - Born in other state (%) - Asian
Place of birth - Born in other state (%) - Hispanic or Latino
Place of birth - Born in other state (%) - American Indian and Alaska Native
Place of birth - Born in other state (%) - Multirace
Place of birth - Born in other state (%) - Other Race
Place of birth - Native, outside of US (%)
Place of birth - Native, outside of US (%) - White
Place of birth - Native, outside of US (%) - Black or African American
Place of birth - Native, outside of US (%) - Asian
Place of birth - Native, outside of US (%) - Hispanic or Latino
Place of birth - Native, outside of US (%) - American Indian and Alaska Native
Place of birth - Native, outside of US (%) - Multirace
Place of birth - Native, outside of US (%) - Other Race
Place of birth - Foreign born (%)
Place of birth - Foreign born (%) - White
Place of birth - Foreign born (%) - Black or African American
Place of birth - Foreign born (%) - Asian
Place of birth - Foreign born (%) - Hispanic or Latino
Place of birth - Foreign born (%) - American Indian and Alaska Native
Place of birth - Foreign born (%) - Multirace
Place of birth - Foreign born (%) - Other Race
Residents speaking English at home (%)
Residents speaking English at home - Born in the United States (%)
Residents speaking English at home - Native, born elsewhere (%)
Residents speaking English at home - Foreign born (%)
Residents speaking Spanish at home (%)
Residents speaking Spanish at home - Born in the United States (%)
Residents speaking Spanish at home - Native, born elsewhere (%)
Residents speaking Spanish at home - Foreign born (%)
Residents speaking other language at home (%)
Residents speaking other language at home - Born in the United States (%)
Residents speaking other language at home - Native, born elsewhere (%)
Residents speaking other language at home - Foreign born (%)
Marital status - Never married (%)
Marital status - Now married (%)
Marital status - Separated (%)
Marital status - Widowed (%)
Marital status - Divorced (%)
Ancestries Reported - Arab (%)
Ancestries Reported - Czech (%)
Ancestries Reported - Danish (%)
Ancestries Reported - Dutch (%)
Ancestries Reported - English (%)
Ancestries Reported - French (%)
Ancestries Reported - French Canadian (%)
Ancestries Reported - German (%)
Ancestries Reported - Greek (%)
Ancestries Reported - Hungarian (%)
Ancestries Reported - Irish (%)
Ancestries Reported - Italian (%)
Ancestries Reported - Lithuanian (%)
Ancestries Reported - Norwegian (%)
Ancestries Reported - Polish (%)
Ancestries Reported - Portuguese (%)
Ancestries Reported - Russian (%)
Ancestries Reported - Scotch-Irish (%)
Ancestries Reported - Scottish (%)
Ancestries Reported - Slovak (%)
Ancestries Reported - Subsaharan African (%)
Ancestries Reported - Swedish (%)
Ancestries Reported - Swiss (%)
Ancestries Reported - Ukrainian (%)
Ancestries Reported - United States (%)
Ancestries Reported - Welsh (%)
Ancestries Reported - West Indian (%)
Ancestries Reported - Other (%)
Geographical mobility - Same house 1 year ago (%)
Geographical mobility - Same house 1 year ago (%) - White
Geographical mobility - Same house 1 year ago (%) - Black or African American
Geographical mobility - Same house 1 year ago (%) - Asian
Geographical mobility - Same house 1 year ago (%) - Hispanic or Latino
Geographical mobility - Same house 1 year ago (%) - American Indian and Alaska Native
Geographical mobility - Same house 1 year ago (%) - Multirace
Geographical mobility - Same house 1 year ago (%) - Other Race
Geographical mobility - Moved within same county (%)
Geographical mobility - Moved within same county (%) - White
Geographical mobility - Moved within same county (%) - Black or African American
Geographical mobility - Moved within same county (%) - Asian
Geographical mobility - Moved within same county (%) - Hispanic or Latino
Geographical mobility - Moved within same county (%) - American Indian and Alaska Native
Geographical mobility - Moved within same county (%) - Multirace
Geographical mobility - Moved within same county (%) - Other Race
Geographical mobility - Moved from different county within same state (%)
Geographical mobility - Moved from different county within same state (%) - White
Geographical mobility - Moved from different county within same state (%) - Black or African American
Geographical mobility - Moved from different county within same state (%) - Asian
Geographical mobility - Moved from different county within same state (%) - Hispanic or Latino
Geographical mobility - Moved from different county within same state (%) - American Indian and Alaska Native
Geographical mobility - Moved from different county within same state (%) - Multirace
Geographical mobility - Moved from different county within same state (%) - Other Race
Geographical mobility - Moved from different state (%)
Geographical mobility - Moved from different state (%) - White
Geographical mobility - Moved from different state (%) - Black or African American
Geographical mobility - Moved from different state (%) - Asian
Geographical mobility - Moved from different state (%) - Hispanic or Latino
Geographical mobility - Moved from different state (%) - American Indian and Alaska Native
Geographical mobility - Moved from different state (%) - Multirace
Geographical mobility - Moved from different state (%) - Other Race
Geographical mobility - Moved from abroad (%)
Geographical mobility - Moved from abroad (%) - White
Geographical mobility - Moved from abroad (%) - Black or African American
Geographical mobility - Moved from abroad (%) - Asian
Geographical mobility - Moved from abroad (%) - Hispanic or Latino
Geographical mobility - Moved from abroad (%) - American Indian and Alaska Native
Geographical mobility - Moved from abroad (%) - Multirace
Geographical mobility - Moved from abroad (%) - Other Race
Place of birth for the foreign-born population - Ireland (%)
Place of birth for the foreign-born population - Denmark (%)
Place of birth for the foreign-born population - Norway (%)
Place of birth for the foreign-born population - Sweden (%)
Place of birth for the foreign-born population - United Kingdom (%)
Place of birth for the foreign-born population - England (%)
Place of birth for the foreign-born population - Scotland (%)
Place of birth for the foreign-born population - Other Northern Europe (%)
Place of birth for the foreign-born population - Austria (%)
Place of birth for the foreign-born population - Belgium (%)
Place of birth for the foreign-born population - France (%)
Place of birth for the foreign-born population - Germany (%)
Place of birth for the foreign-born population - Netherlands (%)
Place of birth for the foreign-born population - Switzerland (%)
Place of birth for the foreign-born population - Other Western Europe (%)
Place of birth for the foreign-born population - Greece (%)
Place of birth for the foreign-born population - Italy (%)
Place of birth for the foreign-born population - Portugal (%)
Place of birth for the foreign-born population - Spain (%)
Place of birth for the foreign-born population - Other Southern Europe (%)
Place of birth for the foreign-born population - Albania (%)
Place of birth for the foreign-born population - Belarus (%)
Place of birth for the foreign-born population - Bosnia and Herzegovina (%)
Place of birth for the foreign-born population - Bulgaria (%)
Place of birth for the foreign-born population - Croatia (%)
Place of birth for the foreign-born population - Czechoslovakia (%)
Place of birth for the foreign-born population - Hungary (%)
Place of birth for the foreign-born population - Latvia (%)
Place of birth for the foreign-born population - Lithuania (%)
Place of birth for the foreign-born population - North Macedonia (Macedonia) (%)
Place of birth for the foreign-born population - Moldova (%)
Place of birth for the foreign-born population - Poland (%)
Place of birth for the foreign-born population - Romania (%)
Place of birth for the foreign-born population - Russia (%)
Place of birth for the foreign-born population - Serbia (%)
Place of birth for the foreign-born population - Ukraine (%)
Place of birth for the foreign-born population - Other Eastern Europe (%)
Place of birth for the foreign-born population - China (%)
Place of birth for the foreign-born population - Hong Kong (%)
Place of birth for the foreign-born population - Taiwan (%)
Place of birth for the foreign-born population - Japan (%)
Place of birth for the foreign-born population - Korea (%)
Place of birth for the foreign-born population - Other Eastern Asia (%)
Place of birth for the foreign-born population - Afghanistan (%)
Place of birth for the foreign-born population - Bangladesh (%)
Place of birth for the foreign-born population - India (%)
Place of birth for the foreign-born population - Iran (%)
Place of birth for the foreign-born population - Kazakhstan (%)
Place of birth for the foreign-born population - Nepal (%)
Place of birth for the foreign-born population - Pakistan (%)
Place of birth for the foreign-born population - Sri Lanka (%)
Place of birth for the foreign-born population - Uzbekistan (%)
Place of birth for the foreign-born population - Other South Central Asia (%)
Place of birth for the foreign-born population - Burma (%)
Place of birth for the foreign-born population - Cambodia (%)
Place of birth for the foreign-born population - Indonesia (%)
Place of birth for the foreign-born population - Laos (%)
Place of birth for the foreign-born population - Malaysia (%)
Place of birth for the foreign-born population - Philippines (%)
Place of birth for the foreign-born population - Singapore (%)
Place of birth for the foreign-born population - Thailand (%)
Place of birth for the foreign-born population - Vietnam (%)
Place of birth for the foreign-born population - Other South Eastern Asia (%)
Place of birth for the foreign-born population - Armenia (%)
Place of birth for the foreign-born population - Iraq (%)
Place of birth for the foreign-born population - Israel (%)
Place of birth for the foreign-born population - Jordan (%)
Place of birth for the foreign-born population - Kuwait (%)
Place of birth for the foreign-born population - Lebanon (%)
Place of birth for the foreign-born population - Saudi Arabia (%)
Place of birth for the foreign-born population - Syria (%)
Place of birth for the foreign-born population - Turkey (%)
Place of birth for the foreign-born population - Yemen (%)
Place of birth for the foreign-born population - Other Western Asia (%)
Place of birth for the foreign-born population - Eritrea (%)
Place of birth for the foreign-born population - Ethiopia (%)
Place of birth for the foreign-born population - Kenya (%)
Place of birth for the foreign-born population - Somalia (%)
Place of birth for the foreign-born population - Uganda (%)
Place of birth for the foreign-born population - Zimbabwe (%)
Place of birth for the foreign-born population - Other Eastern Africa (%)
Place of birth for the foreign-born population - Cameroon (%)
Place of birth for the foreign-born population - Congo (%)
Place of birth for the foreign-born population - Democratic Republic of Congo (Zaire) (%)
Place of birth for the foreign-born population - Other Middle Africa (%)
Place of birth for the foreign-born population - Egypt (%)
Place of birth for the foreign-born population - Morocco (%)
Place of birth for the foreign-born population - Sudan (%)
Place of birth for the foreign-born population - Other Northern Africa (%)
Place of birth for the foreign-born population - South Africa (%)
Place of birth for the foreign-born population - Other Southern Africa (%)
Place of birth for the foreign-born population - Cabo Verde (%)
Place of birth for the foreign-born population - Ghana (%)
Place of birth for the foreign-born population - Liberia (%)
Place of birth for the foreign-born population - Nigeria (%)
Place of birth for the foreign-born population - Senegal (%)
Place of birth for the foreign-born population - Sierra Leone (%)
Place of birth for the foreign-born population - Other Western Africa (%)
Place of birth for the foreign-born population - Australia (%)
Place of birth for the foreign-born population - New Zealand (%)
Place of birth for the foreign-born population - Fiji (%)
Place of birth for the foreign-born population - Micronesia (%)
Place of birth for the foreign-born population - Bahamas (%)
Place of birth for the foreign-born population - Barbados (%)
Place of birth for the foreign-born population - Cuba (%)
Place of birth for the foreign-born population - Dominica (%)
Place of birth for the foreign-born population - Dominican Republic (%)
Place of birth for the foreign-born population - Grenada (%)
Place of birth for the foreign-born population - Haiti (%)
Place of birth for the foreign-born population - Jamaica (%)
Place of birth for the foreign-born population - St. Vincent and the Grenadines (%)
Place of birth for the foreign-born population - Trinidad and Tobago (%)
Place of birth for the foreign-born population - West Indies (%)
Place of birth for the foreign-born population - Other Caribbean (%)
Place of birth for the foreign-born population - Belize (%)
Place of birth for the foreign-born population - Costa Rica (%)
Place of birth for the foreign-born population - El Salvador (%)
Place of birth for the foreign-born population - Guatemala (%)
Place of birth for the foreign-born population - Honduras (%)
Place of birth for the foreign-born population - Mexico (%)
Place of birth for the foreign-born population - Nicaragua (%)
Place of birth for the foreign-born population - Panama (%)
Place of birth for the foreign-born population - Other Central America (%)
Place of birth for the foreign-born population - Argentina (%)
Place of birth for the foreign-born population - Bolivia (%)
Place of birth for the foreign-born population - Brazil (%)
Place of birth for the foreign-born population - Chile (%)
Place of birth for the foreign-born population - Colombia (%)
Place of birth for the foreign-born population - Ecuador (%)
Place of birth for the foreign-born population - Guyana (%)
Place of birth for the foreign-born population - Peru (%)
Place of birth for the foreign-born population - Uruguay (%)
Place of birth for the foreign-born population - Venezuela (%)
Place of birth for the foreign-born population - Other South America (%)
Place of birth for the foreign-born population - Canada (%)
Place of birth for the foreign-born population - Other Northern America (%)
Place of birth for the foreign-born population - Other (%)
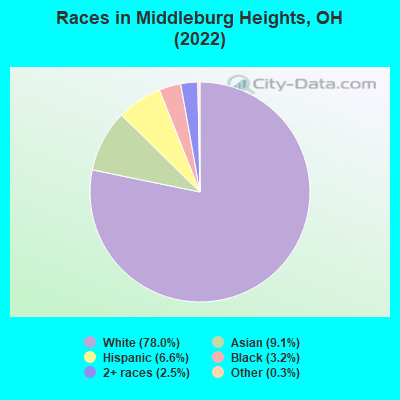
According to 2022 data, the most numerous races in Middleburg Heights, OH are White alone (12,205 residents), Black alone (508 residents), and Two or more races (395 residents). 82.7% of Middleburg Heights residents speak English at home. 15.4% of Middleburg Heights, OH residents are foreign-born (7.7% born in Asia, 4.7% born in Europe, 1.8% born in Latin America), which is 74.0% greater than the foreign-born rate of 4.0% across the entire state of Ohio.
Race distribution in Middleburg Heights
2000 2022
9,538,111 84.0% White alone 1,290,662 11.4% Black alone 217,123 1.9% Hispanic 137,770 1.2% Two or more races 131,670 1.2% Asian alone 21,985 0.2% American Indian alone 13,483 0.1% Other race alone 2,336 0.02% Native Hawaiian and Other
8,948,793 76.1% White alone 1,401,403 11.9% Black alone 529,291 4.5% Two or more races 517,232 4.4% Hispanic 293,387 2.5% Asian alone 52,805 0.4% Other race alone 9,785 0.08% American Indian alone 3,362 0.03% Native Hawaiian and Other
Income and house value in Middleburg Heights Median household income in 2022 $72,319 White non-Hispanic householders$83,453 Asian householders$86,442 Two or more races householders$88,333 Hispanic or Latino race householdersMedian 2022 house value $228,436 White Non-Hispanic householders$198,602 Black or African American householders$154,666 American Indian or Alaska Native householders $218,343 Asian householders$166,986 Some other race householders$223,983 Two or more races householders$165,501 Hispanic or Latino householders
Median age by race in Middleburg Heights
54.1 Median age for White residents50.4 56.7 53.4 Median age for Black or African American residents55.7 51.7 -545,601,290.8 Median age for American Indian / Alaska Native residents-734,374,999.3 -499,999,999.5 34.4 Median age for Asian residents36.6 31.2 -706,093,189.3 Median age for Native Hawaiian / Pacific Islander residents-750,242,953.6 -805,394,989.6 31.3 Median age for Other race residents27.3 43.9 43.2 Median age for Two or more races residents26.1 43.9 54.2 Median age for White alone residents50.1 56.8 41.6 Median age for Hispanic or Latino residents30.6 41.2
Owner/renter occupied households by race in Middleburg Heights
House owners and renters - White residents 4,806 77.4% Owner occupied1,406 22.6% Renter occupiedHouse owners and renters - Black or African American residents 34 13.5% Owner occupied220 86.5% Renter occupiedHouse owners and renters - American Indian / Alaska Native residents 5 100.0% Renter occupiedHouse owners and renters - Asian residents 79 15.3% Owner occupied434 84.7% Renter occupiedHouse owners and renters - Other race residents 7 10.3% Owner occupied57 89.7% Renter occupiedHouse owners and renters - Two or more races residents 306 82.7% Owner occupied64 17.3% Renter occupiedHouse owners and renters - White alone residents 4,711 76.6% Owner occupied1,440 23.4% Renter occupiedHouse owners and renters - Hispanic or Latino residents 272 83.6% Owner occupied53 16.4% Renter occupied
Language usage in Middleburg Heights
English speakers - Total 82.7% of residents of Middleburg Heights speak English at home.
3.6% of residents speak Spanish at home 410 77.5% Speak English very well119 22.5% Speak English less than very well13.8% of residents speak other language at home 1,354 66.3% Speak English very well688 33.7% Speak English less than very well
English speakers - Born in the United States 91.3% of residents of Middleburg Heights speak English at home.
3.5% of residents speak Spanish at home 67 100.0% Speak English very well5.2% of residents speak other language at home 74 74.7% Speak English very well25 25.3% Speak English less than very well
English speakers - Native, born elsewhere 12.4% of residents of Middleburg Heights speak English at home.
64.1% of residents speak Spanish at home 76 81.7% Speak English very well17 18.3% Speak English less than very well13.1% of residents speak other language at home 19 100.0% Speak English very well
English speakers - Foreign-born 12.4% of residents of Middleburg Heights speak English at home.
13.5% of residents speak Spanish at home 180 60.2% Speak English very well119 39.8% Speak English less than very well73.8% of residents speak other language at home 1,028 62.8% Speak English very well609 37.2% Speak English less than very well
White (Caucasian) - Speak only English Native:
98.1% (10,725)Foreign-born:
16.8% (149)
White (Caucasian) - Speak another language Native:
2.3% (249)Foreign-born:
83.0% (734)
Asian - Speak only English Native:
56.9% (90)Foreign-born:
11.7% (116)
Asian - Speak another language Native:
41.9% (67)Foreign-born:
88.3% (873)
Other race - Speak another language Native:
100.0% (55)Foreign-born:
100.0% (71)
Two or more races - Speak only English Native:
66.1% (542)Foreign-born:
13.6% (34)
Two or more races - Speak another language Native:
35.8% (294)Foreign-born:
86.7% (218)
White alone - Speak only English Native:
97.5% (10,573)Foreign-born:
18.0% (151)
White alone - Speak another language Native:
2.4% (259)Foreign-born:
82.1% (690)
Hispanic or Latino - Speak only English Native:
54.4% (358)Foreign-born:
5.7% (18)
Hispanic or Latino - Speak another language Native:
45.9% (302)Foreign-born:
94.3% (290)
Foreign-born residents in Middleburg Heights 2,409 residents are foreign born (7.7% Asia , 4.7% Europe , 1.8% Latin America ).
Marital status for residents in Middleburg Heights Marital status - White (Caucasian) population 15 years and over
Males 30.1% Never married50.0% Now married0.0% Separated4.2% Widowed15.6% DivorcedFemales 20.1% Never married48.1% Now married1.1% Separated12.8% Widowed17.9% DivorcedWomen who gave birth in the past 12 months Now married:
53.3% (45)Unmarried:
46.7% (39)
Women who did not give birth in the past 12 months Now married:
49.9% (885)Unmarried:
50.1% (888)
Marital status - Black or African American population 15 years and over
Males 35.7% Never married15.5% Now married15.0% Separated1.9% Widowed31.9% DivorcedFemales 53.1% Never married3.9% Now married0.0% Separated13.3% Widowed29.8% DivorcedWomen who did not give birth in the past 12 months Now married:
0.0% (0)Unmarried:
100.0% (129)
Marital status - American Indian / Alaska Native population 15 years and over
Males 0.0% Never married100.0% Now married0.0% Separated0.0% Widowed0.0% DivorcedFemales 100.0% Never married0.0% Now married0.0% Separated0.0% Widowed0.0% DivorcedMarital status - Asian population 15 years and over
Males 3.7% Never married92.8% Now married0.0% Separated0.9% Widowed2.6% DivorcedFemales 9.4% Never married86.5% Now married0.0% Separated1.1% Widowed3.0% DivorcedWomen who gave birth in the past 12 months Now married:
100.0% (18)Unmarried:
0.0% (0)
Women who did not give birth in the past 12 months Now married:
85.4% (348)Unmarried:
14.6% (59)
Marital status - Other race population 15 years and over
Males 72.1% Never married27.9% Now married0.0% Separated0.0% Widowed0.0% DivorcedFemales 19.6% Never married80.4% Now married0.0% Separated0.0% Widowed0.0% DivorcedWomen who did not give birth in the past 12 months Now married:
78.0% (55)Unmarried:
22.0% (16)
Marital status - Two or more races population 15 years and over
Males 45.0% Never married55.0% Now married0.0% Separated0.0% Widowed0.0% DivorcedFemales 24.8% Never married46.5% Now married0.0% Separated2.8% Widowed25.9% DivorcedWomen who did not give birth in the past 12 months Now married:
39.0% (115)Unmarried:
61.0% (179)
Marital status - White alone, not Hispanic / Latino population 15 years and over
Males 30.5% Never married50.7% Now married0.0% Separated4.3% Widowed14.5% DivorcedFemales 19.5% Never married48.2% Now married1.1% Separated13.0% Widowed18.2% DivorcedWomen who gave birth in the past 12 months Now married:
53.3% (46)Unmarried:
46.7% (40)
Women who did not give birth in the past 12 months Now married:
50.8% (893)Unmarried:
49.2% (864)
Marital status - Hispanic or Latino population 15 years and over
Males 34.7% Never married45.6% Now married0.0% Separated0.0% Widowed19.7% DivorcedFemales 20.4% Never married53.9% Now married0.0% Separated0.0% Widowed25.7% DivorcedWomen who did not give birth in the past 12 months Now married:
40.5% (102)Unmarried:
59.5% (150)
Ancestries in Middleburg Heights
769 11.0% Polish723 10.4% Italian692 9.9% German380 5.4% Irish358 5.1% Hungarian321 4.6% American204 2.9% Slovak185 2.7% English177 2.5% Slovene106 1.5% European106 1.5% Greek96 1.4% Ukrainian88 1.3% Romanian62 0.9% Croatian51 0.7% Scottish38 0.5% Arab30 0.4% Swiss29 0.4% Austrian26 0.4% French25 0.4% Russian24 0.3% Albanian24 0.3% Slavic21 0.3% Eastern European20 0.3% Czechoslovakian13 0.2% Yugoslavian12 0.2% Lithuanian11 0.2% Lebanese11 0.2% Serbian9 0.1% Scotch-Irish5 0.07% Canadian4 0.06% Scandinavian3 0.04% Welsh2 0.03% Armenian
Children Nativity (place of birth) in Middleburg Heights
Children under 6 years - Living with two parents Both parents native 499 100.0% NativeBoth parents foreign-born 148 59.5% Native100 40.5% Foreign-bornOne native, one foreign-born parent 66 100.0% NativeChildren under 6 years - Living with one parent Native parent 84 100.0% NativeForeign-born parent 30 100.0% NativeChildren 6 to 17 years - Living with two parents Both parents native 746 100.0% NativeBoth parents foreign-born 66 57.8% Native48 42.2% Foreign-bornOne native, one foreign-born parent 37 100.0% NativeChildren 6 to 17 years - Living with one parent Native parent 464 100.0% NativeForeign-born parent 96 62.3% Native58 37.7% Foreign-born
Grandparents responsible for own grandchildren in Middleburg Heights
Grandparents (30 to 59 years) White / Caucasian 7 14.1% Responsible for grandchildren43 85.9% Not responsible for grandchildrenWhite alone, not Hispanic / Latino 7 14.8% Responsible for grandchildren43 85.2% Not responsible for grandchildrenGrandparents (60 years and over) White / Caucasian 118 63.1% Responsible for grandchildren69 36.9% Not responsible for grandchildrenWhite alone, not Hispanic / Latino 120 70.7% Responsible for grandchildren50 29.3% Not responsible for grandchildren