Races in Middletown, New York (NY) Detailed Stats
Data:
Races - White alone (%)
Races - White alone (% change since 2000)
Races - Black alone (%)
Races - Black alone (% change since 2000)
Races - American Indian alone (%)
Races - American Indian alone (% change since 2000)
Races - Asian alone (%)
Races - Asian alone (% change since 2000)
Races - Hispanic (%)
Races - Hispanic (% change since 2000)
Races - Native Hawaiian and Other Pacific Islander alone (%)
Races - Native Hawaiian and Other Pacific Islander alone (% change since 2000)
Races - Two or more races(%)
Races - Two or more races(% change since 2000)
Races - Other race alone (%)
Races - Other race alone (% change since 2000)
Racial diversity
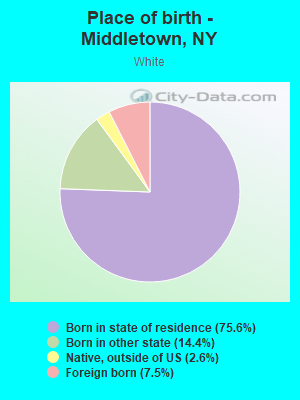
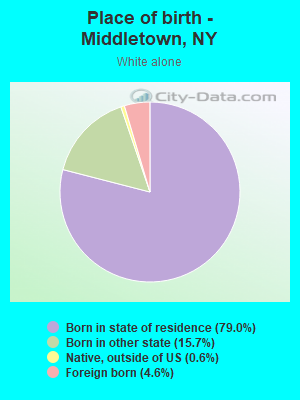
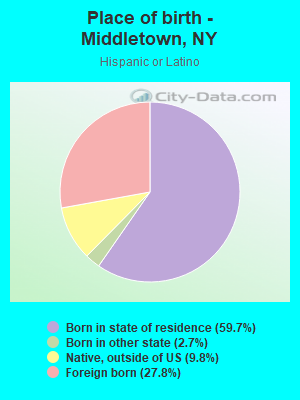
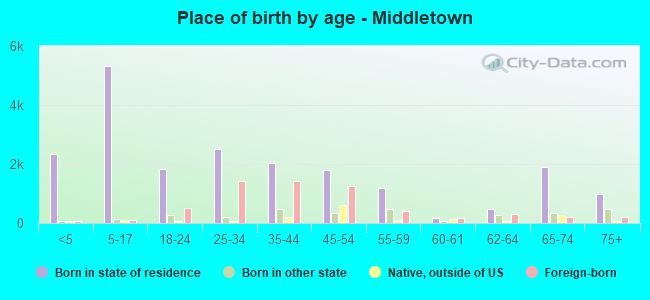
Place of birth - Born in state of residence (%)
Place of birth - Born in state of residence (%) - White
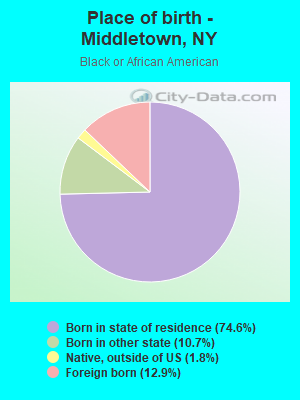
Place of birth - Born in state of residence (%) - Black or African American
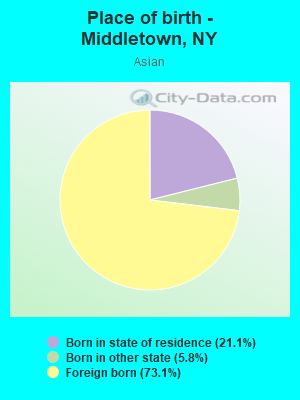
Place of birth - Born in state of residence (%) - Asian
Place of birth - Born in state of residence (%) - Hispanic or Latino
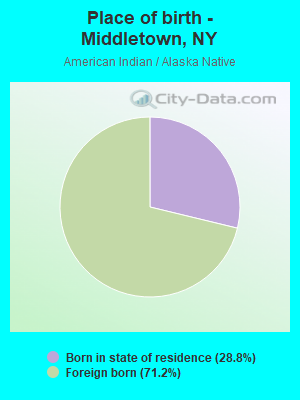
Place of birth - Born in state of residence (%) - American Indian and Alaska Native
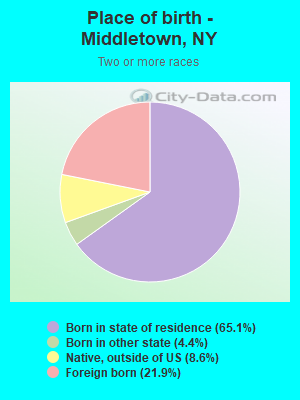
Place of birth - Born in state of residence (%) - Multirace
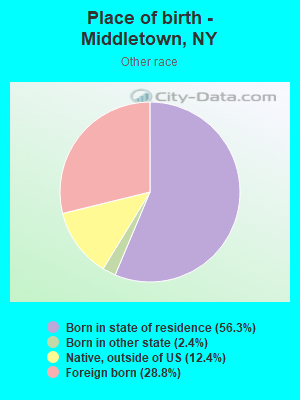
Place of birth - Born in state of residence (%) - Other Race
Place of birth - Born in other state (%)
Place of birth - Born in other state (%) - White
Place of birth - Born in other state (%) - Black or African American
Place of birth - Born in other state (%) - Asian
Place of birth - Born in other state (%) - Hispanic or Latino
Place of birth - Born in other state (%) - American Indian and Alaska Native
Place of birth - Born in other state (%) - Multirace
Place of birth - Born in other state (%) - Other Race
Place of birth - Native, outside of US (%)
Place of birth - Native, outside of US (%) - White
Place of birth - Native, outside of US (%) - Black or African American
Place of birth - Native, outside of US (%) - Asian
Place of birth - Native, outside of US (%) - Hispanic or Latino
Place of birth - Native, outside of US (%) - American Indian and Alaska Native
Place of birth - Native, outside of US (%) - Multirace
Place of birth - Native, outside of US (%) - Other Race
Place of birth - Foreign born (%)
Place of birth - Foreign born (%) - White
Place of birth - Foreign born (%) - Black or African American
Place of birth - Foreign born (%) - Asian
Place of birth - Foreign born (%) - Hispanic or Latino
Place of birth - Foreign born (%) - American Indian and Alaska Native
Place of birth - Foreign born (%) - Multirace
Place of birth - Foreign born (%) - Other Race
Residents speaking English at home (%)
Residents speaking English at home - Born in the United States (%)
Residents speaking English at home - Native, born elsewhere (%)
Residents speaking English at home - Foreign born (%)
Residents speaking Spanish at home (%)
Residents speaking Spanish at home - Born in the United States (%)
Residents speaking Spanish at home - Native, born elsewhere (%)
Residents speaking Spanish at home - Foreign born (%)
Residents speaking other language at home (%)
Residents speaking other language at home - Born in the United States (%)
Residents speaking other language at home - Native, born elsewhere (%)
Residents speaking other language at home - Foreign born (%)
Marital status - Never married (%)
Marital status - Now married (%)
Marital status - Separated (%)
Marital status - Widowed (%)
Marital status - Divorced (%)
Ancestries Reported - Arab (%)
Ancestries Reported - Czech (%)
Ancestries Reported - Danish (%)
Ancestries Reported - Dutch (%)
Ancestries Reported - English (%)
Ancestries Reported - French (%)
Ancestries Reported - French Canadian (%)
Ancestries Reported - German (%)
Ancestries Reported - Greek (%)
Ancestries Reported - Hungarian (%)
Ancestries Reported - Irish (%)
Ancestries Reported - Italian (%)
Ancestries Reported - Lithuanian (%)
Ancestries Reported - Norwegian (%)
Ancestries Reported - Polish (%)
Ancestries Reported - Portuguese (%)
Ancestries Reported - Russian (%)
Ancestries Reported - Scotch-Irish (%)
Ancestries Reported - Scottish (%)
Ancestries Reported - Slovak (%)
Ancestries Reported - Subsaharan African (%)
Ancestries Reported - Swedish (%)
Ancestries Reported - Swiss (%)
Ancestries Reported - Ukrainian (%)
Ancestries Reported - United States (%)
Ancestries Reported - Welsh (%)
Ancestries Reported - West Indian (%)
Ancestries Reported - Other (%)
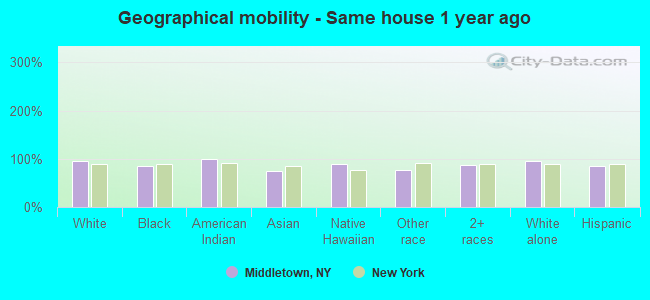
Geographical mobility - Same house 1 year ago (%)
Geographical mobility - Same house 1 year ago (%) - White
Geographical mobility - Same house 1 year ago (%) - Black or African American
Geographical mobility - Same house 1 year ago (%) - Asian
Geographical mobility - Same house 1 year ago (%) - Hispanic or Latino
Geographical mobility - Same house 1 year ago (%) - American Indian and Alaska Native
Geographical mobility - Same house 1 year ago (%) - Multirace
Geographical mobility - Same house 1 year ago (%) - Other Race
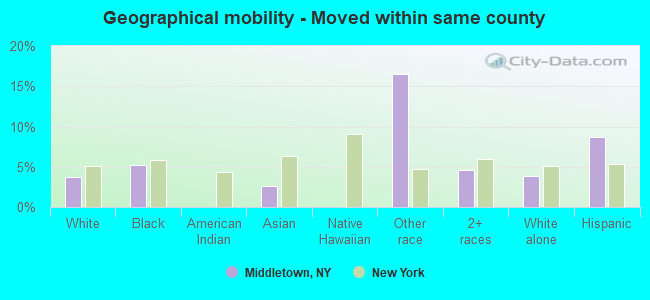
Geographical mobility - Moved within same county (%)
Geographical mobility - Moved within same county (%) - White
Geographical mobility - Moved within same county (%) - Black or African American
Geographical mobility - Moved within same county (%) - Asian
Geographical mobility - Moved within same county (%) - Hispanic or Latino
Geographical mobility - Moved within same county (%) - American Indian and Alaska Native
Geographical mobility - Moved within same county (%) - Multirace
Geographical mobility - Moved within same county (%) - Other Race
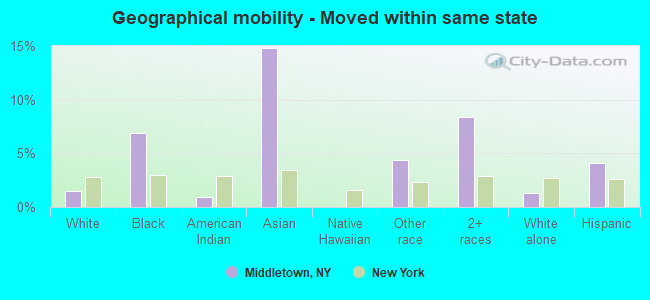
Geographical mobility - Moved from different county within same state (%)
Geographical mobility - Moved from different county within same state (%) - White
Geographical mobility - Moved from different county within same state (%) - Black or African American
Geographical mobility - Moved from different county within same state (%) - Asian
Geographical mobility - Moved from different county within same state (%) - Hispanic or Latino
Geographical mobility - Moved from different county within same state (%) - American Indian and Alaska Native
Geographical mobility - Moved from different county within same state (%) - Multirace
Geographical mobility - Moved from different county within same state (%) - Other Race
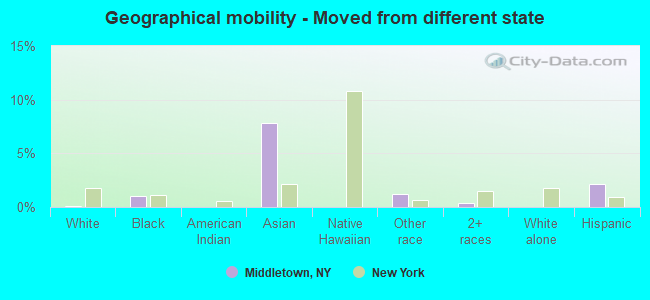
Geographical mobility - Moved from different state (%)
Geographical mobility - Moved from different state (%) - White
Geographical mobility - Moved from different state (%) - Black or African American
Geographical mobility - Moved from different state (%) - Asian
Geographical mobility - Moved from different state (%) - Hispanic or Latino
Geographical mobility - Moved from different state (%) - American Indian and Alaska Native
Geographical mobility - Moved from different state (%) - Multirace
Geographical mobility - Moved from different state (%) - Other Race
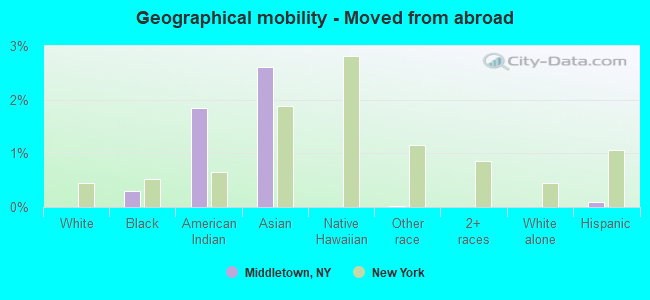
Geographical mobility - Moved from abroad (%)
Geographical mobility - Moved from abroad (%) - White
Geographical mobility - Moved from abroad (%) - Black or African American
Geographical mobility - Moved from abroad (%) - Asian
Geographical mobility - Moved from abroad (%) - Hispanic or Latino
Geographical mobility - Moved from abroad (%) - American Indian and Alaska Native
Geographical mobility - Moved from abroad (%) - Multirace
Geographical mobility - Moved from abroad (%) - Other Race
Place of birth for the foreign-born population - Ireland (%)
Place of birth for the foreign-born population - Denmark (%)
Place of birth for the foreign-born population - Norway (%)
Place of birth for the foreign-born population - Sweden (%)
Place of birth for the foreign-born population - United Kingdom (%)
Place of birth for the foreign-born population - England (%)
Place of birth for the foreign-born population - Scotland (%)
Place of birth for the foreign-born population - Other Northern Europe (%)
Place of birth for the foreign-born population - Austria (%)
Place of birth for the foreign-born population - Belgium (%)
Place of birth for the foreign-born population - France (%)
Place of birth for the foreign-born population - Germany (%)
Place of birth for the foreign-born population - Netherlands (%)
Place of birth for the foreign-born population - Switzerland (%)
Place of birth for the foreign-born population - Other Western Europe (%)
Place of birth for the foreign-born population - Greece (%)
Place of birth for the foreign-born population - Italy (%)
Place of birth for the foreign-born population - Portugal (%)
Place of birth for the foreign-born population - Spain (%)
Place of birth for the foreign-born population - Other Southern Europe (%)
Place of birth for the foreign-born population - Albania (%)
Place of birth for the foreign-born population - Belarus (%)
Place of birth for the foreign-born population - Bosnia and Herzegovina (%)
Place of birth for the foreign-born population - Bulgaria (%)
Place of birth for the foreign-born population - Croatia (%)
Place of birth for the foreign-born population - Czechoslovakia (%)
Place of birth for the foreign-born population - Hungary (%)
Place of birth for the foreign-born population - Latvia (%)
Place of birth for the foreign-born population - Lithuania (%)
Place of birth for the foreign-born population - North Macedonia (Macedonia) (%)
Place of birth for the foreign-born population - Moldova (%)
Place of birth for the foreign-born population - Poland (%)
Place of birth for the foreign-born population - Romania (%)
Place of birth for the foreign-born population - Russia (%)
Place of birth for the foreign-born population - Serbia (%)
Place of birth for the foreign-born population - Ukraine (%)
Place of birth for the foreign-born population - Other Eastern Europe (%)
Place of birth for the foreign-born population - China (%)
Place of birth for the foreign-born population - Hong Kong (%)
Place of birth for the foreign-born population - Taiwan (%)
Place of birth for the foreign-born population - Japan (%)
Place of birth for the foreign-born population - Korea (%)
Place of birth for the foreign-born population - Other Eastern Asia (%)
Place of birth for the foreign-born population - Afghanistan (%)
Place of birth for the foreign-born population - Bangladesh (%)
Place of birth for the foreign-born population - India (%)
Place of birth for the foreign-born population - Iran (%)
Place of birth for the foreign-born population - Kazakhstan (%)
Place of birth for the foreign-born population - Nepal (%)
Place of birth for the foreign-born population - Pakistan (%)
Place of birth for the foreign-born population - Sri Lanka (%)
Place of birth for the foreign-born population - Uzbekistan (%)
Place of birth for the foreign-born population - Other South Central Asia (%)
Place of birth for the foreign-born population - Burma (%)
Place of birth for the foreign-born population - Cambodia (%)
Place of birth for the foreign-born population - Indonesia (%)
Place of birth for the foreign-born population - Laos (%)
Place of birth for the foreign-born population - Malaysia (%)
Place of birth for the foreign-born population - Philippines (%)
Place of birth for the foreign-born population - Singapore (%)
Place of birth for the foreign-born population - Thailand (%)
Place of birth for the foreign-born population - Vietnam (%)
Place of birth for the foreign-born population - Other South Eastern Asia (%)
Place of birth for the foreign-born population - Armenia (%)
Place of birth for the foreign-born population - Iraq (%)
Place of birth for the foreign-born population - Israel (%)
Place of birth for the foreign-born population - Jordan (%)
Place of birth for the foreign-born population - Kuwait (%)
Place of birth for the foreign-born population - Lebanon (%)
Place of birth for the foreign-born population - Saudi Arabia (%)
Place of birth for the foreign-born population - Syria (%)
Place of birth for the foreign-born population - Turkey (%)
Place of birth for the foreign-born population - Yemen (%)
Place of birth for the foreign-born population - Other Western Asia (%)
Place of birth for the foreign-born population - Eritrea (%)
Place of birth for the foreign-born population - Ethiopia (%)
Place of birth for the foreign-born population - Kenya (%)
Place of birth for the foreign-born population - Somalia (%)
Place of birth for the foreign-born population - Uganda (%)
Place of birth for the foreign-born population - Zimbabwe (%)
Place of birth for the foreign-born population - Other Eastern Africa (%)
Place of birth for the foreign-born population - Cameroon (%)
Place of birth for the foreign-born population - Congo (%)
Place of birth for the foreign-born population - Democratic Republic of Congo (Zaire) (%)
Place of birth for the foreign-born population - Other Middle Africa (%)
Place of birth for the foreign-born population - Egypt (%)
Place of birth for the foreign-born population - Morocco (%)
Place of birth for the foreign-born population - Sudan (%)
Place of birth for the foreign-born population - Other Northern Africa (%)
Place of birth for the foreign-born population - South Africa (%)
Place of birth for the foreign-born population - Other Southern Africa (%)
Place of birth for the foreign-born population - Cabo Verde (%)
Place of birth for the foreign-born population - Ghana (%)
Place of birth for the foreign-born population - Liberia (%)
Place of birth for the foreign-born population - Nigeria (%)
Place of birth for the foreign-born population - Senegal (%)
Place of birth for the foreign-born population - Sierra Leone (%)
Place of birth for the foreign-born population - Other Western Africa (%)
Place of birth for the foreign-born population - Australia (%)
Place of birth for the foreign-born population - New Zealand (%)
Place of birth for the foreign-born population - Fiji (%)
Place of birth for the foreign-born population - Micronesia (%)
Place of birth for the foreign-born population - Bahamas (%)
Place of birth for the foreign-born population - Barbados (%)
Place of birth for the foreign-born population - Cuba (%)
Place of birth for the foreign-born population - Dominica (%)
Place of birth for the foreign-born population - Dominican Republic (%)
Place of birth for the foreign-born population - Grenada (%)
Place of birth for the foreign-born population - Haiti (%)
Place of birth for the foreign-born population - Jamaica (%)
Place of birth for the foreign-born population - St. Vincent and the Grenadines (%)
Place of birth for the foreign-born population - Trinidad and Tobago (%)
Place of birth for the foreign-born population - West Indies (%)
Place of birth for the foreign-born population - Other Caribbean (%)
Place of birth for the foreign-born population - Belize (%)
Place of birth for the foreign-born population - Costa Rica (%)
Place of birth for the foreign-born population - El Salvador (%)
Place of birth for the foreign-born population - Guatemala (%)
Place of birth for the foreign-born population - Honduras (%)
Place of birth for the foreign-born population - Mexico (%)
Place of birth for the foreign-born population - Nicaragua (%)
Place of birth for the foreign-born population - Panama (%)
Place of birth for the foreign-born population - Other Central America (%)
Place of birth for the foreign-born population - Argentina (%)
Place of birth for the foreign-born population - Bolivia (%)
Place of birth for the foreign-born population - Brazil (%)
Place of birth for the foreign-born population - Chile (%)
Place of birth for the foreign-born population - Colombia (%)
Place of birth for the foreign-born population - Ecuador (%)
Place of birth for the foreign-born population - Guyana (%)
Place of birth for the foreign-born population - Peru (%)
Place of birth for the foreign-born population - Uruguay (%)
Place of birth for the foreign-born population - Venezuela (%)
Place of birth for the foreign-born population - Other South America (%)
Place of birth for the foreign-born population - Canada (%)
Place of birth for the foreign-born population - Other Northern America (%)
Place of birth for the foreign-born population - Other (%)
Latest news about races in Middletown, NY collected exclusively by city-data.com from local newspapers, TV, and radio stations
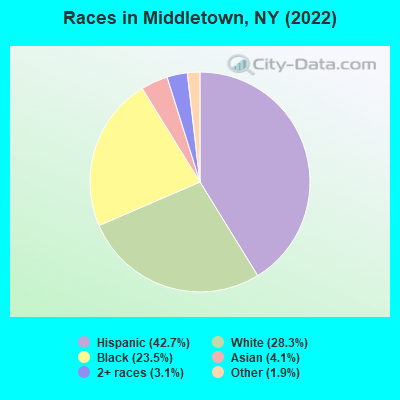
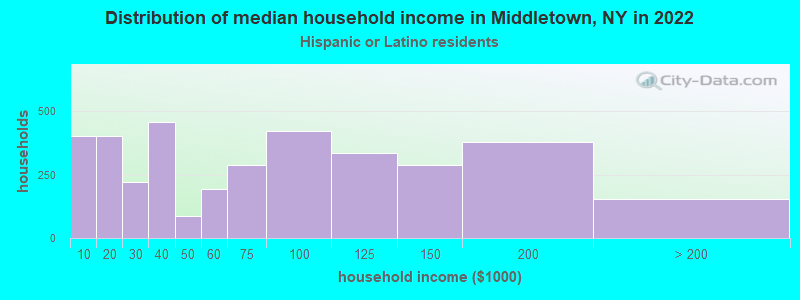
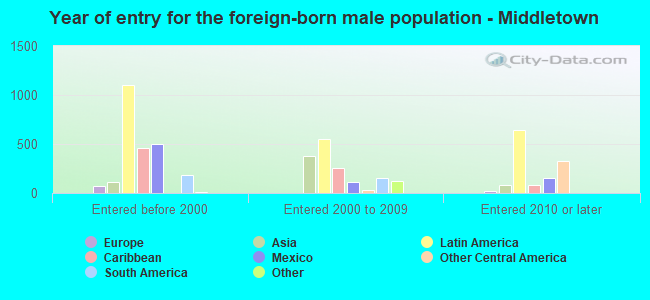
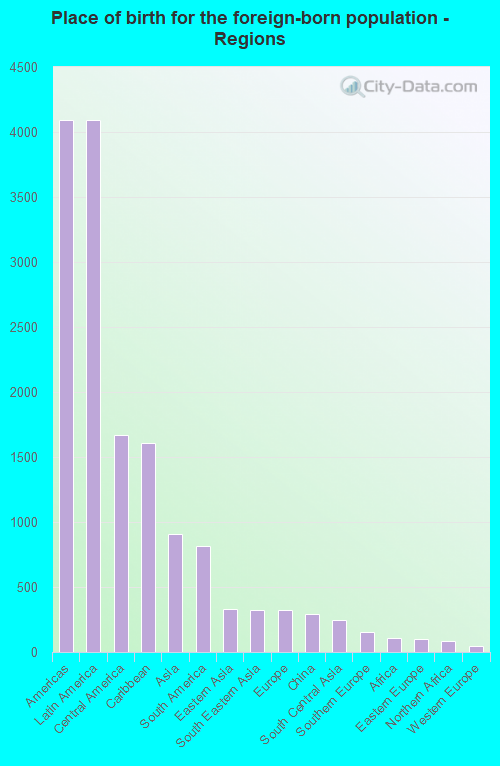
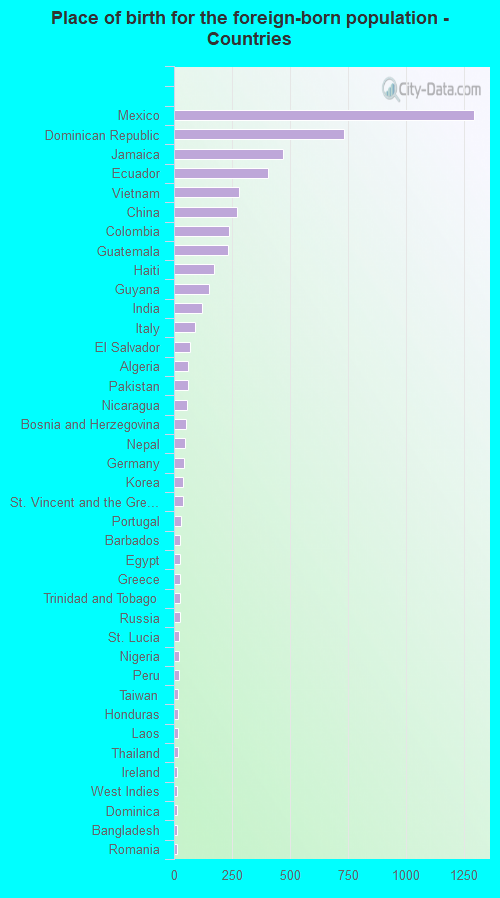
According to 2022 data, the most numerous races in Middletown, NY are White alone (8,643 residents), Hispanic (13,044 residents), and Black alone (7,162 residents). 61.5% of Middletown residents speak English at home. 17.8% of Middletown, NY residents are foreign-born (13.7% born in Latin America, 3.0% born in Asia), which is 23.6% less than the foreign-born rate of 22.0% across the entire state of New York.
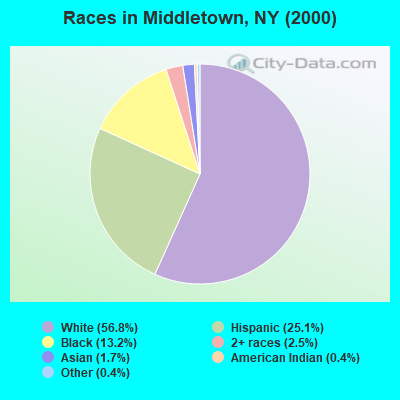
Race distribution in Middletown
2000 2022
11,760,981 62.0% White alone 2,867,583 15.1% Hispanic 2,812,623 14.8% Black alone 1,035,926 5.5% Asian alone 366,116 1.9% Two or more races 75,499 0.4% Other race alone 52,499 0.3% American Indian alone 5,230 0.03% Native Hawaiian and Other
10,408,933 52.9% White alone 3,867,299 19.7% Hispanic 2,633,840 13.4% Black alone 1,776,286 9.0% Asian alone 732,670 3.7% Two or more races 216,110 1.1% Other race alone 35,082 0.2% American Indian alone 6,931 0.04% Native Hawaiian and Other
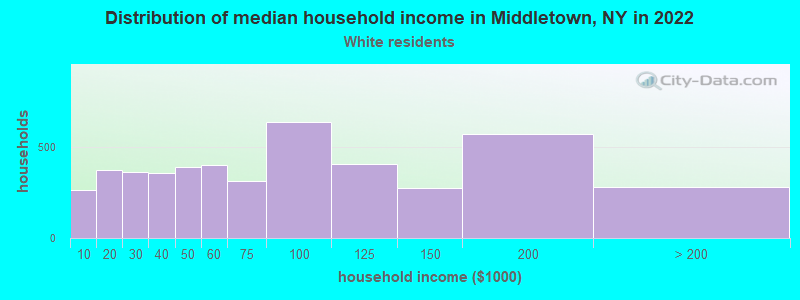
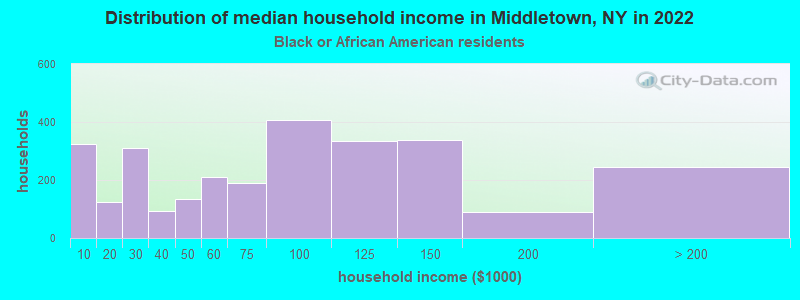
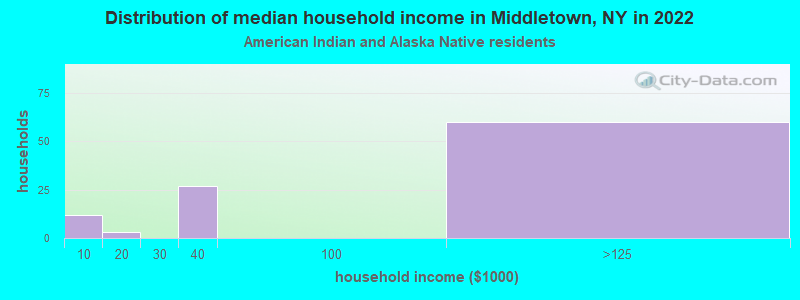
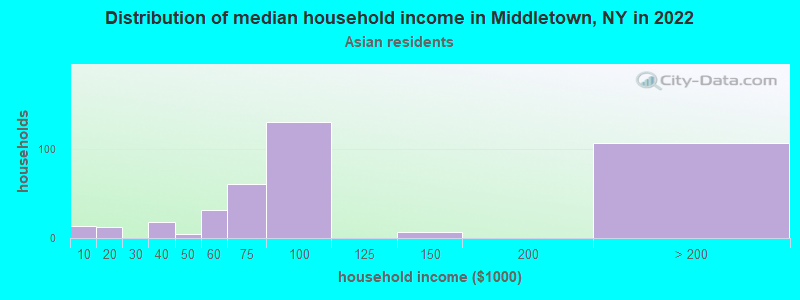
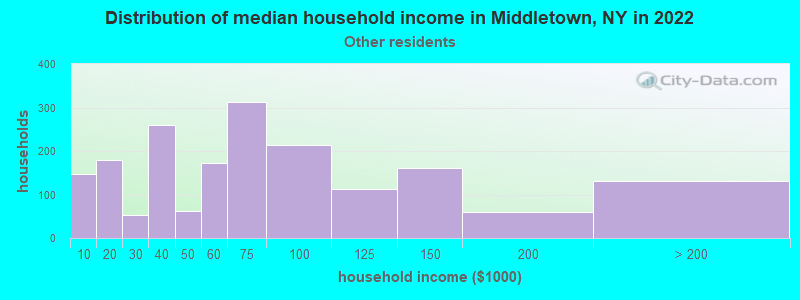
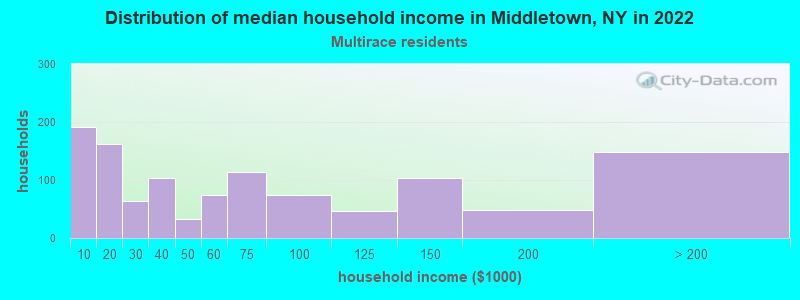
Income and house value in Middletown Median household income in 2022 $59,624 White non-Hispanic householders$76,302 Black householders$83,613 Asian householders$68,886 Some other race householders$64,590 Two or more races householders$71,911 Hispanic or Latino race householdersMedian 2022 house value $262,119 White Non-Hispanic householders$271,210 Black or African American householders$284,088 American Indian or Alaska Native householders $398,481 Asian householders$239,897 Some other race householders$284,088 Two or more races householders$258,078 Hispanic or Latino householders
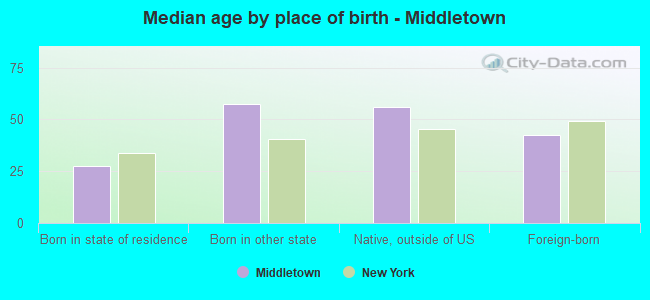
Median age by race in Middletown
50.8 Median age for White residents49.0 52.4 33.1 Median age for Black or African American residents33.5 32.4 38.6 Median age for American Indian / Alaska Native residents39.5 27.3 38.9 Median age for Asian residents38.8 37.6 -487,992,314.6 Median age for Native Hawaiian / Pacific Islander residents-477,502,295.2 -497,387,669.3 28.9 Median age for Other race residents28.7 29.2 28.6 Median age for Two or more races residents24.2 30.4 54.0 Median age for White alone residents50.4 55.9 30.0 Median age for Hispanic or Latino residents31.4 28.0
Owner/renter occupied households by race in Middletown
House owners and renters - White residents 2,590 55.2% Owner occupied2,106 44.8% Renter occupiedHouse owners and renters - Black or African American residents 1,341 51.6% Owner occupied1,255 48.4% Renter occupiedHouse owners and renters - American Indian / Alaska Native residents 28 32.3% Owner occupied59 67.7% Renter occupiedHouse owners and renters - Asian residents 226 57.0% Owner occupied170 43.0% Renter occupiedHouse owners and renters - Native Hawaiian / Pacific Islander residents 47 100.0% Owner occupiedHouse owners and renters - Other race residents 914 47.7% Owner occupied1,003 52.3% Renter occupiedHouse owners and renters - Two or more races residents 790 64.6% Owner occupied433 35.4% Renter occupiedHouse owners and renters - White alone residents 2,277 55.4% Owner occupied1,837 44.6% Renter occupiedHouse owners and renters - Hispanic or Latino residents 1,901 54.7% Owner occupied1,577 45.3% Renter occupied
Language usage in Middletown
English speakers - Total 61.5% of residents of Middletown speak English at home.
31.7% of residents speak Spanish at home 4,718 52.9% Speak English very well4,194 47.1% Speak English less than very well8.0% of residents speak other language at home 1,399 62.5% Speak English very well838 37.5% Speak English less than very well
English speakers - Born in the United States 87.5% of residents of Middletown speak English at home.
13.4% of residents speak Spanish at home 202 52.9% Speak English very well180 47.1% Speak English less than very well0.9% of residents speak other language at home 13 52.0% Speak English very well12 48.0% Speak English less than very well
English speakers - Native, born elsewhere 24.9% of residents of Middletown speak English at home.
71.7% of residents speak Spanish at home 532 47.8% Speak English very well581 52.2% Speak English less than very well1.7% of residents speak other language at home 19 73.1% Speak English very well7 26.9% Speak English less than very well
English speakers - Foreign-born 17.2% of residents of Middletown speak English at home.
61.9% of residents speak Spanish at home 1,052 28.6% Speak English very well2,632 71.4% Speak English less than very well24.5% of residents speak other language at home 781 53.5% Speak English very well678 46.5% Speak English less than very well
White (Caucasian) - Speak only English Native:
85.7% (7,702)Foreign-born:
16.4% (128)
White (Caucasian) - Speak another language Native:
12.9% (1,163)Foreign-born:
74.4% (581)
Black or African American - Speak only English Native:
84.9% (5,683)Foreign-born:
55.3% (607)
Black or African American - Speak another language Native:
17.2% (1,149)Foreign-born:
33.0% (362)
American Indian / Alaska Native - Speak another language Native:
100.0% (124)Foreign-born:
100.0% (308)
Asian - Speak only English Native:
84.0% (92)Foreign-born:
3.3% (30)
Asian - Speak another language Native:
19.8% (22)Foreign-born:
96.2% (885)
Other race - Speak only English Native:
43.0% (2,104)Foreign-born:
3.9% (89)
Other race - Speak another language Native:
56.4% (2,762)Foreign-born:
94.6% (2,146)
Two or more races - Speak only English Native:
54.0% (1,730)Foreign-born:
8.4% (86)
Two or more races - Speak another language Native:
49.2% (1,575)Foreign-born:
92.0% (934)
White alone - Speak only English Native:
90.9% (7,112)Foreign-born:
23.7% (94)
White alone - Speak another language Native:
4.7% (370)Foreign-born:
72.3% (287)
Hispanic or Latino - Speak only English Native:
40.6% (3,277)Foreign-born:
2.1% (75)
Hispanic or Latino - Speak another language Native:
59.7% (4,823)Foreign-born:
98.7% (3,596)
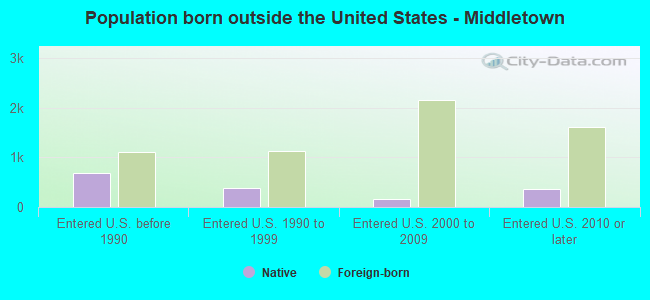
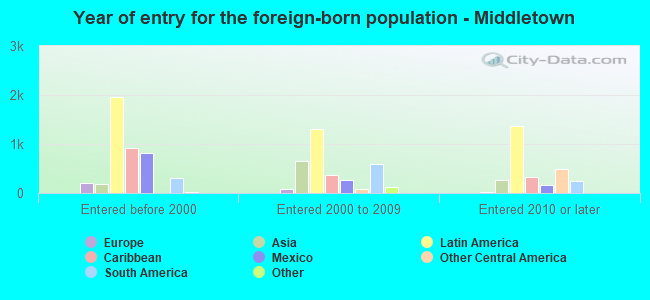
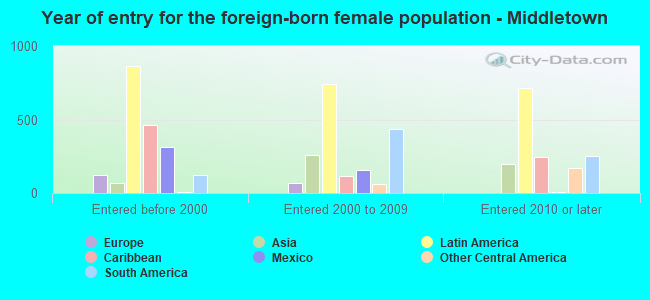
Foreign-born residents in Middletown 5,432 residents are foreign born (13.7% Latin America , 3.0% Asia ).
This city:
17.8%New York:
22.6%
Marital status for residents in Middletown Marital status - White (Caucasian) population 15 years and over
Males 37.4% Never married48.9% Now married3.4% Separated2.7% Widowed7.6% DivorcedFemales 29.0% Never married46.2% Now married1.3% Separated9.5% Widowed14.0% DivorcedWomen who gave birth in the past 12 months Now married:
81.9% (52)Unmarried:
18.1% (11)
Women who did not give birth in the past 12 months Now married:
40.9% (780)Unmarried:
59.1% (1,126)
Marital status - Black or African American population 15 years and over
Males 47.5% Never married45.1% Now married1.1% Separated2.4% Widowed3.9% DivorcedFemales 45.2% Never married41.0% Now married2.9% Separated3.5% Widowed7.5% DivorcedWomen who gave birth in the past 12 months Now married:
27.8% (26)Unmarried:
72.2% (69)
Women who did not give birth in the past 12 months Now married:
41.3% (775)Unmarried:
58.7% (1,102)
Marital status - American Indian / Alaska Native population 15 years and over
Males 51.2% Never married25.6% Now married0.0% Separated0.0% Widowed23.2% DivorcedFemales 31.6% Never married35.1% Now married0.0% Separated0.0% Widowed33.3% DivorcedWomen who did not give birth in the past 12 months Now married:
35.1% (29)Unmarried:
64.9% (53)
Marital status - Asian population 15 years and over
Males 6.9% Never married76.9% Now married0.0% Separated3.4% Widowed12.8% DivorcedFemales 22.7% Never married69.3% Now married0.0% Separated7.9% Widowed0.0% DivorcedWomen who gave birth in the past 12 months Now married:
100.0% (30)Unmarried:
0.0% (0)
Women who did not give birth in the past 12 months Now married:
69.2% (309)Unmarried:
30.8% (137)
Marital status - Other race population 15 years and over
Males 48.7% Never married44.8% Now married2.4% Separated0.1% Widowed4.0% DivorcedFemales 29.3% Never married49.9% Now married4.2% Separated0.8% Widowed15.8% DivorcedWomen who gave birth in the past 12 months Now married:
30.1% (55)Unmarried:
69.9% (127)
Women who did not give birth in the past 12 months Now married:
56.9% (803)Unmarried:
43.1% (610)
Marital status - Two or more races population 15 years and over
Males 52.3% Never married44.4% Now married0.4% Separated1.6% Widowed1.3% DivorcedFemales 37.9% Never married34.7% Now married1.9% Separated6.6% Widowed18.9% DivorcedWomen who gave birth in the past 12 months Now married:
100.0% (33)Unmarried:
0.0% (0)
Women who did not give birth in the past 12 months Now married:
35.8% (378)Unmarried:
64.2% (676)
Marital status - White alone, not Hispanic / Latino population 15 years and over
Males 37.3% Never married46.7% Now married3.2% Separated3.3% Widowed9.4% DivorcedFemales 26.2% Never married46.7% Now married1.0% Separated10.7% Widowed15.4% DivorcedWomen who gave birth in the past 12 months Now married:
100.0% (39)Unmarried:
0.0% (0)
Women who did not give birth in the past 12 months Now married:
39.4% (568)Unmarried:
60.6% (873)
Marital status - Hispanic or Latino population 15 years and over
Males 46.5% Never married46.8% Now married2.3% Separated0.2% Widowed4.3% DivorcedFemales 35.3% Never married44.7% Now married4.5% Separated3.3% Widowed12.2% DivorcedWomen who gave birth in the past 12 months Now married:
43.2% (87)Unmarried:
56.8% (114)
Women who did not give birth in the past 12 months Now married:
46.3% (1,249)Unmarried:
53.7% (1,452)
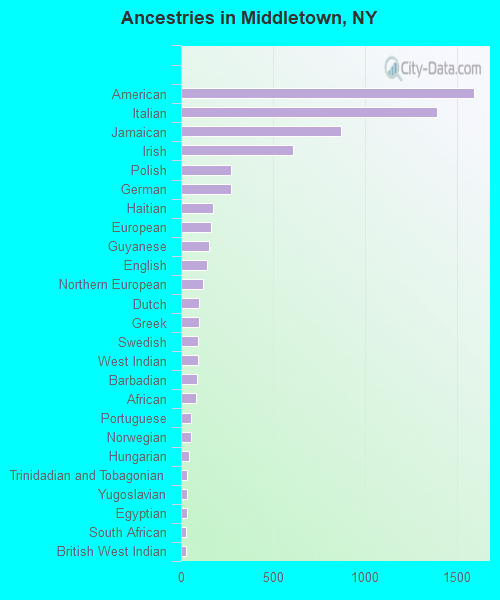
Ancestries in Middletown
1,596 9.5% American1,392 8.3% Italian873 5.2% Jamaican611 3.6% Irish273 1.6% Polish272 1.6% German175 1.0% Haitian161 1.0% European154 0.9% Guyanese140 0.8% English119 0.7% Northern European96 0.6% Dutch96 0.6% Greek95 0.6% Swedish91 0.5% West Indian86 0.5% Barbadian81 0.5% African54 0.3% Portuguese53 0.3% Norwegian42 0.2% Hungarian35 0.2% Trinidadian and Tobagonian35 0.2% Yugoslavian34 0.2% Egyptian28 0.2% South African28 0.2% British West Indian24 0.1% Russian21 0.1% Nigerian20 0.1% French17 0.1% Lithuanian15 0.09% Slovak13 0.08% Palestinian12 0.07% German Russian12 0.07% French Canadian9 0.05% Ukrainian7 0.04% Romanian7 0.04% Austrian5 0.03% Scottish5 0.03% British
Geographical mobility in Middletown Same house 1 year ago 9,765 94.6% White (Caucasian)7,258 86.3% Black or African American396 99.6% American Indian / Alaska Native893 74.3% Asian54 89.7% Native Hawaiian / Pacific Islander5,967 77.5% Other race3,943 87.1% Two or more races8,072 94.7% White alone, not Hispanic / Latino10,845 85.1% Hispanic or LatinoMoved within same county 383 3.7% White / Caucasian436 5.2% Black or African American32 2.7% Asian1,272 16.5% Other race209 4.6% Two or more races326 3.8% White alone, not Hispanic / Latino1,106 8.7% Hispanic or LatinoMoved within same state 153 1.5% White / Caucasian583 6.9% Black or African American4 0.9% American Indian / Alaska Native178 14.8% Asian338 4.4% Other race378 8.4% Two or more races113 1.3% White alone, not Hispanic / Latino526 4.1% Hispanic or LatinoMoved from different state 6 0.1% White / Caucasian89 1.1% Black or African American94 7.8% Asian91 1.2% Other race17 0.4% Two or more races275 2.2% Hispanic or LatinoMoved from abroad 25 0.3% Black or African American7 1.9% American Indian / Alaska Native31 2.6% Asian2 0.0% Other race13 0.1% Hispanic or Latino
Children Nativity (place of birth) in Middletown
Children under 6 years - Living with two parents Both parents native 1,047 100.0% NativeBoth parents foreign-born 441 100.0% NativeOne native, one foreign-born parent 132 100.0% NativeChildren under 6 years - Living with one parent Native parent 722 100.0% NativeForeign-born parent 244 100.0% NativeChildren 6 to 17 years - Living with two parents Both parents native 1,671 100.0% NativeBoth parents foreign-born 495 97.2% Native14 2.8% Foreign-bornOne native, one foreign-born parent 247 100.0% NativeChildren 6 to 17 years - Living with one parent Native parent 2,047 100.0% NativeForeign-born parent 554 54.8% Native458 45.2% Foreign-born
Grandparents responsible for own grandchildren in Middletown
Grandparents (30 to 59 years) White / Caucasian 47 100.0% Not responsible for grandchildrenBlack or African American 8 4.1% Responsible for grandchildren177 95.9% Not responsible for grandchildrenAsian 22 100.0% Not responsible for grandchildrenOther race 127 100.0% Not responsible for grandchildrenTwo or more races 140 92.9% Responsible for grandchildren11 7.1% Not responsible for grandchildrenHispanic or Latino 133 30.3% Responsible for grandchildren305 69.7% Not responsible for grandchildrenGrandparents (60 years and over) White / Caucasian 125 61.3% Responsible for grandchildren79 38.7% Not responsible for grandchildrenBlack or African American 10 4.0% Responsible for grandchildren247 96.0% Not responsible for grandchildrenAsian 55 100.0% Not responsible for grandchildrenOther race 70 27.9% Responsible for grandchildren180 72.1% Not responsible for grandchildrenTwo or more races 27 22.1% Responsible for grandchildren96 77.9% Not responsible for grandchildrenHispanic or Latino 26 7.9% Responsible for grandchildren308 92.1% Not responsible for grandchildren