Races in Midland, Michigan (MI) Detailed Stats
Data:
Races - White alone (%)
Races - White alone (% change since 2000)
Races - Black alone (%)
Races - Black alone (% change since 2000)
Races - American Indian alone (%)
Races - American Indian alone (% change since 2000)
Races - Asian alone (%)
Races - Asian alone (% change since 2000)
Races - Hispanic (%)
Races - Hispanic (% change since 2000)
Races - Native Hawaiian and Other Pacific Islander alone (%)
Races - Native Hawaiian and Other Pacific Islander alone (% change since 2000)
Races - Two or more races(%)
Races - Two or more races(% change since 2000)
Races - Other race alone (%)
Races - Other race alone (% change since 2000)
Racial diversity
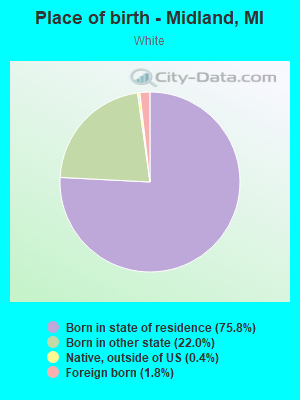
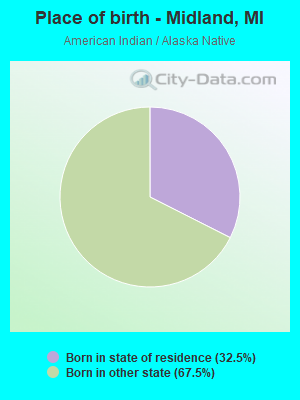
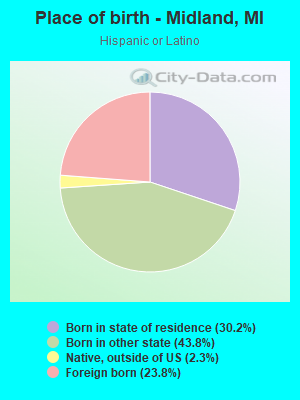
Place of birth - Born in state of residence (%)
Place of birth - Born in state of residence (%) - White
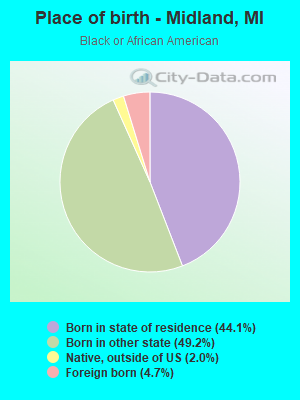
Place of birth - Born in state of residence (%) - Black or African American
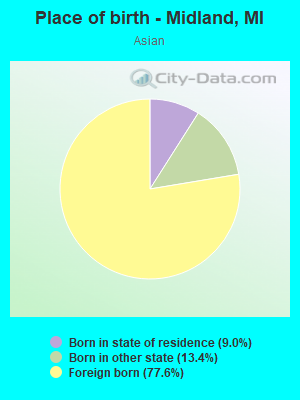
Place of birth - Born in state of residence (%) - Asian
Place of birth - Born in state of residence (%) - Hispanic or Latino
Place of birth - Born in state of residence (%) - American Indian and Alaska Native
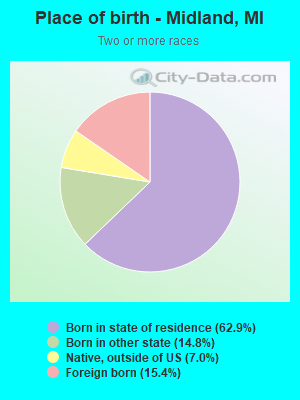
Place of birth - Born in state of residence (%) - Multirace
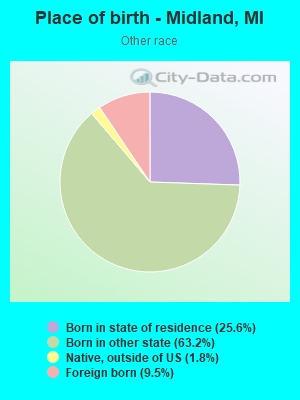
Place of birth - Born in state of residence (%) - Other Race
Place of birth - Born in other state (%)
Place of birth - Born in other state (%) - White
Place of birth - Born in other state (%) - Black or African American
Place of birth - Born in other state (%) - Asian
Place of birth - Born in other state (%) - Hispanic or Latino
Place of birth - Born in other state (%) - American Indian and Alaska Native
Place of birth - Born in other state (%) - Multirace
Place of birth - Born in other state (%) - Other Race
Place of birth - Native, outside of US (%)
Place of birth - Native, outside of US (%) - White
Place of birth - Native, outside of US (%) - Black or African American
Place of birth - Native, outside of US (%) - Asian
Place of birth - Native, outside of US (%) - Hispanic or Latino
Place of birth - Native, outside of US (%) - American Indian and Alaska Native
Place of birth - Native, outside of US (%) - Multirace
Place of birth - Native, outside of US (%) - Other Race
Place of birth - Foreign born (%)
Place of birth - Foreign born (%) - White
Place of birth - Foreign born (%) - Black or African American
Place of birth - Foreign born (%) - Asian
Place of birth - Foreign born (%) - Hispanic or Latino
Place of birth - Foreign born (%) - American Indian and Alaska Native
Place of birth - Foreign born (%) - Multirace
Place of birth - Foreign born (%) - Other Race
Residents speaking English at home (%)
Residents speaking English at home - Born in the United States (%)
Residents speaking English at home - Native, born elsewhere (%)
Residents speaking English at home - Foreign born (%)
Residents speaking Spanish at home (%)
Residents speaking Spanish at home - Born in the United States (%)
Residents speaking Spanish at home - Native, born elsewhere (%)
Residents speaking Spanish at home - Foreign born (%)
Residents speaking other language at home (%)
Residents speaking other language at home - Born in the United States (%)
Residents speaking other language at home - Native, born elsewhere (%)
Residents speaking other language at home - Foreign born (%)
Marital status - Never married (%)
Marital status - Now married (%)
Marital status - Separated (%)
Marital status - Widowed (%)
Marital status - Divorced (%)
Ancestries Reported - Arab (%)
Ancestries Reported - Czech (%)
Ancestries Reported - Danish (%)
Ancestries Reported - Dutch (%)
Ancestries Reported - English (%)
Ancestries Reported - French (%)
Ancestries Reported - French Canadian (%)
Ancestries Reported - German (%)
Ancestries Reported - Greek (%)
Ancestries Reported - Hungarian (%)
Ancestries Reported - Irish (%)
Ancestries Reported - Italian (%)
Ancestries Reported - Lithuanian (%)
Ancestries Reported - Norwegian (%)
Ancestries Reported - Polish (%)
Ancestries Reported - Portuguese (%)
Ancestries Reported - Russian (%)
Ancestries Reported - Scotch-Irish (%)
Ancestries Reported - Scottish (%)
Ancestries Reported - Slovak (%)
Ancestries Reported - Subsaharan African (%)
Ancestries Reported - Swedish (%)
Ancestries Reported - Swiss (%)
Ancestries Reported - Ukrainian (%)
Ancestries Reported - United States (%)
Ancestries Reported - Welsh (%)
Ancestries Reported - West Indian (%)
Ancestries Reported - Other (%)
Geographical mobility - Same house 1 year ago (%)
Geographical mobility - Same house 1 year ago (%) - White
Geographical mobility - Same house 1 year ago (%) - Black or African American
Geographical mobility - Same house 1 year ago (%) - Asian
Geographical mobility - Same house 1 year ago (%) - Hispanic or Latino
Geographical mobility - Same house 1 year ago (%) - American Indian and Alaska Native
Geographical mobility - Same house 1 year ago (%) - Multirace
Geographical mobility - Same house 1 year ago (%) - Other Race
Geographical mobility - Moved within same county (%)
Geographical mobility - Moved within same county (%) - White
Geographical mobility - Moved within same county (%) - Black or African American
Geographical mobility - Moved within same county (%) - Asian
Geographical mobility - Moved within same county (%) - Hispanic or Latino
Geographical mobility - Moved within same county (%) - American Indian and Alaska Native
Geographical mobility - Moved within same county (%) - Multirace
Geographical mobility - Moved within same county (%) - Other Race
Geographical mobility - Moved from different county within same state (%)
Geographical mobility - Moved from different county within same state (%) - White
Geographical mobility - Moved from different county within same state (%) - Black or African American
Geographical mobility - Moved from different county within same state (%) - Asian
Geographical mobility - Moved from different county within same state (%) - Hispanic or Latino
Geographical mobility - Moved from different county within same state (%) - American Indian and Alaska Native
Geographical mobility - Moved from different county within same state (%) - Multirace
Geographical mobility - Moved from different county within same state (%) - Other Race
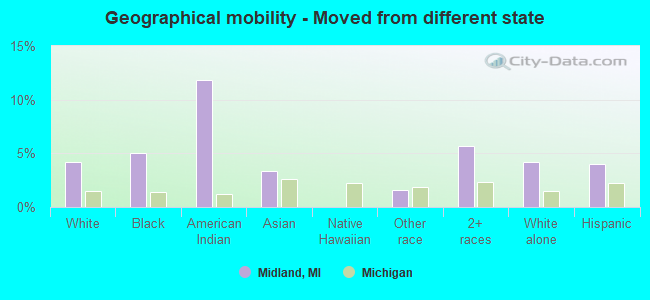
Geographical mobility - Moved from different state (%)
Geographical mobility - Moved from different state (%) - White
Geographical mobility - Moved from different state (%) - Black or African American
Geographical mobility - Moved from different state (%) - Asian
Geographical mobility - Moved from different state (%) - Hispanic or Latino
Geographical mobility - Moved from different state (%) - American Indian and Alaska Native
Geographical mobility - Moved from different state (%) - Multirace
Geographical mobility - Moved from different state (%) - Other Race
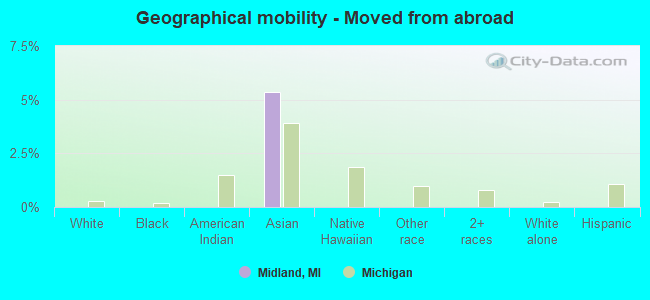
Geographical mobility - Moved from abroad (%)
Geographical mobility - Moved from abroad (%) - White
Geographical mobility - Moved from abroad (%) - Black or African American
Geographical mobility - Moved from abroad (%) - Asian
Geographical mobility - Moved from abroad (%) - Hispanic or Latino
Geographical mobility - Moved from abroad (%) - American Indian and Alaska Native
Geographical mobility - Moved from abroad (%) - Multirace
Geographical mobility - Moved from abroad (%) - Other Race
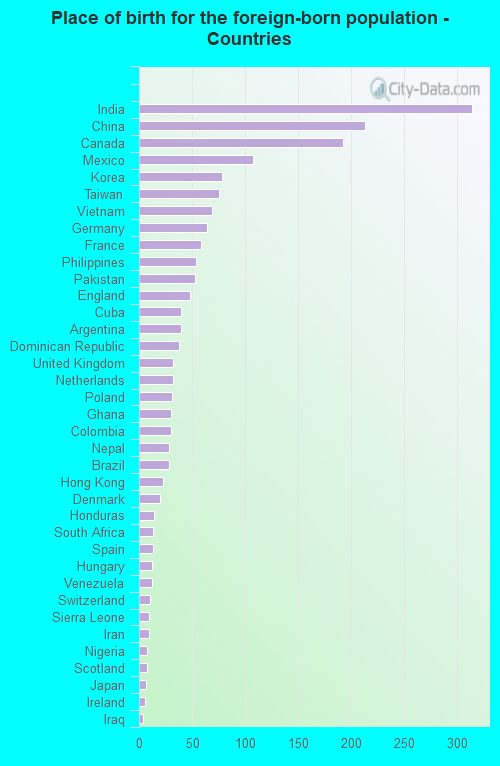
Place of birth for the foreign-born population - Ireland (%)
Place of birth for the foreign-born population - Denmark (%)
Place of birth for the foreign-born population - Norway (%)
Place of birth for the foreign-born population - Sweden (%)
Place of birth for the foreign-born population - United Kingdom (%)
Place of birth for the foreign-born population - England (%)
Place of birth for the foreign-born population - Scotland (%)
Place of birth for the foreign-born population - Other Northern Europe (%)
Place of birth for the foreign-born population - Austria (%)
Place of birth for the foreign-born population - Belgium (%)
Place of birth for the foreign-born population - France (%)
Place of birth for the foreign-born population - Germany (%)
Place of birth for the foreign-born population - Netherlands (%)
Place of birth for the foreign-born population - Switzerland (%)
Place of birth for the foreign-born population - Other Western Europe (%)
Place of birth for the foreign-born population - Greece (%)
Place of birth for the foreign-born population - Italy (%)
Place of birth for the foreign-born population - Portugal (%)
Place of birth for the foreign-born population - Spain (%)
Place of birth for the foreign-born population - Other Southern Europe (%)
Place of birth for the foreign-born population - Albania (%)
Place of birth for the foreign-born population - Belarus (%)
Place of birth for the foreign-born population - Bosnia and Herzegovina (%)
Place of birth for the foreign-born population - Bulgaria (%)
Place of birth for the foreign-born population - Croatia (%)
Place of birth for the foreign-born population - Czechoslovakia (%)
Place of birth for the foreign-born population - Hungary (%)
Place of birth for the foreign-born population - Latvia (%)
Place of birth for the foreign-born population - Lithuania (%)
Place of birth for the foreign-born population - North Macedonia (Macedonia) (%)
Place of birth for the foreign-born population - Moldova (%)
Place of birth for the foreign-born population - Poland (%)
Place of birth for the foreign-born population - Romania (%)
Place of birth for the foreign-born population - Russia (%)
Place of birth for the foreign-born population - Serbia (%)
Place of birth for the foreign-born population - Ukraine (%)
Place of birth for the foreign-born population - Other Eastern Europe (%)
Place of birth for the foreign-born population - China (%)
Place of birth for the foreign-born population - Hong Kong (%)
Place of birth for the foreign-born population - Taiwan (%)
Place of birth for the foreign-born population - Japan (%)
Place of birth for the foreign-born population - Korea (%)
Place of birth for the foreign-born population - Other Eastern Asia (%)
Place of birth for the foreign-born population - Afghanistan (%)
Place of birth for the foreign-born population - Bangladesh (%)
Place of birth for the foreign-born population - India (%)
Place of birth for the foreign-born population - Iran (%)
Place of birth for the foreign-born population - Kazakhstan (%)
Place of birth for the foreign-born population - Nepal (%)
Place of birth for the foreign-born population - Pakistan (%)
Place of birth for the foreign-born population - Sri Lanka (%)
Place of birth for the foreign-born population - Uzbekistan (%)
Place of birth for the foreign-born population - Other South Central Asia (%)
Place of birth for the foreign-born population - Burma (%)
Place of birth for the foreign-born population - Cambodia (%)
Place of birth for the foreign-born population - Indonesia (%)
Place of birth for the foreign-born population - Laos (%)
Place of birth for the foreign-born population - Malaysia (%)
Place of birth for the foreign-born population - Philippines (%)
Place of birth for the foreign-born population - Singapore (%)
Place of birth for the foreign-born population - Thailand (%)
Place of birth for the foreign-born population - Vietnam (%)
Place of birth for the foreign-born population - Other South Eastern Asia (%)
Place of birth for the foreign-born population - Armenia (%)
Place of birth for the foreign-born population - Iraq (%)
Place of birth for the foreign-born population - Israel (%)
Place of birth for the foreign-born population - Jordan (%)
Place of birth for the foreign-born population - Kuwait (%)
Place of birth for the foreign-born population - Lebanon (%)
Place of birth for the foreign-born population - Saudi Arabia (%)
Place of birth for the foreign-born population - Syria (%)
Place of birth for the foreign-born population - Turkey (%)
Place of birth for the foreign-born population - Yemen (%)
Place of birth for the foreign-born population - Other Western Asia (%)
Place of birth for the foreign-born population - Eritrea (%)
Place of birth for the foreign-born population - Ethiopia (%)
Place of birth for the foreign-born population - Kenya (%)
Place of birth for the foreign-born population - Somalia (%)
Place of birth for the foreign-born population - Uganda (%)
Place of birth for the foreign-born population - Zimbabwe (%)
Place of birth for the foreign-born population - Other Eastern Africa (%)
Place of birth for the foreign-born population - Cameroon (%)
Place of birth for the foreign-born population - Congo (%)
Place of birth for the foreign-born population - Democratic Republic of Congo (Zaire) (%)
Place of birth for the foreign-born population - Other Middle Africa (%)
Place of birth for the foreign-born population - Egypt (%)
Place of birth for the foreign-born population - Morocco (%)
Place of birth for the foreign-born population - Sudan (%)
Place of birth for the foreign-born population - Other Northern Africa (%)
Place of birth for the foreign-born population - South Africa (%)
Place of birth for the foreign-born population - Other Southern Africa (%)
Place of birth for the foreign-born population - Cabo Verde (%)
Place of birth for the foreign-born population - Ghana (%)
Place of birth for the foreign-born population - Liberia (%)
Place of birth for the foreign-born population - Nigeria (%)
Place of birth for the foreign-born population - Senegal (%)
Place of birth for the foreign-born population - Sierra Leone (%)
Place of birth for the foreign-born population - Other Western Africa (%)
Place of birth for the foreign-born population - Australia (%)
Place of birth for the foreign-born population - New Zealand (%)
Place of birth for the foreign-born population - Fiji (%)
Place of birth for the foreign-born population - Micronesia (%)
Place of birth for the foreign-born population - Bahamas (%)
Place of birth for the foreign-born population - Barbados (%)
Place of birth for the foreign-born population - Cuba (%)
Place of birth for the foreign-born population - Dominica (%)
Place of birth for the foreign-born population - Dominican Republic (%)
Place of birth for the foreign-born population - Grenada (%)
Place of birth for the foreign-born population - Haiti (%)
Place of birth for the foreign-born population - Jamaica (%)
Place of birth for the foreign-born population - St. Vincent and the Grenadines (%)
Place of birth for the foreign-born population - Trinidad and Tobago (%)
Place of birth for the foreign-born population - West Indies (%)
Place of birth for the foreign-born population - Other Caribbean (%)
Place of birth for the foreign-born population - Belize (%)
Place of birth for the foreign-born population - Costa Rica (%)
Place of birth for the foreign-born population - El Salvador (%)
Place of birth for the foreign-born population - Guatemala (%)
Place of birth for the foreign-born population - Honduras (%)
Place of birth for the foreign-born population - Mexico (%)
Place of birth for the foreign-born population - Nicaragua (%)
Place of birth for the foreign-born population - Panama (%)
Place of birth for the foreign-born population - Other Central America (%)
Place of birth for the foreign-born population - Argentina (%)
Place of birth for the foreign-born population - Bolivia (%)
Place of birth for the foreign-born population - Brazil (%)
Place of birth for the foreign-born population - Chile (%)
Place of birth for the foreign-born population - Colombia (%)
Place of birth for the foreign-born population - Ecuador (%)
Place of birth for the foreign-born population - Guyana (%)
Place of birth for the foreign-born population - Peru (%)
Place of birth for the foreign-born population - Uruguay (%)
Place of birth for the foreign-born population - Venezuela (%)
Place of birth for the foreign-born population - Other South America (%)
Place of birth for the foreign-born population - Canada (%)
Place of birth for the foreign-born population - Other Northern America (%)
Place of birth for the foreign-born population - Other (%)
Latest news about races in Midland, MI collected exclusively by city-data.com from local newspapers, TV, and radio stations
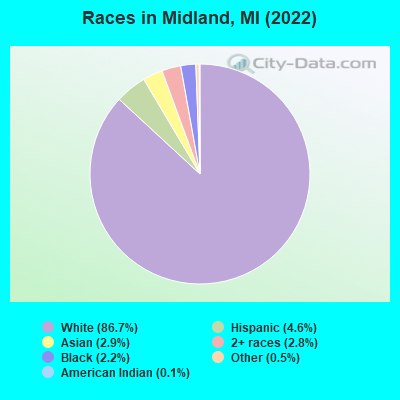
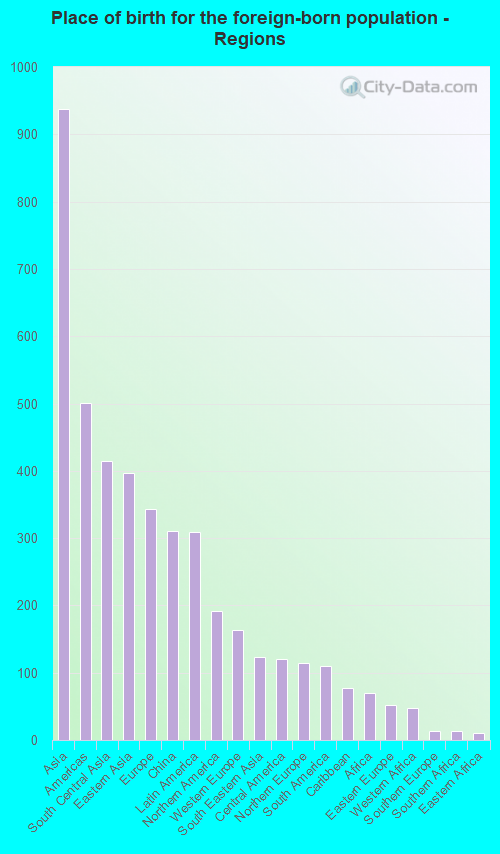
According to 2022 data, the most numerous races in Midland, MI are White alone (36,657 residents), Black alone (928 residents), and Hispanic (1,944 residents). 94.7% of Midland residents speak English at home. 4.4% of Midland, MI residents are foreign-born (2.2% born in Asia, 0.8% born in Europe, 0.7% born in Latin America, 0.5% born in North America), which is 37.7% less than the foreign-born rate of 6.0% across the entire state of Michigan.
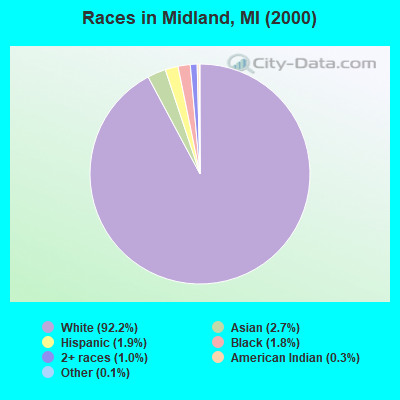
Race distribution in Midland
2000 2022
7,806,691 78.6% White alone 1,402,047 14.1% Black alone 323,877 3.3% Hispanic 175,311 1.8% Asian alone 163,487 1.6% Two or more races 53,421 0.5% American Indian alone 11,465 0.1% Other race alone 2,145 0.02% Native Hawaiian and Other
7,289,051 72.6% White alone 1,310,464 13.1% Black alone 572,405 5.7% Hispanic 450,031 4.5% Two or more races 335,732 3.3% Asian alone 45,217 0.5% Other race alone 29,011 0.3% American Indian alone 2,207 0.02% Native Hawaiian and Other
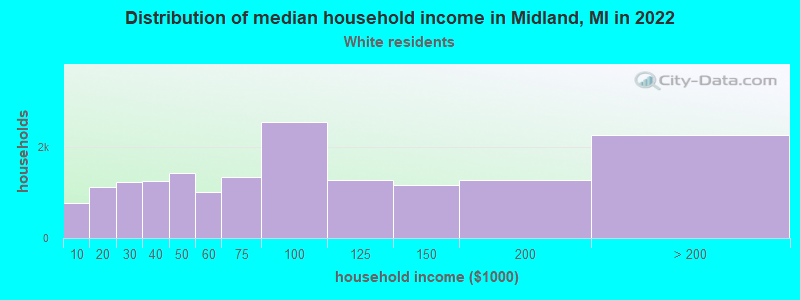
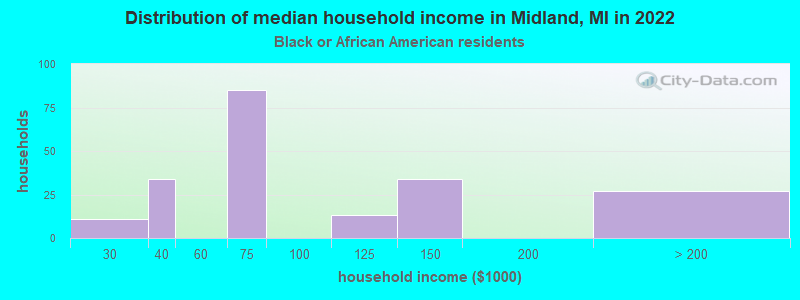
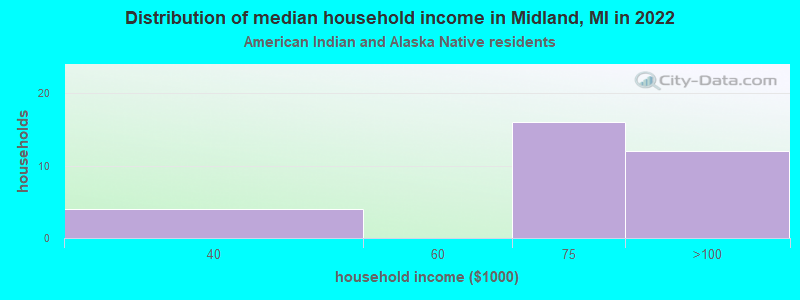
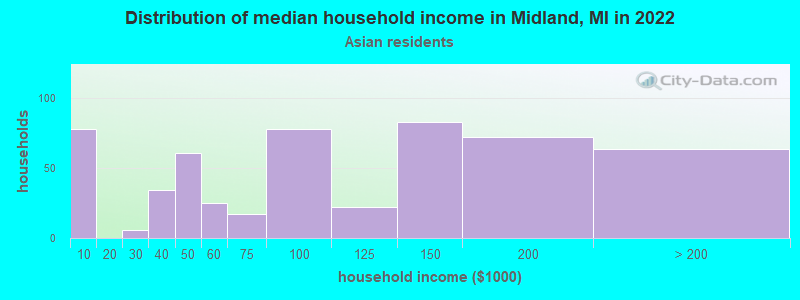
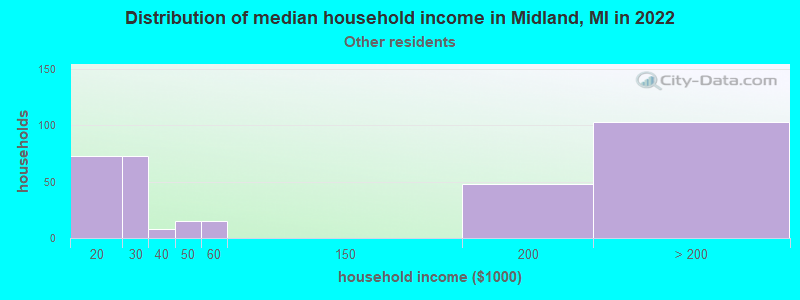
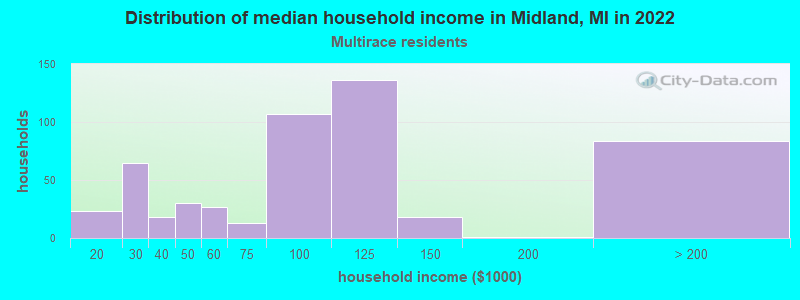
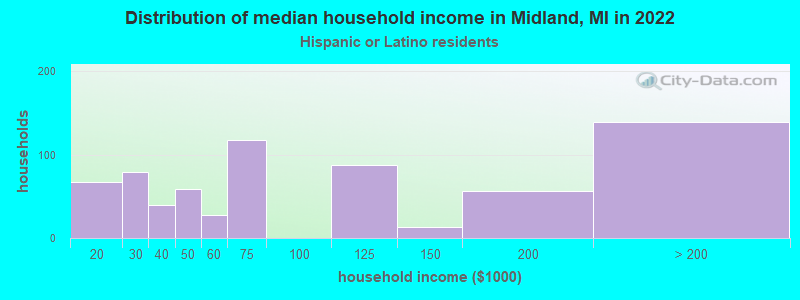
Income and house value in Midland Median household income in 2022 $77,716 White non-Hispanic householders$64,779 Black householders$63,484 American Indian and Alaska Native householders$139,112 Asian householders$40,854 Two or more races householders$65,604 Hispanic or Latino race householdersMedian 2022 house value $197,008 White Non-Hispanic householders$303,131 Black or African American householders$172,142 American Indian or Alaska Native householders $322,043 Asian householders$99,642 Some other race householders$187,552 Two or more races householders$308,034 Hispanic or Latino householders
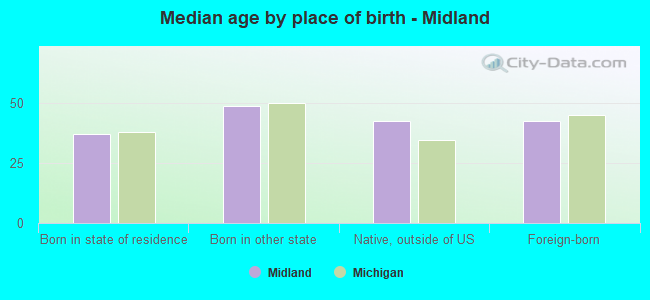
Median age by race in Midland
40.2 Median age for White residents38.3 41.5 20.2 Median age for Black or African American residents36.8 39.9 46.1 Median age for American Indian / Alaska Native residents51.0 54.3 36.6 Median age for Asian residents36.2 38.1 -666,666,666.0 Median age for Native Hawaiian / Pacific Islander residents-666,666,666.0 -666,666,666.0 33.9 Median age for Other race residents34.9 42.7 33.2 Median age for Two or more races residents29.4 24.7 40.3 Median age for White alone residents38.4 41.8 33.4 Median age for Hispanic or Latino residents28.2 41.4
Owner/renter occupied households by race in Midland
House owners and renters - White residents 11,688 71.1% Owner occupied4,758 28.9% Renter occupiedHouse owners and renters - Black or African American residents 86 41.4% Owner occupied121 58.6% Renter occupiedHouse owners and renters - American Indian / Alaska Native residents 30 85.3% Owner occupied5 14.7% Renter occupiedHouse owners and renters - Asian residents 291 56.8% Owner occupied222 43.2% Renter occupiedHouse owners and renters - Other race residents 186 54.8% Owner occupied154 45.2% Renter occupiedHouse owners and renters - Two or more races residents 220 54.3% Owner occupied185 45.7% Renter occupiedHouse owners and renters - White alone residents 11,624 71.1% Owner occupied4,723 28.9% Renter occupiedHouse owners and renters - Hispanic or Latino residents 326 54.7% Owner occupied270 45.3% Renter occupied
Language usage in Midland
English speakers - Total 94.7% of residents of Midland speak English at home.
1.4% of residents speak Spanish at home 406 72.2% Speak English very well156 27.8% Speak English less than very well3.8% of residents speak other language at home 1,161 77.2% Speak English very well343 22.8% Speak English less than very well
English speakers - Born in the United States 97.4% of residents of Midland speak English at home.
0.9% of residents speak Spanish at home 81 100.0% Speak English very well1.5% of residents speak other language at home 134 97.8% Speak English very well3 2.2% Speak English less than very well
English speakers - Native, born elsewhere 97.8% of residents of Midland speak English at home.
4.4% of residents speak Spanish at home 12 100.0% Speak English very well1.8% of residents speak other language at home 5 100.0% Speak English very well
English speakers - Foreign-born 30.3% of residents of Midland speak English at home.
12.9% of residents speak Spanish at home 119 49.6% Speak English very well121 50.4% Speak English less than very well55.0% of residents speak other language at home 765 75.0% Speak English very well255 25.0% Speak English less than very well
White (Caucasian) - Speak only English Native:
98.6% (34,665)Foreign-born:
42.6% (287)
White (Caucasian) - Speak another language Native:
1.4% (506)Foreign-born:
59.4% (400)
Black or African American - Speak only English Native:
97.7% (833)Foreign-born:
77.3% (35)
Black or African American - Speak another language Native:
2.2% (19)Foreign-born:
17.6% (8)
Asian - Speak only English Native:
75.9% (141)Foreign-born:
18.9% (204)
Asian - Speak another language Native:
59.1% (110)Foreign-born:
80.5% (871)
Other race - Speak only English Native:
91.1% (744)Foreign-born:
28.0% (33)
Other race - Speak another language Native:
12.8% (104)Foreign-born:
65.0% (76)
Two or more races - Speak another language Native:
9.1% (114)Foreign-born:
100.0% (167)
White alone - Speak only English Native:
98.7% (34,416)Foreign-born:
44.0% (281)
White alone - Speak another language Native:
1.4% (471)Foreign-born:
57.2% (365)
Hispanic or Latino - Speak only English Native:
82.7% (1,201)Foreign-born:
21.3% (64)
Hispanic or Latino - Speak another language Native:
17.2% (249)Foreign-born:
78.2% (235)
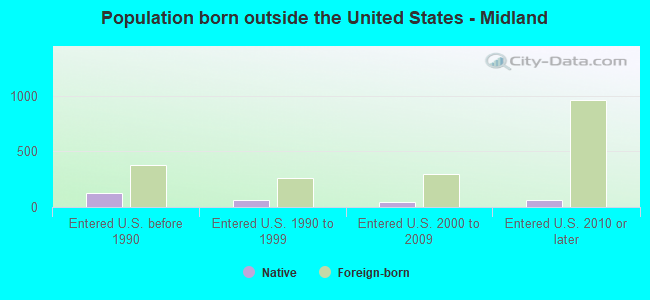
Foreign-born residents in Midland 1,852 residents are foreign born (2.2% Asia , 0.8% Europe , 0.7% Latin America , 0.5% North America ).
This city:
4.4%Michigan:
6.9%
Marital status for residents in Midland Marital status - White (Caucasian) population 15 years and over
Males 30.2% Never married56.3% Now married1.1% Separated3.2% Widowed9.2% DivorcedFemales 25.2% Never married48.1% Now married1.9% Separated10.2% Widowed14.6% DivorcedWomen who gave birth in the past 12 months Now married:
92.9% (474)Unmarried:
7.1% (36)
Women who did not give birth in the past 12 months Now married:
45.3% (3,554)Unmarried:
54.7% (4,298)
Marital status - Black or African American population 15 years and over
Males 42.9% Never married45.7% Now married0.4% Separated2.2% Widowed8.9% DivorcedFemales 47.6% Never married28.8% Now married6.6% Separated5.9% Widowed11.1% DivorcedWomen who did not give birth in the past 12 months Now married:
34.8% (69)Unmarried:
65.2% (130)
Marital status - American Indian / Alaska Native population 15 years and over
Males 0.0% Never married0.0% Now married0.0% Separated2.1% Widowed97.9% DivorcedFemales 27.3% Never married38.6% Now married0.0% Separated0.0% Widowed34.1% DivorcedWomen who did not give birth in the past 12 months Now married:
0.0% (0)Unmarried:
100.0% (12)
Marital status - Asian population 15 years and over
Males 22.6% Never married71.4% Now married0.0% Separated2.3% Widowed3.7% DivorcedFemales 21.0% Never married76.8% Now married0.0% Separated2.1% Widowed0.2% DivorcedWomen who gave birth in the past 12 months Now married:
100.0% (32)Unmarried:
0.0% (0)
Women who did not give birth in the past 12 months Now married:
67.4% (182)Unmarried:
32.6% (88)
Marital status - Other race population 15 years and over
Males 13.3% Never married58.6% Now married0.0% Separated0.0% Widowed28.1% DivorcedFemales 35.2% Never married42.8% Now married0.0% Separated0.0% Widowed22.0% DivorcedWomen who did not give birth in the past 12 months Now married:
47.9% (139)Unmarried:
52.1% (150)
Marital status - Two or more races population 15 years and over
Males 29.4% Never married57.4% Now married0.0% Separated2.3% Widowed10.9% DivorcedFemales 30.6% Never married49.6% Now married2.3% Separated0.0% Widowed17.4% DivorcedWomen who gave birth in the past 12 months Now married:
100.0% (21)Unmarried:
0.0% (0)
Women who did not give birth in the past 12 months Now married:
45.9% (112)Unmarried:
54.1% (132)
Marital status - White alone, not Hispanic / Latino population 15 years and over
Males 29.9% Never married56.6% Now married0.9% Separated3.3% Widowed9.4% DivorcedFemales 24.6% Never married48.4% Now married2.0% Separated10.4% Widowed14.7% DivorcedWomen who gave birth in the past 12 months Now married:
92.8% (472)Unmarried:
7.2% (37)
Women who did not give birth in the past 12 months Now married:
45.7% (3,534)Unmarried:
54.3% (4,199)
Marital status - Hispanic or Latino population 15 years and over
Males 19.0% Never married61.5% Now married6.1% Separated0.0% Widowed13.5% DivorcedFemales 48.8% Never married37.4% Now married0.8% Separated0.0% Widowed13.0% DivorcedWomen who gave birth in the past 12 months Now married:
100.0% (8)Unmarried:
0.0% (0)
Women who did not give birth in the past 12 months Now married:
38.3% (197)Unmarried:
61.7% (317)
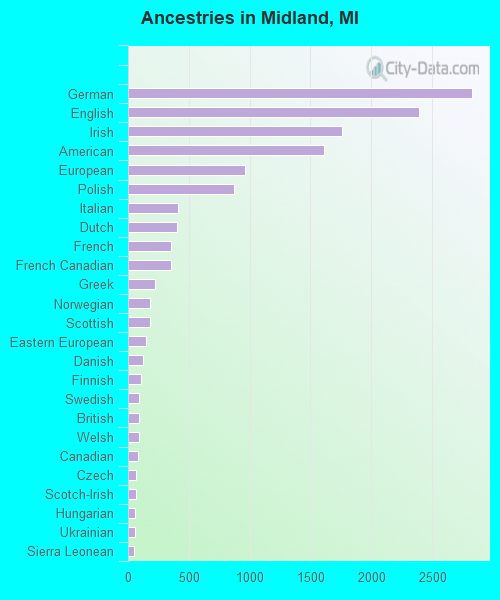
Ancestries in Midland
2,827 16.8% German2,392 14.2% English1,762 10.5% Irish1,610 9.6% American959 5.7% European872 5.2% Polish410 2.4% Italian403 2.4% Dutch357 2.1% French354 2.1% French Canadian218 1.3% Greek185 1.1% Norwegian182 1.1% Scottish152 0.9% Eastern European125 0.7% Danish105 0.6% Finnish91 0.5% Swedish87 0.5% British87 0.5% Welsh82 0.5% Canadian67 0.4% Czech62 0.4% Scotch-Irish60 0.4% Hungarian59 0.4% Ukrainian53 0.3% Sierra Leonean41 0.2% Belgian31 0.2% Lebanese28 0.2% Ghanaian23 0.1% Lithuanian19 0.1% Armenian18 0.1% Pennsylvania German17 0.1% Iranian15 0.09% Russian15 0.09% Scandinavian15 0.09% Albanian14 0.08% Romanian14 0.08% Northern European13 0.08% Slavic12 0.07% Syrian7 0.04% Slovak6 0.04% Czechoslovakian6 0.04% Jamaican
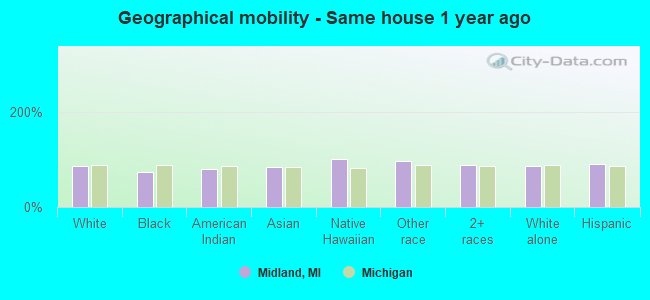
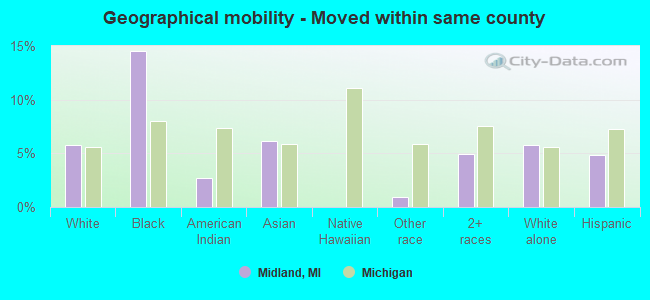
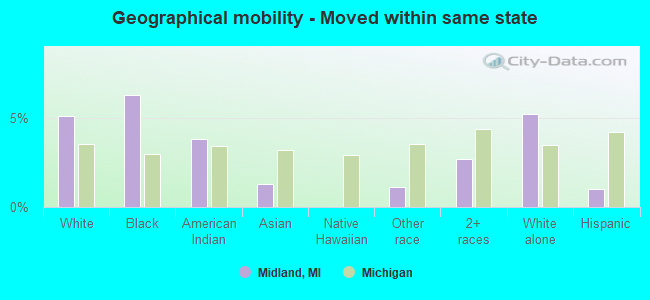
Geographical mobility in Midland Same house 1 year ago 31,695 85.3% White (Caucasian)709 72.9% Black or African American74 80.0% American Indian / Alaska Native1,025 84.2% Asian26 100.0% Native Hawaiian / Pacific Islander1,011 96.9% Other race1,432 87.0% Two or more races31,336 85.2% White alone, not Hispanic / Latino1,741 90.4% Hispanic or LatinoMoved within same county 2,130 5.7% White / Caucasian142 14.6% Black or African American3 2.7% American Indian / Alaska Native74 6.1% Asian10 1.0% Other race81 4.9% Two or more races2,106 5.7% White alone, not Hispanic / Latino94 4.9% Hispanic or LatinoMoved within same state 1,880 5.1% White / Caucasian61 6.3% Black or African American4 3.8% American Indian / Alaska Native16 1.3% Asian12 1.1% Other race44 2.7% Two or more races1,913 5.2% White alone, not Hispanic / Latino20 1.0% Hispanic or LatinoMoved from different state 1,549 4.2% White / Caucasian49 5.1% Black or African American11 11.9% American Indian / Alaska Native41 3.3% Asian17 1.6% Other race94 5.7% Two or more races1,534 4.2% White alone, not Hispanic / Latino77 4.0% Hispanic or LatinoMoved from abroad 4 0.0% White65 5.4% Asian4 0.0% White alone, not Hispanic / Latino
Children Nativity (place of birth) in Midland
Children under 6 years - Living with two parents Both parents native 2,082 99.3% Native15 0.7% Foreign-bornBoth parents foreign-born 171 100.0% NativeOne native, one foreign-born parent 88 100.0% NativeChildren under 6 years - Living with one parent Native parent 459 100.0% NativeChildren 6 to 17 years - Living with two parents Both parents native 3,798 98.4% Native64 1.6% Foreign-bornBoth parents foreign-born 170 59.2% Native117 40.8% Foreign-bornOne native, one foreign-born parent 62 82.2% Native13 17.8% Foreign-bornChildren 6 to 17 years - Living with one parent Native parent 1,508 100.0% Native
Grandparents responsible for own grandchildren in Midland
Grandparents (30 to 59 years) White / Caucasian 57 53.6% Responsible for grandchildren49 46.4% Not responsible for grandchildrenWhite alone, not Hispanic / Latino 57 53.7% Responsible for grandchildren49 46.3% Not responsible for grandchildrenGrandparents (60 years and over) White / Caucasian 85 29.6% Responsible for grandchildren202 70.4% Not responsible for grandchildrenWhite alone, not Hispanic / Latino 86 29.7% Responsible for grandchildren202 70.3% Not responsible for grandchildren