Races in Midlothian, Illinois (IL) Detailed Stats
Data:
Races - White alone (%)
Races - White alone (% change since 2000)
Races - Black alone (%)
Races - Black alone (% change since 2000)
Races - American Indian alone (%)
Races - American Indian alone (% change since 2000)
Races - Asian alone (%)
Races - Asian alone (% change since 2000)
Races - Hispanic (%)
Races - Hispanic (% change since 2000)
Races - Native Hawaiian and Other Pacific Islander alone (%)
Races - Native Hawaiian and Other Pacific Islander alone (% change since 2000)
Races - Two or more races(%)
Races - Two or more races(% change since 2000)
Races - Other race alone (%)
Races - Other race alone (% change since 2000)
Racial diversity
Place of birth - Born in state of residence (%)
Place of birth - Born in state of residence (%) - White
Place of birth - Born in state of residence (%) - Black or African American
Place of birth - Born in state of residence (%) - Asian
Place of birth - Born in state of residence (%) - Hispanic or Latino
Place of birth - Born in state of residence (%) - American Indian and Alaska Native
Place of birth - Born in state of residence (%) - Multirace
Place of birth - Born in state of residence (%) - Other Race
Place of birth - Born in other state (%)
Place of birth - Born in other state (%) - White
Place of birth - Born in other state (%) - Black or African American
Place of birth - Born in other state (%) - Asian
Place of birth - Born in other state (%) - Hispanic or Latino
Place of birth - Born in other state (%) - American Indian and Alaska Native
Place of birth - Born in other state (%) - Multirace
Place of birth - Born in other state (%) - Other Race
Place of birth - Native, outside of US (%)
Place of birth - Native, outside of US (%) - White
Place of birth - Native, outside of US (%) - Black or African American
Place of birth - Native, outside of US (%) - Asian
Place of birth - Native, outside of US (%) - Hispanic or Latino
Place of birth - Native, outside of US (%) - American Indian and Alaska Native
Place of birth - Native, outside of US (%) - Multirace
Place of birth - Native, outside of US (%) - Other Race
Place of birth - Foreign born (%)
Place of birth - Foreign born (%) - White
Place of birth - Foreign born (%) - Black or African American
Place of birth - Foreign born (%) - Asian
Place of birth - Foreign born (%) - Hispanic or Latino
Place of birth - Foreign born (%) - American Indian and Alaska Native
Place of birth - Foreign born (%) - Multirace
Place of birth - Foreign born (%) - Other Race
Residents speaking English at home (%)
Residents speaking English at home - Born in the United States (%)
Residents speaking English at home - Native, born elsewhere (%)
Residents speaking English at home - Foreign born (%)
Residents speaking Spanish at home (%)
Residents speaking Spanish at home - Born in the United States (%)
Residents speaking Spanish at home - Native, born elsewhere (%)
Residents speaking Spanish at home - Foreign born (%)
Residents speaking other language at home (%)
Residents speaking other language at home - Born in the United States (%)
Residents speaking other language at home - Native, born elsewhere (%)
Residents speaking other language at home - Foreign born (%)
Marital status - Never married (%)
Marital status - Now married (%)
Marital status - Separated (%)
Marital status - Widowed (%)
Marital status - Divorced (%)
Ancestries Reported - Arab (%)
Ancestries Reported - Czech (%)
Ancestries Reported - Danish (%)
Ancestries Reported - Dutch (%)
Ancestries Reported - English (%)
Ancestries Reported - French (%)
Ancestries Reported - French Canadian (%)
Ancestries Reported - German (%)
Ancestries Reported - Greek (%)
Ancestries Reported - Hungarian (%)
Ancestries Reported - Irish (%)
Ancestries Reported - Italian (%)
Ancestries Reported - Lithuanian (%)
Ancestries Reported - Norwegian (%)
Ancestries Reported - Polish (%)
Ancestries Reported - Portuguese (%)
Ancestries Reported - Russian (%)
Ancestries Reported - Scotch-Irish (%)
Ancestries Reported - Scottish (%)
Ancestries Reported - Slovak (%)
Ancestries Reported - Subsaharan African (%)
Ancestries Reported - Swedish (%)
Ancestries Reported - Swiss (%)
Ancestries Reported - Ukrainian (%)
Ancestries Reported - United States (%)
Ancestries Reported - Welsh (%)
Ancestries Reported - West Indian (%)
Ancestries Reported - Other (%)
Geographical mobility - Same house 1 year ago (%)
Geographical mobility - Same house 1 year ago (%) - White
Geographical mobility - Same house 1 year ago (%) - Black or African American
Geographical mobility - Same house 1 year ago (%) - Asian
Geographical mobility - Same house 1 year ago (%) - Hispanic or Latino
Geographical mobility - Same house 1 year ago (%) - American Indian and Alaska Native
Geographical mobility - Same house 1 year ago (%) - Multirace
Geographical mobility - Same house 1 year ago (%) - Other Race
Geographical mobility - Moved within same county (%)
Geographical mobility - Moved within same county (%) - White
Geographical mobility - Moved within same county (%) - Black or African American
Geographical mobility - Moved within same county (%) - Asian
Geographical mobility - Moved within same county (%) - Hispanic or Latino
Geographical mobility - Moved within same county (%) - American Indian and Alaska Native
Geographical mobility - Moved within same county (%) - Multirace
Geographical mobility - Moved within same county (%) - Other Race
Geographical mobility - Moved from different county within same state (%)
Geographical mobility - Moved from different county within same state (%) - White
Geographical mobility - Moved from different county within same state (%) - Black or African American
Geographical mobility - Moved from different county within same state (%) - Asian
Geographical mobility - Moved from different county within same state (%) - Hispanic or Latino
Geographical mobility - Moved from different county within same state (%) - American Indian and Alaska Native
Geographical mobility - Moved from different county within same state (%) - Multirace
Geographical mobility - Moved from different county within same state (%) - Other Race
Geographical mobility - Moved from different state (%)
Geographical mobility - Moved from different state (%) - White
Geographical mobility - Moved from different state (%) - Black or African American
Geographical mobility - Moved from different state (%) - Asian
Geographical mobility - Moved from different state (%) - Hispanic or Latino
Geographical mobility - Moved from different state (%) - American Indian and Alaska Native
Geographical mobility - Moved from different state (%) - Multirace
Geographical mobility - Moved from different state (%) - Other Race
Geographical mobility - Moved from abroad (%)
Geographical mobility - Moved from abroad (%) - White
Geographical mobility - Moved from abroad (%) - Black or African American
Geographical mobility - Moved from abroad (%) - Asian
Geographical mobility - Moved from abroad (%) - Hispanic or Latino
Geographical mobility - Moved from abroad (%) - American Indian and Alaska Native
Geographical mobility - Moved from abroad (%) - Multirace
Geographical mobility - Moved from abroad (%) - Other Race
Place of birth for the foreign-born population - Ireland (%)
Place of birth for the foreign-born population - Denmark (%)
Place of birth for the foreign-born population - Norway (%)
Place of birth for the foreign-born population - Sweden (%)
Place of birth for the foreign-born population - United Kingdom (%)
Place of birth for the foreign-born population - England (%)
Place of birth for the foreign-born population - Scotland (%)
Place of birth for the foreign-born population - Other Northern Europe (%)
Place of birth for the foreign-born population - Austria (%)
Place of birth for the foreign-born population - Belgium (%)
Place of birth for the foreign-born population - France (%)
Place of birth for the foreign-born population - Germany (%)
Place of birth for the foreign-born population - Netherlands (%)
Place of birth for the foreign-born population - Switzerland (%)
Place of birth for the foreign-born population - Other Western Europe (%)
Place of birth for the foreign-born population - Greece (%)
Place of birth for the foreign-born population - Italy (%)
Place of birth for the foreign-born population - Portugal (%)
Place of birth for the foreign-born population - Spain (%)
Place of birth for the foreign-born population - Other Southern Europe (%)
Place of birth for the foreign-born population - Albania (%)
Place of birth for the foreign-born population - Belarus (%)
Place of birth for the foreign-born population - Bosnia and Herzegovina (%)
Place of birth for the foreign-born population - Bulgaria (%)
Place of birth for the foreign-born population - Croatia (%)
Place of birth for the foreign-born population - Czechoslovakia (%)
Place of birth for the foreign-born population - Hungary (%)
Place of birth for the foreign-born population - Latvia (%)
Place of birth for the foreign-born population - Lithuania (%)
Place of birth for the foreign-born population - North Macedonia (Macedonia) (%)
Place of birth for the foreign-born population - Moldova (%)
Place of birth for the foreign-born population - Poland (%)
Place of birth for the foreign-born population - Romania (%)
Place of birth for the foreign-born population - Russia (%)
Place of birth for the foreign-born population - Serbia (%)
Place of birth for the foreign-born population - Ukraine (%)
Place of birth for the foreign-born population - Other Eastern Europe (%)
Place of birth for the foreign-born population - China (%)
Place of birth for the foreign-born population - Hong Kong (%)
Place of birth for the foreign-born population - Taiwan (%)
Place of birth for the foreign-born population - Japan (%)
Place of birth for the foreign-born population - Korea (%)
Place of birth for the foreign-born population - Other Eastern Asia (%)
Place of birth for the foreign-born population - Afghanistan (%)
Place of birth for the foreign-born population - Bangladesh (%)
Place of birth for the foreign-born population - India (%)
Place of birth for the foreign-born population - Iran (%)
Place of birth for the foreign-born population - Kazakhstan (%)
Place of birth for the foreign-born population - Nepal (%)
Place of birth for the foreign-born population - Pakistan (%)
Place of birth for the foreign-born population - Sri Lanka (%)
Place of birth for the foreign-born population - Uzbekistan (%)
Place of birth for the foreign-born population - Other South Central Asia (%)
Place of birth for the foreign-born population - Burma (%)
Place of birth for the foreign-born population - Cambodia (%)
Place of birth for the foreign-born population - Indonesia (%)
Place of birth for the foreign-born population - Laos (%)
Place of birth for the foreign-born population - Malaysia (%)
Place of birth for the foreign-born population - Philippines (%)
Place of birth for the foreign-born population - Singapore (%)
Place of birth for the foreign-born population - Thailand (%)
Place of birth for the foreign-born population - Vietnam (%)
Place of birth for the foreign-born population - Other South Eastern Asia (%)
Place of birth for the foreign-born population - Armenia (%)
Place of birth for the foreign-born population - Iraq (%)
Place of birth for the foreign-born population - Israel (%)
Place of birth for the foreign-born population - Jordan (%)
Place of birth for the foreign-born population - Kuwait (%)
Place of birth for the foreign-born population - Lebanon (%)
Place of birth for the foreign-born population - Saudi Arabia (%)
Place of birth for the foreign-born population - Syria (%)
Place of birth for the foreign-born population - Turkey (%)
Place of birth for the foreign-born population - Yemen (%)
Place of birth for the foreign-born population - Other Western Asia (%)
Place of birth for the foreign-born population - Eritrea (%)
Place of birth for the foreign-born population - Ethiopia (%)
Place of birth for the foreign-born population - Kenya (%)
Place of birth for the foreign-born population - Somalia (%)
Place of birth for the foreign-born population - Uganda (%)
Place of birth for the foreign-born population - Zimbabwe (%)
Place of birth for the foreign-born population - Other Eastern Africa (%)
Place of birth for the foreign-born population - Cameroon (%)
Place of birth for the foreign-born population - Congo (%)
Place of birth for the foreign-born population - Democratic Republic of Congo (Zaire) (%)
Place of birth for the foreign-born population - Other Middle Africa (%)
Place of birth for the foreign-born population - Egypt (%)
Place of birth for the foreign-born population - Morocco (%)
Place of birth for the foreign-born population - Sudan (%)
Place of birth for the foreign-born population - Other Northern Africa (%)
Place of birth for the foreign-born population - South Africa (%)
Place of birth for the foreign-born population - Other Southern Africa (%)
Place of birth for the foreign-born population - Cabo Verde (%)
Place of birth for the foreign-born population - Ghana (%)
Place of birth for the foreign-born population - Liberia (%)
Place of birth for the foreign-born population - Nigeria (%)
Place of birth for the foreign-born population - Senegal (%)
Place of birth for the foreign-born population - Sierra Leone (%)
Place of birth for the foreign-born population - Other Western Africa (%)
Place of birth for the foreign-born population - Australia (%)
Place of birth for the foreign-born population - New Zealand (%)
Place of birth for the foreign-born population - Fiji (%)
Place of birth for the foreign-born population - Micronesia (%)
Place of birth for the foreign-born population - Bahamas (%)
Place of birth for the foreign-born population - Barbados (%)
Place of birth for the foreign-born population - Cuba (%)
Place of birth for the foreign-born population - Dominica (%)
Place of birth for the foreign-born population - Dominican Republic (%)
Place of birth for the foreign-born population - Grenada (%)
Place of birth for the foreign-born population - Haiti (%)
Place of birth for the foreign-born population - Jamaica (%)
Place of birth for the foreign-born population - St. Vincent and the Grenadines (%)
Place of birth for the foreign-born population - Trinidad and Tobago (%)
Place of birth for the foreign-born population - West Indies (%)
Place of birth for the foreign-born population - Other Caribbean (%)
Place of birth for the foreign-born population - Belize (%)
Place of birth for the foreign-born population - Costa Rica (%)
Place of birth for the foreign-born population - El Salvador (%)
Place of birth for the foreign-born population - Guatemala (%)
Place of birth for the foreign-born population - Honduras (%)
Place of birth for the foreign-born population - Mexico (%)
Place of birth for the foreign-born population - Nicaragua (%)
Place of birth for the foreign-born population - Panama (%)
Place of birth for the foreign-born population - Other Central America (%)
Place of birth for the foreign-born population - Argentina (%)
Place of birth for the foreign-born population - Bolivia (%)
Place of birth for the foreign-born population - Brazil (%)
Place of birth for the foreign-born population - Chile (%)
Place of birth for the foreign-born population - Colombia (%)
Place of birth for the foreign-born population - Ecuador (%)
Place of birth for the foreign-born population - Guyana (%)
Place of birth for the foreign-born population - Peru (%)
Place of birth for the foreign-born population - Uruguay (%)
Place of birth for the foreign-born population - Venezuela (%)
Place of birth for the foreign-born population - Other South America (%)
Place of birth for the foreign-born population - Canada (%)
Place of birth for the foreign-born population - Other Northern America (%)
Place of birth for the foreign-born population - Other (%)
Latest news about races in Midlothian, IL collected exclusively by city-data.com from local newspapers, TV, and radio stations
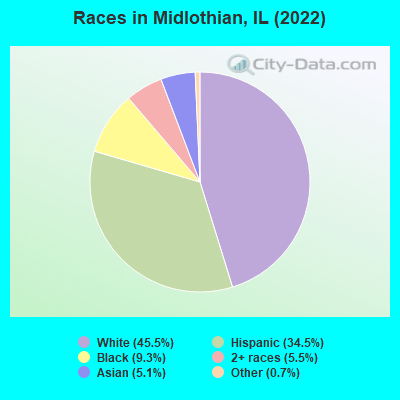
According to 2022 data, the most numerous races in Midlothian, IL are White alone (6,318 residents), Hispanic (4,784 residents), and Black alone (1,293 residents). 74.0% of Midlothian residents speak English at home. 18.3% of Midlothian, IL residents are foreign-born (12.7% born in Latin America, 3.7% born in Asia), which is 23.3% greater than the foreign-born rate of 14.0% across the entire state of Illinois.
Race distribution in Midlothian
2000 2022
8,424,140 67.8% White alone 1,856,152 14.9% Black alone 1,530,262 12.3% Hispanic 419,916 3.4% Asian alone 153,996 1.2% Two or more races 13,479 0.1% Other race alone 18,232 0.1% American Indian alone 3,116 0.03% Native Hawaiian and Other
7,356,301 58.5% White alone 2,299,726 18.3% Hispanic 1,660,423 13.2% Black alone 747,296 5.9% Asian alone 458,599 3.6% Two or more races 45,386 0.4% Other race alone 10,405 0.08% American Indian alone 3,896 0.03% Native Hawaiian and Other
Income and house value in Midlothian Median household income in 2022 $74,487 White non-Hispanic householders$27,886 Black householders$125,519 Asian householders$72,705 Hispanic or Latino race householdersMedian 2022 house value $188,234 White Non-Hispanic householders$179,655 Black or African American householders $311,963 Asian householders$156,724 Some other race householders$193,348 Two or more races householders$211,165 Hispanic or Latino householders
Median age by race in Midlothian
48.1 Median age for White residents48.4 47.4 35.8 Median age for Black or African American residents35.6 39.0 14.3 Median age for American Indian / Alaska Native residents14.9 32.3 44.5 Median age for Asian residents47.8 43.8 -687,999,999.3 Median age for Native Hawaiian / Pacific Islander residents-918,721,460.3 -610,229,276.3 29.1 Median age for Other race residents33.3 28.5 19.2 Median age for Two or more races residents15.1 31.4 53.1 Median age for White alone residents50.9 54.2 33.0 Median age for Hispanic or Latino residents32.9 33.0
Owner/renter occupied households by race in Midlothian
House owners and renters - White residents 2,939 83.0% Owner occupied600 17.0% Renter occupiedHouse owners and renters - Black or African American residents 197 24.4% Owner occupied611 75.6% Renter occupiedHouse owners and renters - American Indian / Alaska Native residents 38 100.0% Owner occupiedHouse owners and renters - Asian residents 141 72.6% Owner occupied53 27.4% Renter occupiedHouse owners and renters - Other race residents 678 100.0% Owner occupiedHouse owners and renters - Two or more races residents 577 95.2% Owner occupied29 4.8% Renter occupiedHouse owners and renters - White alone residents 2,495 80.5% Owner occupied604 19.5% Renter occupiedHouse owners and renters - Hispanic or Latino residents 1,656 95.5% Owner occupied78 4.5% Renter occupied
Language usage in Midlothian
English speakers - Total 74.0% of residents of Midlothian speak English at home.
19.6% of residents speak Spanish at home 1,462 56.5% Speak English very well1,125 43.5% Speak English less than very well6.1% of residents speak other language at home 716 88.2% Speak English very well96 11.8% Speak English less than very well
English speakers - Born in the United States 90.3% of residents of Midlothian speak English at home.
7.4% of residents speak Spanish at home 78 100.0% Speak English very well1.7% of residents speak other language at home 18 100.0% Speak English very well
English speakers - Native, born elsewhere 70.6% of residents of Midlothian speak English at home.
29.4% of residents speak Spanish at home 10 100.0% Speak English very well
English speakers - Foreign-born 21.3% of residents of Midlothian speak English at home.
51.6% of residents speak Spanish at home 410 31.3% Speak English very well898 68.7% Speak English less than very well26.5% of residents speak other language at home 576 85.6% Speak English very well97 14.4% Speak English less than very well
White (Caucasian) - Speak only English Native:
95.9% (6,163)Foreign-born:
49.5% (416)
White (Caucasian) - Speak another language Native:
6.2% (398)Foreign-born:
53.2% (447)
Black or African American - Speak only English Native:
100.0% (1,222)Foreign-born:
100.0% (29)
American Indian / Alaska Native - Speak another language Native:
100.0% (78)Foreign-born:
100.0% (72)
Asian - Speak only English Native:
84.7% (159)Foreign-born:
5.4% (28)
Asian - Speak another language Native:
15.6% (29)Foreign-born:
95.4% (493)
Other race - Speak another language Native:
80.5% (759)Foreign-born:
100.0% (763)
Two or more races - Speak another language Native:
6.4% (122)Foreign-born:
100.0% (285)
White alone - Speak only English Native:
97.3% (5,761)Foreign-born:
19.9% (49)
White alone - Speak another language Native:
2.1% (125)Foreign-born:
79.5% (195)
Hispanic or Latino - Speak only English Native:
56.0% (1,442)Foreign-born:
23.6% (417)
Hispanic or Latino - Speak another language Native:
45.5% (1,172)Foreign-born:
74.1% (1,310)
Foreign-born residents in Midlothian 2,536 residents are foreign born (12.7% Latin America , 3.7% Asia ).
This city:
18.3%Illinois:
14.1%
Marital status for residents in Midlothian Marital status - White (Caucasian) population 15 years and over
Males 28.9% Never married55.4% Now married0.5% Separated3.3% Widowed12.0% DivorcedFemales 21.6% Never married53.6% Now married0.0% Separated12.8% Widowed12.0% DivorcedWomen who gave birth in the past 12 months Now married:
22.2% (14)Unmarried:
77.8% (47)
Women who did not give birth in the past 12 months Now married:
49.4% (661)Unmarried:
50.6% (677)
Marital status - Black or African American population 15 years and over
Males 44.6% Never married26.2% Now married1.3% Separated0.0% Widowed27.8% DivorcedFemales 47.6% Never married25.2% Now married4.1% Separated10.1% Widowed13.1% DivorcedWomen who did not give birth in the past 12 months Now married:
33.5% (132)Unmarried:
66.5% (263)
Marital status - American Indian / Alaska Native population 15 years and over
Males 0.0% Never married100.0% Now married0.0% Separated0.0% Widowed0.0% DivorcedFemales 0.0% Never married100.0% Now married0.0% Separated0.0% Widowed0.0% DivorcedWomen who did not give birth in the past 12 months Now married:
100.0% (34)Unmarried:
0.0% (0)
Marital status - Asian population 15 years and over
Males 41.5% Never married50.2% Now married0.0% Separated8.3% Widowed0.0% DivorcedFemales 47.7% Never married52.3% Now married0.0% Separated0.0% Widowed0.0% DivorcedWomen who did not give birth in the past 12 months Now married:
38.5% (90)Unmarried:
61.5% (143)
Marital status - Other race population 15 years and over
Males 30.2% Never married68.1% Now married0.0% Separated0.0% Widowed1.7% DivorcedFemales 40.7% Never married59.3% Now married0.0% Separated0.0% Widowed0.0% DivorcedWomen who gave birth in the past 12 months Now married:
60.0% (27)Unmarried:
40.0% (18)
Women who did not give birth in the past 12 months Now married:
50.0% (233)Unmarried:
50.0% (233)
Marital status - Two or more races population 15 years and over
Males 30.0% Never married44.6% Now married0.0% Separated0.0% Widowed25.4% DivorcedFemales 32.5% Never married65.4% Now married2.0% Separated0.0% Widowed0.0% DivorcedWomen who gave birth in the past 12 months Now married:
100.0% (24)Unmarried:
0.0% (0)
Women who did not give birth in the past 12 months Now married:
63.1% (456)Unmarried:
36.9% (266)
Marital status - White alone, not Hispanic / Latino population 15 years and over
Males 30.9% Never married51.9% Now married0.7% Separated3.8% Widowed12.8% DivorcedFemales 22.1% Never married48.3% Now married0.0% Separated15.4% Widowed14.2% DivorcedWomen who gave birth in the past 12 months Now married:
34.0% (15)Unmarried:
66.0% (30)
Women who did not give birth in the past 12 months Now married:
34.4% (326)Unmarried:
65.6% (623)
Marital status - Hispanic or Latino population 15 years and over
Males 23.8% Never married66.8% Now married0.0% Separated0.6% Widowed8.8% DivorcedFemales 27.5% Never married69.0% Now married0.7% Separated1.2% Widowed1.5% DivorcedWomen who gave birth in the past 12 months Now married:
29.3% (17)Unmarried:
70.7% (41)
Women who did not give birth in the past 12 months Now married:
67.7% (956)Unmarried:
32.3% (457)
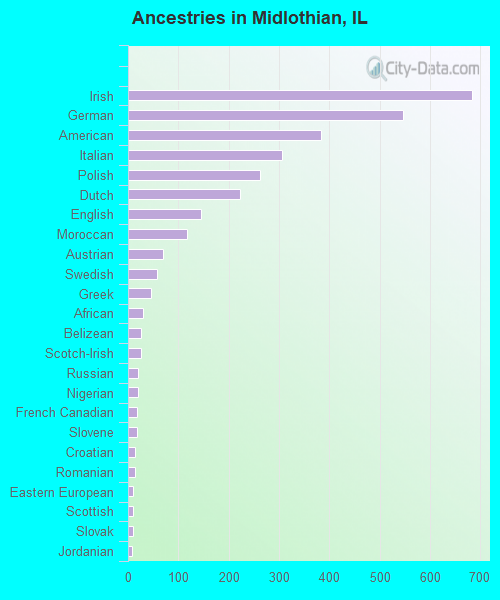
Ancestries in Midlothian
683 8.5% Irish546 6.8% German383 4.8% American305 3.8% Italian263 3.3% Polish222 2.8% Dutch145 1.8% English117 1.5% Moroccan70 0.9% Austrian58 0.7% Swedish45 0.6% Greek29 0.4% African26 0.3% Belizean25 0.3% Scotch-Irish19 0.2% Russian19 0.2% Nigerian18 0.2% French Canadian17 0.2% Slovene13 0.2% Croatian13 0.2% Romanian9 0.1% Eastern European9 0.1% Scottish9 0.1% Slovak8 0.10% Jordanian6 0.07% Czechoslovakian4 0.05% Hungarian
Geographical mobility in Midlothian Same house 1 year ago 6,977 93.8% White (Caucasian)1,163 89.0% Black or African American145 98.7% American Indian / Alaska Native686 97.7% Asian1,849 100.0% Other race2,180 91.1% Two or more races5,898 93.7% White alone, not Hispanic / Latino4,496 95.1% Hispanic or LatinoMoved within same county 324 4.4% White / Caucasian116 8.8% Black or African American10 1.4% Asian15 0.8% Other race188 7.9% Two or more races286 4.5% White alone, not Hispanic / Latino207 4.4% Hispanic or LatinoMoved within same state 60 0.8% White / Caucasian63 1.0% White alone, not Hispanic / LatinoMoved from different state 7 0.1% White / Caucasian24 1.8% Black or African American7 0.1% White alone, not Hispanic / LatinoMoved from abroad 1 0.1% Other race2 0.0% Hispanic or Latino
Children Nativity (place of birth) in Midlothian
Children under 6 years - Living with two parents Both parents native 298 100.0% NativeBoth parents foreign-born 83 100.0% NativeOne native, one foreign-born parent 93 100.0% NativeChildren under 6 years - Living with one parent Native parent 221 100.0% NativeChildren 6 to 17 years - Living with two parents Both parents native 527 100.0% NativeBoth parents foreign-born 498 86.3% Native79 13.7% Foreign-bornOne native, one foreign-born parent 337 96.2% Native13 3.8% Foreign-bornChildren 6 to 17 years - Living with one parent Native parent 710 100.0% NativeForeign-born parent 128 50.1% Native128 49.9% Foreign-born
Grandparents responsible for own grandchildren in Midlothian
Grandparents (30 to 59 years) White / Caucasian 33 56.6% Responsible for grandchildren25 43.4% Not responsible for grandchildrenWhite alone, not Hispanic / Latino 44 100.0% Responsible for grandchildrenHispanic or Latino 40 100.0% Not responsible for grandchildren
Grandparents (60 years and over) White / Caucasian 42 100.0% Not responsible for grandchildrenWhite alone, not Hispanic / Latino 54 100.0% Not responsible for grandchildrenHispanic or Latino 42 100.0% Not responsible for grandchildren