Races in Midwest City, Oklahoma (OK) Detailed Stats
Data:
Races - White alone (%)
Races - White alone (% change since 2000)
Races - Black alone (%)
Races - Black alone (% change since 2000)
Races - American Indian alone (%)
Races - American Indian alone (% change since 2000)
Races - Asian alone (%)
Races - Asian alone (% change since 2000)
Races - Hispanic (%)
Races - Hispanic (% change since 2000)
Races - Native Hawaiian and Other Pacific Islander alone (%)
Races - Native Hawaiian and Other Pacific Islander alone (% change since 2000)
Races - Two or more races(%)
Races - Two or more races(% change since 2000)
Races - Other race alone (%)
Races - Other race alone (% change since 2000)
Racial diversity
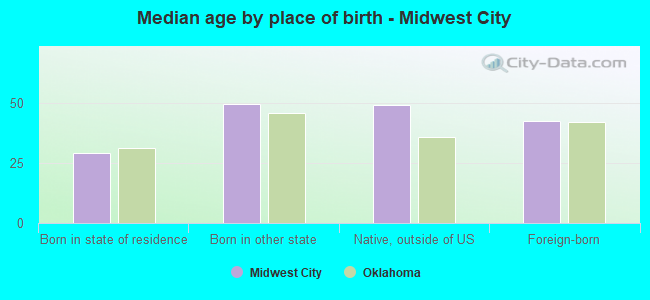
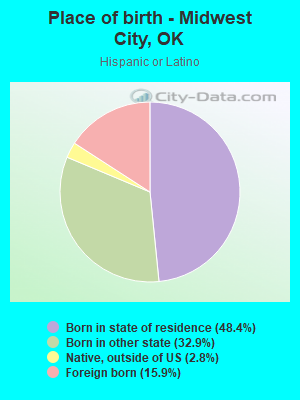
Place of birth - Born in state of residence (%)
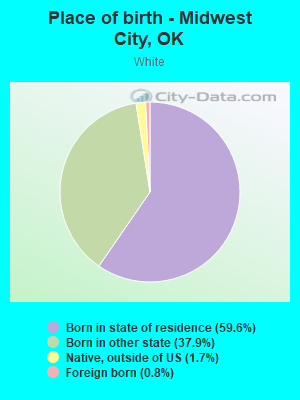
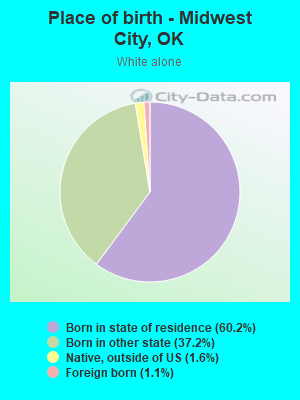
Place of birth - Born in state of residence (%) - White
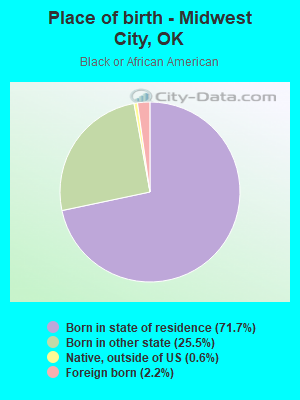
Place of birth - Born in state of residence (%) - Black or African American
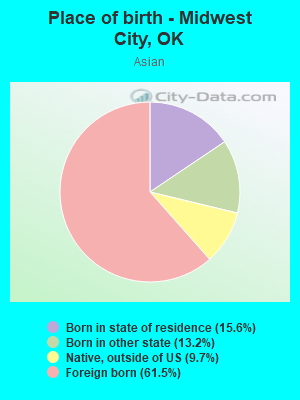
Place of birth - Born in state of residence (%) - Asian
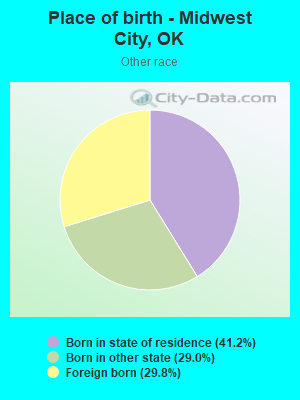
Place of birth - Born in state of residence (%) - Hispanic or Latino
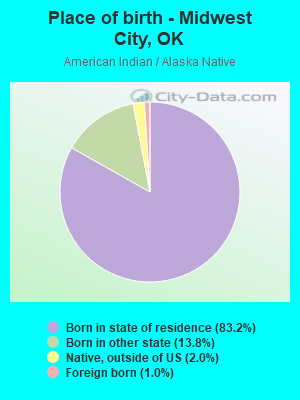
Place of birth - Born in state of residence (%) - American Indian and Alaska Native
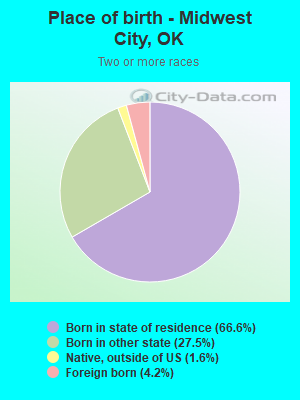
Place of birth - Born in state of residence (%) - Multirace
Place of birth - Born in state of residence (%) - Other Race
Place of birth - Born in other state (%)
Place of birth - Born in other state (%) - White
Place of birth - Born in other state (%) - Black or African American
Place of birth - Born in other state (%) - Asian
Place of birth - Born in other state (%) - Hispanic or Latino
Place of birth - Born in other state (%) - American Indian and Alaska Native
Place of birth - Born in other state (%) - Multirace
Place of birth - Born in other state (%) - Other Race
Place of birth - Native, outside of US (%)
Place of birth - Native, outside of US (%) - White
Place of birth - Native, outside of US (%) - Black or African American
Place of birth - Native, outside of US (%) - Asian
Place of birth - Native, outside of US (%) - Hispanic or Latino
Place of birth - Native, outside of US (%) - American Indian and Alaska Native
Place of birth - Native, outside of US (%) - Multirace
Place of birth - Native, outside of US (%) - Other Race
Place of birth - Foreign born (%)
Place of birth - Foreign born (%) - White
Place of birth - Foreign born (%) - Black or African American
Place of birth - Foreign born (%) - Asian
Place of birth - Foreign born (%) - Hispanic or Latino
Place of birth - Foreign born (%) - American Indian and Alaska Native
Place of birth - Foreign born (%) - Multirace
Place of birth - Foreign born (%) - Other Race
Residents speaking English at home (%)
Residents speaking English at home - Born in the United States (%)
Residents speaking English at home - Native, born elsewhere (%)
Residents speaking English at home - Foreign born (%)
Residents speaking Spanish at home (%)
Residents speaking Spanish at home - Born in the United States (%)
Residents speaking Spanish at home - Native, born elsewhere (%)
Residents speaking Spanish at home - Foreign born (%)
Residents speaking other language at home (%)
Residents speaking other language at home - Born in the United States (%)
Residents speaking other language at home - Native, born elsewhere (%)
Residents speaking other language at home - Foreign born (%)
Marital status - Never married (%)
Marital status - Now married (%)
Marital status - Separated (%)
Marital status - Widowed (%)
Marital status - Divorced (%)
Ancestries Reported - Arab (%)
Ancestries Reported - Czech (%)
Ancestries Reported - Danish (%)
Ancestries Reported - Dutch (%)
Ancestries Reported - English (%)
Ancestries Reported - French (%)
Ancestries Reported - French Canadian (%)
Ancestries Reported - German (%)
Ancestries Reported - Greek (%)
Ancestries Reported - Hungarian (%)
Ancestries Reported - Irish (%)
Ancestries Reported - Italian (%)
Ancestries Reported - Lithuanian (%)
Ancestries Reported - Norwegian (%)
Ancestries Reported - Polish (%)
Ancestries Reported - Portuguese (%)
Ancestries Reported - Russian (%)
Ancestries Reported - Scotch-Irish (%)
Ancestries Reported - Scottish (%)
Ancestries Reported - Slovak (%)
Ancestries Reported - Subsaharan African (%)
Ancestries Reported - Swedish (%)
Ancestries Reported - Swiss (%)
Ancestries Reported - Ukrainian (%)
Ancestries Reported - United States (%)
Ancestries Reported - Welsh (%)
Ancestries Reported - West Indian (%)
Ancestries Reported - Other (%)
Geographical mobility - Same house 1 year ago (%)
Geographical mobility - Same house 1 year ago (%) - White
Geographical mobility - Same house 1 year ago (%) - Black or African American
Geographical mobility - Same house 1 year ago (%) - Asian
Geographical mobility - Same house 1 year ago (%) - Hispanic or Latino
Geographical mobility - Same house 1 year ago (%) - American Indian and Alaska Native
Geographical mobility - Same house 1 year ago (%) - Multirace
Geographical mobility - Same house 1 year ago (%) - Other Race
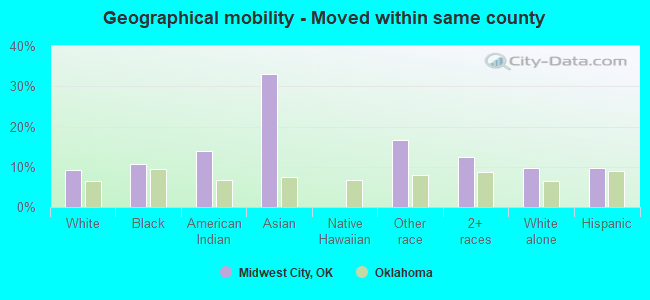
Geographical mobility - Moved within same county (%)
Geographical mobility - Moved within same county (%) - White
Geographical mobility - Moved within same county (%) - Black or African American
Geographical mobility - Moved within same county (%) - Asian
Geographical mobility - Moved within same county (%) - Hispanic or Latino
Geographical mobility - Moved within same county (%) - American Indian and Alaska Native
Geographical mobility - Moved within same county (%) - Multirace
Geographical mobility - Moved within same county (%) - Other Race
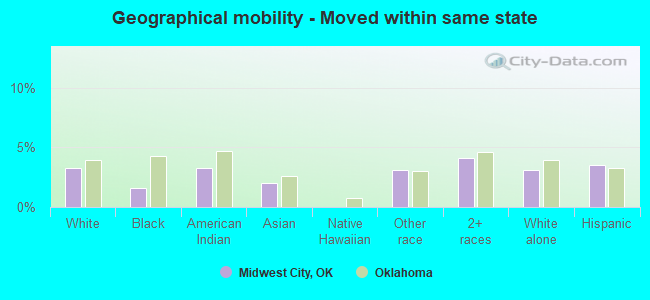
Geographical mobility - Moved from different county within same state (%)
Geographical mobility - Moved from different county within same state (%) - White
Geographical mobility - Moved from different county within same state (%) - Black or African American
Geographical mobility - Moved from different county within same state (%) - Asian
Geographical mobility - Moved from different county within same state (%) - Hispanic or Latino
Geographical mobility - Moved from different county within same state (%) - American Indian and Alaska Native
Geographical mobility - Moved from different county within same state (%) - Multirace
Geographical mobility - Moved from different county within same state (%) - Other Race
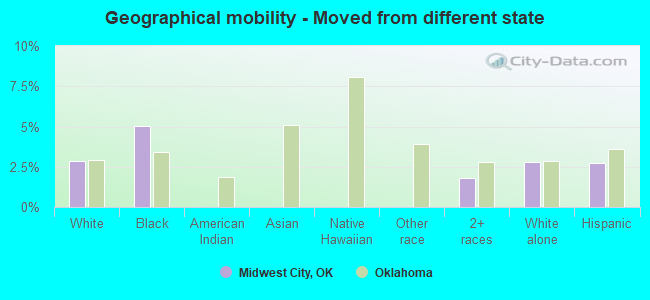
Geographical mobility - Moved from different state (%)
Geographical mobility - Moved from different state (%) - White
Geographical mobility - Moved from different state (%) - Black or African American
Geographical mobility - Moved from different state (%) - Asian
Geographical mobility - Moved from different state (%) - Hispanic or Latino
Geographical mobility - Moved from different state (%) - American Indian and Alaska Native
Geographical mobility - Moved from different state (%) - Multirace
Geographical mobility - Moved from different state (%) - Other Race
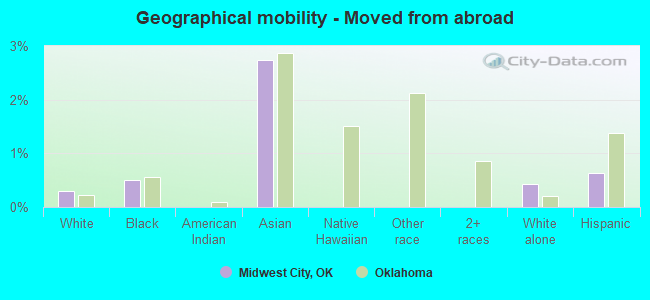
Geographical mobility - Moved from abroad (%)
Geographical mobility - Moved from abroad (%) - White
Geographical mobility - Moved from abroad (%) - Black or African American
Geographical mobility - Moved from abroad (%) - Asian
Geographical mobility - Moved from abroad (%) - Hispanic or Latino
Geographical mobility - Moved from abroad (%) - American Indian and Alaska Native
Geographical mobility - Moved from abroad (%) - Multirace
Geographical mobility - Moved from abroad (%) - Other Race
Place of birth for the foreign-born population - Ireland (%)
Place of birth for the foreign-born population - Denmark (%)
Place of birth for the foreign-born population - Norway (%)
Place of birth for the foreign-born population - Sweden (%)
Place of birth for the foreign-born population - United Kingdom (%)
Place of birth for the foreign-born population - England (%)
Place of birth for the foreign-born population - Scotland (%)
Place of birth for the foreign-born population - Other Northern Europe (%)
Place of birth for the foreign-born population - Austria (%)
Place of birth for the foreign-born population - Belgium (%)
Place of birth for the foreign-born population - France (%)
Place of birth for the foreign-born population - Germany (%)
Place of birth for the foreign-born population - Netherlands (%)
Place of birth for the foreign-born population - Switzerland (%)
Place of birth for the foreign-born population - Other Western Europe (%)
Place of birth for the foreign-born population - Greece (%)
Place of birth for the foreign-born population - Italy (%)
Place of birth for the foreign-born population - Portugal (%)
Place of birth for the foreign-born population - Spain (%)
Place of birth for the foreign-born population - Other Southern Europe (%)
Place of birth for the foreign-born population - Albania (%)
Place of birth for the foreign-born population - Belarus (%)
Place of birth for the foreign-born population - Bosnia and Herzegovina (%)
Place of birth for the foreign-born population - Bulgaria (%)
Place of birth for the foreign-born population - Croatia (%)
Place of birth for the foreign-born population - Czechoslovakia (%)
Place of birth for the foreign-born population - Hungary (%)
Place of birth for the foreign-born population - Latvia (%)
Place of birth for the foreign-born population - Lithuania (%)
Place of birth for the foreign-born population - North Macedonia (Macedonia) (%)
Place of birth for the foreign-born population - Moldova (%)
Place of birth for the foreign-born population - Poland (%)
Place of birth for the foreign-born population - Romania (%)
Place of birth for the foreign-born population - Russia (%)
Place of birth for the foreign-born population - Serbia (%)
Place of birth for the foreign-born population - Ukraine (%)
Place of birth for the foreign-born population - Other Eastern Europe (%)
Place of birth for the foreign-born population - China (%)
Place of birth for the foreign-born population - Hong Kong (%)
Place of birth for the foreign-born population - Taiwan (%)
Place of birth for the foreign-born population - Japan (%)
Place of birth for the foreign-born population - Korea (%)
Place of birth for the foreign-born population - Other Eastern Asia (%)
Place of birth for the foreign-born population - Afghanistan (%)
Place of birth for the foreign-born population - Bangladesh (%)
Place of birth for the foreign-born population - India (%)
Place of birth for the foreign-born population - Iran (%)
Place of birth for the foreign-born population - Kazakhstan (%)
Place of birth for the foreign-born population - Nepal (%)
Place of birth for the foreign-born population - Pakistan (%)
Place of birth for the foreign-born population - Sri Lanka (%)
Place of birth for the foreign-born population - Uzbekistan (%)
Place of birth for the foreign-born population - Other South Central Asia (%)
Place of birth for the foreign-born population - Burma (%)
Place of birth for the foreign-born population - Cambodia (%)
Place of birth for the foreign-born population - Indonesia (%)
Place of birth for the foreign-born population - Laos (%)
Place of birth for the foreign-born population - Malaysia (%)
Place of birth for the foreign-born population - Philippines (%)
Place of birth for the foreign-born population - Singapore (%)
Place of birth for the foreign-born population - Thailand (%)
Place of birth for the foreign-born population - Vietnam (%)
Place of birth for the foreign-born population - Other South Eastern Asia (%)
Place of birth for the foreign-born population - Armenia (%)
Place of birth for the foreign-born population - Iraq (%)
Place of birth for the foreign-born population - Israel (%)
Place of birth for the foreign-born population - Jordan (%)
Place of birth for the foreign-born population - Kuwait (%)
Place of birth for the foreign-born population - Lebanon (%)
Place of birth for the foreign-born population - Saudi Arabia (%)
Place of birth for the foreign-born population - Syria (%)
Place of birth for the foreign-born population - Turkey (%)
Place of birth for the foreign-born population - Yemen (%)
Place of birth for the foreign-born population - Other Western Asia (%)
Place of birth for the foreign-born population - Eritrea (%)
Place of birth for the foreign-born population - Ethiopia (%)
Place of birth for the foreign-born population - Kenya (%)
Place of birth for the foreign-born population - Somalia (%)
Place of birth for the foreign-born population - Uganda (%)
Place of birth for the foreign-born population - Zimbabwe (%)
Place of birth for the foreign-born population - Other Eastern Africa (%)
Place of birth for the foreign-born population - Cameroon (%)
Place of birth for the foreign-born population - Congo (%)
Place of birth for the foreign-born population - Democratic Republic of Congo (Zaire) (%)
Place of birth for the foreign-born population - Other Middle Africa (%)
Place of birth for the foreign-born population - Egypt (%)
Place of birth for the foreign-born population - Morocco (%)
Place of birth for the foreign-born population - Sudan (%)
Place of birth for the foreign-born population - Other Northern Africa (%)
Place of birth for the foreign-born population - South Africa (%)
Place of birth for the foreign-born population - Other Southern Africa (%)
Place of birth for the foreign-born population - Cabo Verde (%)
Place of birth for the foreign-born population - Ghana (%)
Place of birth for the foreign-born population - Liberia (%)
Place of birth for the foreign-born population - Nigeria (%)
Place of birth for the foreign-born population - Senegal (%)
Place of birth for the foreign-born population - Sierra Leone (%)
Place of birth for the foreign-born population - Other Western Africa (%)
Place of birth for the foreign-born population - Australia (%)
Place of birth for the foreign-born population - New Zealand (%)
Place of birth for the foreign-born population - Fiji (%)
Place of birth for the foreign-born population - Micronesia (%)
Place of birth for the foreign-born population - Bahamas (%)
Place of birth for the foreign-born population - Barbados (%)
Place of birth for the foreign-born population - Cuba (%)
Place of birth for the foreign-born population - Dominica (%)
Place of birth for the foreign-born population - Dominican Republic (%)
Place of birth for the foreign-born population - Grenada (%)
Place of birth for the foreign-born population - Haiti (%)
Place of birth for the foreign-born population - Jamaica (%)
Place of birth for the foreign-born population - St. Vincent and the Grenadines (%)
Place of birth for the foreign-born population - Trinidad and Tobago (%)
Place of birth for the foreign-born population - West Indies (%)
Place of birth for the foreign-born population - Other Caribbean (%)
Place of birth for the foreign-born population - Belize (%)
Place of birth for the foreign-born population - Costa Rica (%)
Place of birth for the foreign-born population - El Salvador (%)
Place of birth for the foreign-born population - Guatemala (%)
Place of birth for the foreign-born population - Honduras (%)
Place of birth for the foreign-born population - Mexico (%)
Place of birth for the foreign-born population - Nicaragua (%)
Place of birth for the foreign-born population - Panama (%)
Place of birth for the foreign-born population - Other Central America (%)
Place of birth for the foreign-born population - Argentina (%)
Place of birth for the foreign-born population - Bolivia (%)
Place of birth for the foreign-born population - Brazil (%)
Place of birth for the foreign-born population - Chile (%)
Place of birth for the foreign-born population - Colombia (%)
Place of birth for the foreign-born population - Ecuador (%)
Place of birth for the foreign-born population - Guyana (%)
Place of birth for the foreign-born population - Peru (%)
Place of birth for the foreign-born population - Uruguay (%)
Place of birth for the foreign-born population - Venezuela (%)
Place of birth for the foreign-born population - Other South America (%)
Place of birth for the foreign-born population - Canada (%)
Place of birth for the foreign-born population - Other Northern America (%)
Place of birth for the foreign-born population - Other (%)
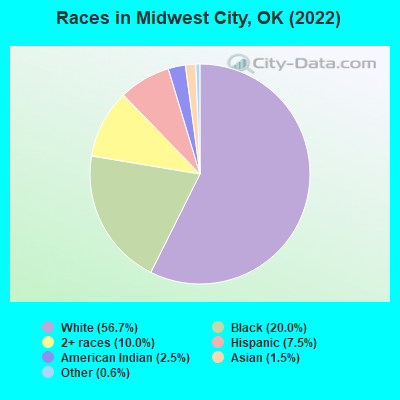
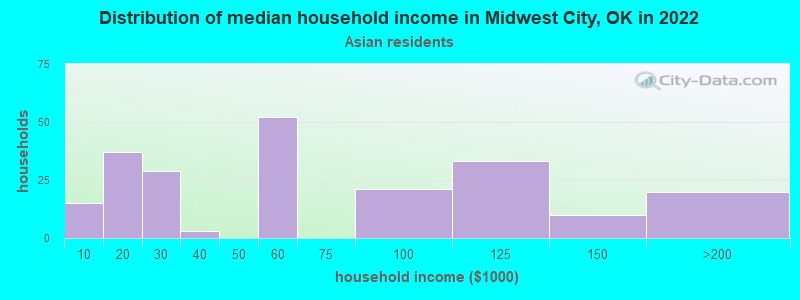
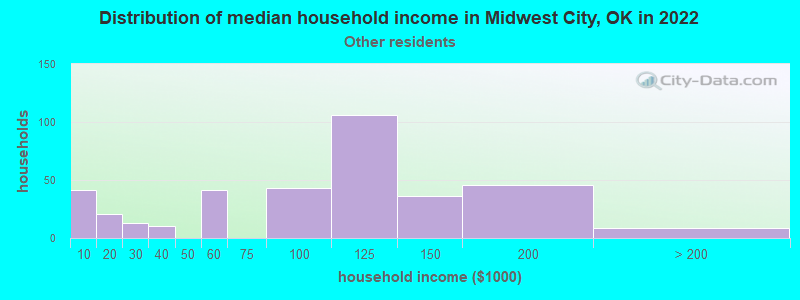
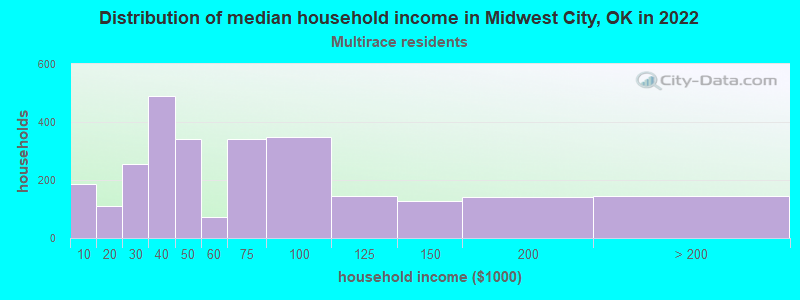
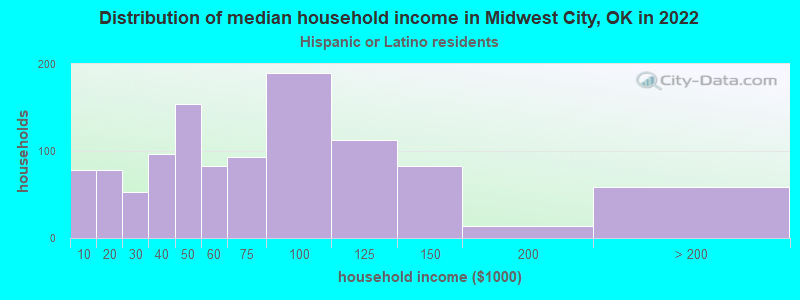
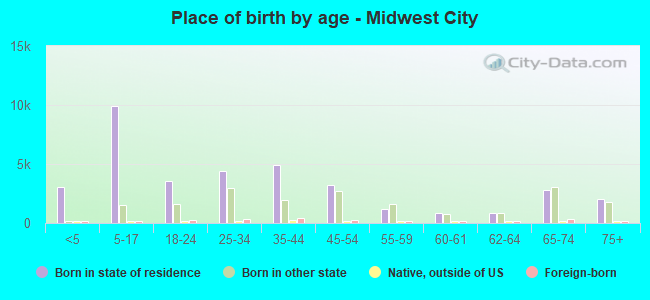
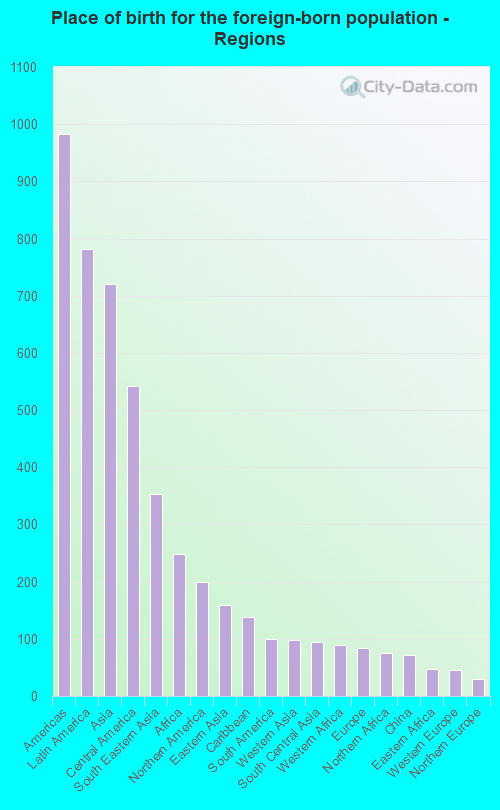
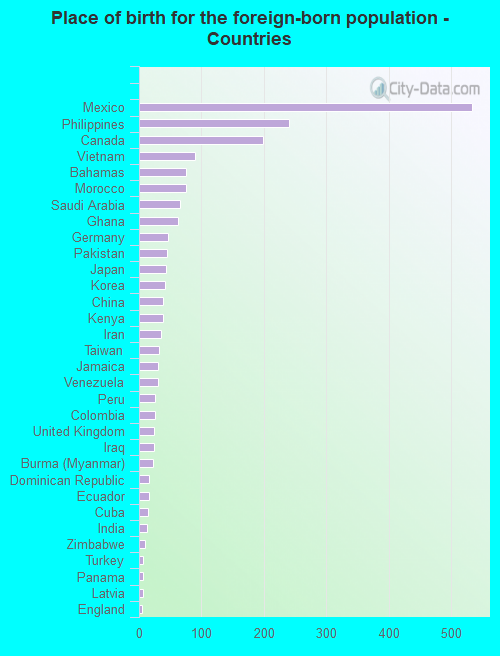
According to 2022 data, the most numerous races in Midwest City, OK are White alone (33,259 residents), Hispanic (4,393 residents), and Two or more races (5,834 residents). 94.0% of Midwest City residents speak English at home. 3.5% of Midwest City, OK residents are foreign-born (1.4% born in Latin America, 1.2% born in Asia, 0.4% born in Africa), which is 72.7% less than the foreign-born rate of 6.0% across the entire state of Oklahoma.
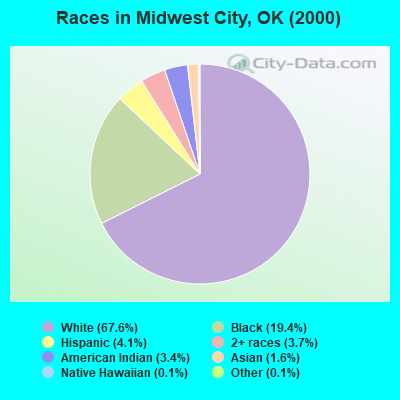
Race distribution in Midwest City
2000 2022
36,575 67.6% White alone 10,492 19.4% Black alone 2,192 4.1% Hispanic 2,005 3.7% Two or more races 1,812 3.4% American Indian alone 886 1.6% Asian alone 62 0.1% Other race alone 64 0.1% Native Hawaiian and Other
33,259 56.7% White alone 11,721 20.0% Black alone 5,834 10.0% Two or more races 4,393 7.5% Hispanic 1,455 2.5% American Indian alone 903 1.5% Asian alone 366 0.6% Other race alone 24 0.04% Native Hawaiian and Other
2000 2022
2,556,368 74.1% White alone 266,158 7.7% American Indian alone 257,981 7.5% Black alone 179,304 5.2% Hispanic 140,249 4.1% Two or more races 46,172 1.3% Asian alone 2,322 0.07% Other race alone 2,100 0.06% Native Hawaiian and Other
2,517,403 62.6% White alone 486,692 12.1% Hispanic 364,453 9.1% Two or more races 273,650 6.8% American Indian alone 268,543 6.7% Black alone 92,672 2.3% Asian alone 10,786 0.3% Other race alone 5,601 0.1% Native Hawaiian and Other
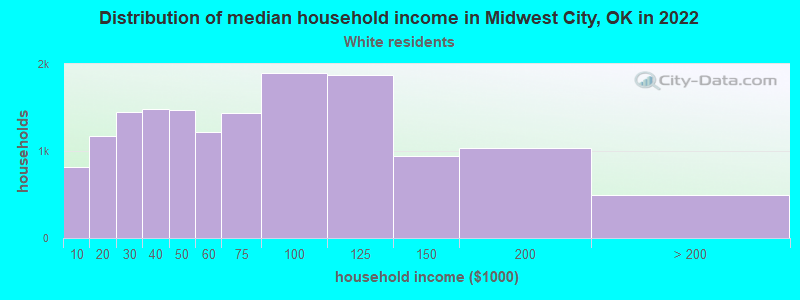
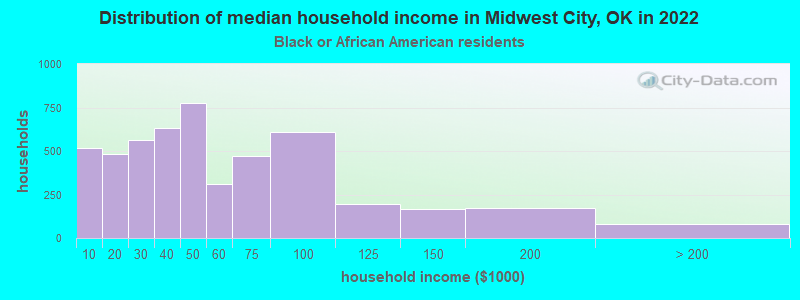
Income and house value in Midwest City Median household income in 2022 $59,799 White non-Hispanic householders$44,407 Black householders$61,409 American Indian and Alaska Native householders$63,738 Asian householders$93,112 Some other race householders$49,407 Two or more races householders$59,968 Hispanic or Latino race householdersMedian 2022 house value $177,952 White Non-Hispanic householders$164,158 Black or African American householders$149,259 American Indian or Alaska Native householders $226,510 Asian householders$360,596 Native Hawaiian and other Pacific Islander householders$159,467 Some other race householders$167,744 Two or more races householders$171,607 Hispanic or Latino householders
Median age by race in Midwest City
43.1 Median age for White residents41.7 44.7 34.9 Median age for Black or African American residents30.9 36.4 26.6 Median age for American Indian / Alaska Native residents24.3 28.3 39.6 Median age for Asian residents30.6 47.5 -725,225,224.5 Median age for Native Hawaiian / Pacific Islander residents-675,324,674.6 -767,251,461.2 27.8 Median age for Other race residents29.7 25.4 21.5 Median age for Two or more races residents22.0 21.7 43.1 Median age for White alone residents40.9 44.2 23.2 Median age for Hispanic or Latino residents23.8 22.8
Owner/renter occupied households by race in Midwest City
House owners and renters - White residents 10,003 65.3% Owner occupied5,316 34.7% Renter occupiedHouse owners and renters - Black or African American residents 1,714 34.5% Owner occupied3,252 65.5% Renter occupiedHouse owners and renters - American Indian / Alaska Native residents 207 34.9% Owner occupied385 65.1% Renter occupiedHouse owners and renters - Asian residents 98 38.4% Owner occupied158 61.6% Renter occupiedHouse owners and renters - Other race residents 167 51.0% Owner occupied160 49.0% Renter occupiedHouse owners and renters - Two or more races residents 1,231 45.1% Owner occupied1,499 54.9% Renter occupiedHouse owners and renters - White alone residents 10,133 65.1% Owner occupied5,433 34.9% Renter occupiedHouse owners and renters - Hispanic or Latino residents 515 48.2% Owner occupied555 51.8% Renter occupied
Language usage in Midwest City
English speakers - Total 94.0% of residents of Midwest City speak English at home.
3.5% of residents speak Spanish at home 1,317 68.2% Speak English very well615 31.8% Speak English less than very well2.3% of residents speak other language at home 959 76.3% Speak English very well298 23.7% Speak English less than very well
English speakers - Born in the United States 95.5% of residents of Midwest City speak English at home.
3.8% of residents speak Spanish at home 622 87.6% Speak English very well88 12.4% Speak English less than very well0.6% of residents speak other language at home 71 61.7% Speak English very well44 38.3% Speak English less than very well
English speakers - Native, born elsewhere 76.6% of residents of Midwest City speak English at home.
10.0% of residents speak Spanish at home 30 32.3% Speak English very well63 67.7% Speak English less than very well13.8% of residents speak other language at home 126 98.4% Speak English very well2 1.6% Speak English less than very well
English speakers - Foreign-born 30.5% of residents of Midwest City speak English at home.
31.7% of residents speak Spanish at home 271 42.0% Speak English very well374 58.0% Speak English less than very well36.6% of residents speak other language at home 509 68.4% Speak English very well235 31.6% Speak English less than very well
White (Caucasian) - Speak only English Native:
100.0% (31,635)Foreign-born:
100.0% (252)
White (Caucasian) - Speak another language Native:
1.3% (398)Foreign-born:
49.7% (125)
Black or African American - Speak only English Native:
98.6% (10,834)Foreign-born:
46.6% (124)
Black or African American - Speak another language Native:
1.4% (159)Foreign-born:
45.6% (121)
American Indian / Alaska Native - Speak only English Native:
91.2% (1,425)Foreign-born:
19.0% (3)
American Indian / Alaska Native - Speak another language Native:
7.0% (110)Foreign-born:
82.9% (13)
Asian - Speak only English Native:
63.8% (206)Foreign-born:
17.0% (95)
Asian - Speak another language Native:
36.7% (118)Foreign-born:
82.9% (463)
Other race - Speak only English Native:
61.1% (544)Foreign-born:
13.9% (60)
Other race - Speak another language Native:
34.6% (308)Foreign-born:
85.3% (367)
Two or more races - Speak another language Native:
10.0% (731)Foreign-born:
100.0% (362)
White alone - Speak only English Native:
98.7% (31,175)Foreign-born:
76.6% (267)
White alone - Speak another language Native:
1.1% (359)Foreign-born:
25.1% (87)
Hispanic or Latino - Speak only English Native:
70.0% (2,321)Foreign-born:
7.3% (51)
Hispanic or Latino - Speak another language Native:
30.4% (1,008)Foreign-born:
93.1% (650)
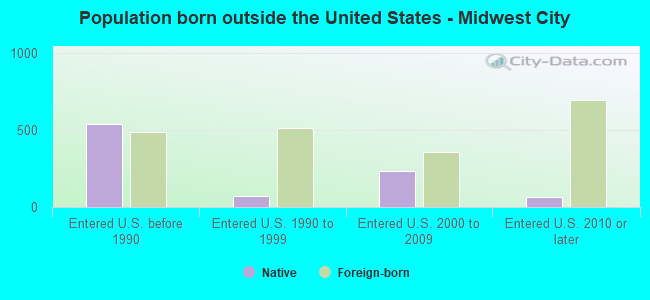
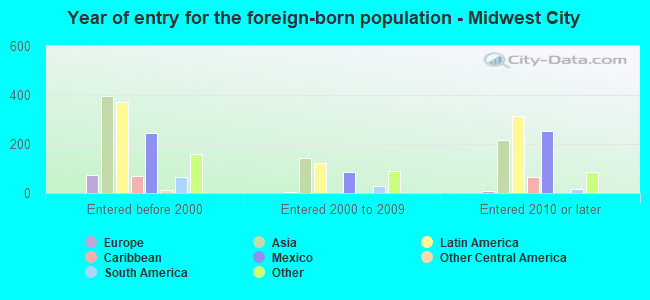
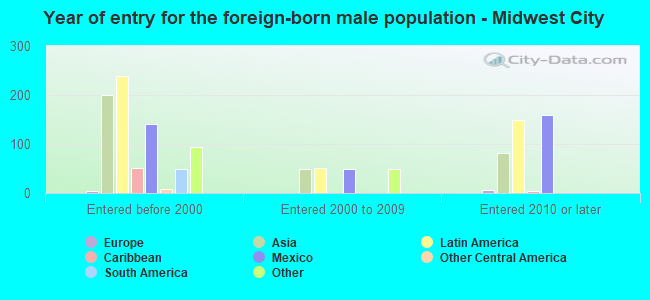
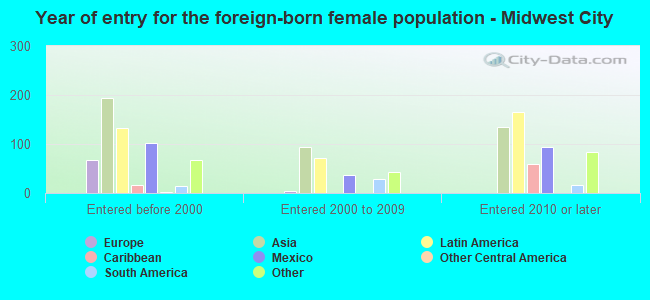
Foreign-born residents in Midwest City 2,036 residents are foreign born (1.4% Latin America , 1.2% Asia , 0.4% Africa ).
This city:
3.5%Oklahoma:
6.1%
Marital status for residents in Midwest City Marital status - White (Caucasian) population 15 years and over
Males 30.6% Never married50.0% Now married2.0% Separated3.6% Widowed13.8% DivorcedFemales 22.5% Never married42.8% Now married2.2% Separated12.3% Widowed20.2% DivorcedWomen who gave birth in the past 12 months Now married:
59.7% (262)Unmarried:
40.3% (177)
Women who did not give birth in the past 12 months Now married:
46.1% (3,114)Unmarried:
53.9% (3,644)
Marital status - Black or African American population 15 years and over
Males 43.1% Never married37.9% Now married2.7% Separated2.2% Widowed14.2% DivorcedFemales 43.0% Never married30.3% Now married6.2% Separated7.8% Widowed12.7% DivorcedWomen who gave birth in the past 12 months Now married:
45.3% (70)Unmarried:
54.7% (84)
Women who did not give birth in the past 12 months Now married:
34.4% (1,119)Unmarried:
65.6% (2,134)
Marital status - American Indian / Alaska Native population 15 years and over
Males 43.9% Never married44.9% Now married0.0% Separated2.6% Widowed8.6% DivorcedFemales 31.6% Never married45.3% Now married0.1% Separated5.3% Widowed17.7% DivorcedWomen who gave birth in the past 12 months Now married:
47.8% (12)Unmarried:
52.2% (14)
Women who did not give birth in the past 12 months Now married:
45.1% (222)Unmarried:
54.9% (271)
Marital status - Asian population 15 years and over
Males 56.9% Never married30.2% Now married0.0% Separated0.0% Widowed12.9% DivorcedFemales 18.0% Never married62.4% Now married0.0% Separated9.0% Widowed10.6% DivorcedWomen who gave birth in the past 12 months Now married:
100.0% (7)Unmarried:
0.0% (0)
Women who did not give birth in the past 12 months Now married:
50.2% (117)Unmarried:
49.8% (116)
Marital status - Other race population 15 years and over
Males 43.5% Never married46.7% Now married0.0% Separated3.7% Widowed6.1% DivorcedFemales 17.2% Never married60.8% Now married2.7% Separated2.5% Widowed16.9% DivorcedWomen who gave birth in the past 12 months Now married:
100.0% (13)Unmarried:
0.0% (0)
Women who did not give birth in the past 12 months Now married:
53.1% (132)Unmarried:
46.9% (117)
Marital status - Two or more races population 15 years and over
Males 52.9% Never married37.9% Now married2.2% Separated1.1% Widowed5.9% DivorcedFemales 39.8% Never married33.7% Now married6.8% Separated4.0% Widowed15.6% DivorcedWomen who gave birth in the past 12 months Now married:
54.1% (92)Unmarried:
45.9% (78)
Women who did not give birth in the past 12 months Now married:
36.7% (720)Unmarried:
63.3% (1,244)
Marital status - White alone, not Hispanic / Latino population 15 years and over
Males 30.5% Never married49.9% Now married2.0% Separated3.8% Widowed13.8% DivorcedFemales 21.7% Never married43.3% Now married2.1% Separated12.6% Widowed20.4% DivorcedWomen who gave birth in the past 12 months Now married:
63.1% (284)Unmarried:
36.9% (166)
Women who did not give birth in the past 12 months Now married:
46.7% (3,228)Unmarried:
53.3% (3,682)
Marital status - Hispanic or Latino population 15 years and over
Males 41.1% Never married48.9% Now married1.3% Separated0.0% Widowed8.7% DivorcedFemales 34.7% Never married43.2% Now married4.1% Separated5.3% Widowed12.6% DivorcedWomen who gave birth in the past 12 months Now married:
67.0% (66)Unmarried:
33.0% (32)
Women who did not give birth in the past 12 months Now married:
40.0% (374)Unmarried:
60.0% (560)
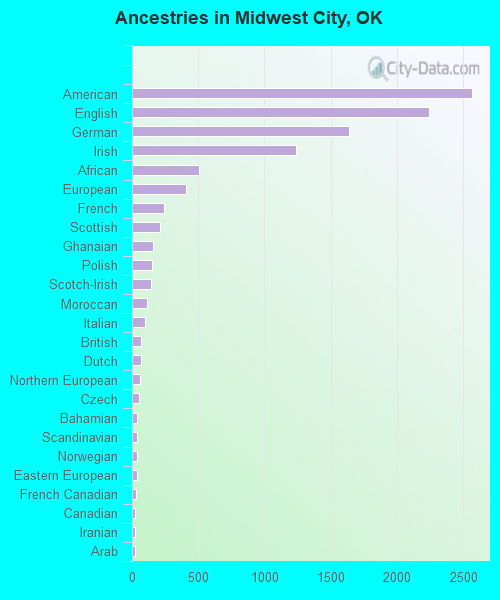
Ancestries in Midwest City
2,567 8.4% American2,239 7.3% English1,636 5.4% German1,239 4.1% Irish506 1.7% African407 1.3% European240 0.8% French213 0.7% Scottish155 0.5% Ghanaian154 0.5% Polish145 0.5% Scotch-Irish114 0.4% Moroccan96 0.3% Italian68 0.2% British66 0.2% Dutch59 0.2% Northern European54 0.2% Czech40 0.1% Bahamian37 0.1% Scandinavian34 0.1% Norwegian34 0.1% Eastern European33 0.1% French Canadian26 0.09% Canadian26 0.09% Iranian25 0.08% Arab22 0.07% Czechoslovakian16 0.05% Danish16 0.05% Lithuanian16 0.05% Portuguese14 0.05% Swedish13 0.04% Cape Verdean11 0.04% Belgian8 0.03% Nigerian7 0.02% Pennsylvania German6 0.02% Dutch West Indian5 0.02% Welsh4 0.01% Hungarian
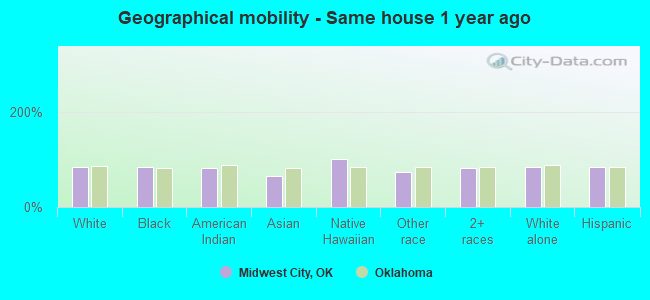
Geographical mobility in Midwest City Same house 1 year ago 26,968 84.2% White (Caucasian)9,850 83.2% Black or African American1,367 82.4% American Indian / Alaska Native594 66.0% Asian15 100.0% Native Hawaiian / Pacific Islander1,050 73.9% Other race7,471 80.8% Two or more races27,710 83.9% White alone, not Hispanic / Latino3,591 82.9% Hispanic or LatinoMoved within same county 2,926 9.1% White / Caucasian1,250 10.6% Black or African American230 13.9% American Indian / Alaska Native298 33.1% Asian236 16.6% Other race1,143 12.4% Two or more races3,184 9.6% White alone, not Hispanic / Latino420 9.7% Hispanic or LatinoMoved within same state 1,055 3.3% White / Caucasian190 1.6% Black or African American54 3.3% American Indian / Alaska Native18 2.0% Asian44 3.1% Other race383 4.1% Two or more races1,022 3.1% White alone, not Hispanic / Latino152 3.5% Hispanic or LatinoMoved from different state 918 2.9% White / Caucasian595 5.0% Black or African American168 1.8% Two or more races923 2.8% White alone, not Hispanic / Latino119 2.7% Hispanic or LatinoMoved from abroad 93 0.3% White60 0.5% Black or African American25 2.7% Asian143 0.4% White alone, not Hispanic / Latino27 0.6% Hispanic or Latino
Children Nativity (place of birth) in Midwest City
Children under 6 years - Living with two parents Both parents native 1,776 100.0% NativeBoth parents foreign-born 62 100.0% NativeOne native, one foreign-born parent 96 100.0% NativeChildren under 6 years - Living with one parent Native parent 1,813 99.6% Native8 0.4% Foreign-bornForeign-born parent 98 79.8% Native25 20.2% Foreign-bornChildren 6 to 17 years - Living with two parents Both parents native 5,087 99.9% Native6 0.1% Foreign-bornBoth parents foreign-born 114 87.6% Native16 12.4% Foreign-bornOne native, one foreign-born parent 210 98.8% Native3 1.2% Foreign-bornChildren 6 to 17 years - Living with one parent Native parent 4,312 100.0% NativeForeign-born parent 85 55.8% Native67 44.2% Foreign-born
Grandparents responsible for own grandchildren in Midwest City
Grandparents (30 to 59 years) White / Caucasian 104 38.1% Responsible for grandchildren169 61.9% Not responsible for grandchildrenBlack or African American 68 62.9% Responsible for grandchildren40 37.1% Not responsible for grandchildrenAmerican Indian / Alaska Native 5 24.1% Responsible for grandchildren15 75.9% Not responsible for grandchildrenOther race 9 100.0% Not responsible for grandchildrenTwo or more races 15 100.0% Not responsible for grandchildrenWhite alone, not Hispanic / Latino 126 35.6% Responsible for grandchildren227 64.4% Not responsible for grandchildrenHispanic or Latino 2 100.0% Not responsible for grandchildrenGrandparents (60 years and over) White / Caucasian 193 40.2% Responsible for grandchildren288 59.8% Not responsible for grandchildrenBlack or African American 60 54.5% Responsible for grandchildren50 45.5% Not responsible for grandchildrenAmerican Indian / Alaska Native 31 91.7% Responsible for grandchildren3 8.3% Not responsible for grandchildrenOther race 16 100.0% Not responsible for grandchildrenTwo or more races 17 57.9% Responsible for grandchildren13 42.1% Not responsible for grandchildrenWhite alone, not Hispanic / Latino 176 36.6% Responsible for grandchildren304 63.4% Not responsible for grandchildrenHispanic or Latino 15 43.4% Responsible for grandchildren19 56.6% Not responsible for grandchildren