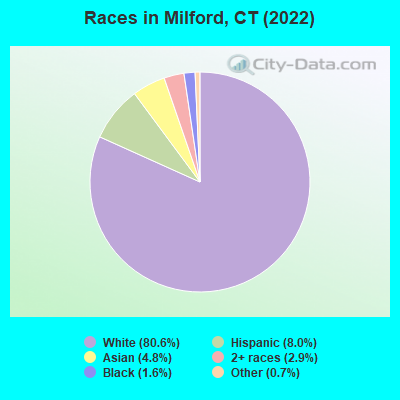
Races in Milford, Connecticut (CT) Detailed Stats
Data:
Races - White alone (%)
Races - White alone (% change since 2000)
Races - Black alone (%)
Races - Black alone (% change since 2000)
Races - American Indian alone (%)
Races - American Indian alone (% change since 2000)
Races - Asian alone (%)
Races - Asian alone (% change since 2000)
Races - Hispanic (%)
Races - Hispanic (% change since 2000)
Races - Native Hawaiian and Other Pacific Islander alone (%)
Races - Native Hawaiian and Other Pacific Islander alone (% change since 2000)
Races - Two or more races(%)
Races - Two or more races(% change since 2000)
Races - Other race alone (%)
Races - Other race alone (% change since 2000)
Racial diversity
Place of birth - Born in state of residence (%)
Place of birth - Born in state of residence (%) - White
Place of birth - Born in state of residence (%) - Black or African American
Place of birth - Born in state of residence (%) - Asian
Place of birth - Born in state of residence (%) - Hispanic or Latino
Place of birth - Born in state of residence (%) - American Indian and Alaska Native
Place of birth - Born in state of residence (%) - Multirace
Place of birth - Born in state of residence (%) - Other Race
Place of birth - Born in other state (%)
Place of birth - Born in other state (%) - White
Place of birth - Born in other state (%) - Black or African American
Place of birth - Born in other state (%) - Asian
Place of birth - Born in other state (%) - Hispanic or Latino
Place of birth - Born in other state (%) - American Indian and Alaska Native
Place of birth - Born in other state (%) - Multirace
Place of birth - Born in other state (%) - Other Race
Place of birth - Native, outside of US (%)
Place of birth - Native, outside of US (%) - White
Place of birth - Native, outside of US (%) - Black or African American
Place of birth - Native, outside of US (%) - Asian
Place of birth - Native, outside of US (%) - Hispanic or Latino
Place of birth - Native, outside of US (%) - American Indian and Alaska Native
Place of birth - Native, outside of US (%) - Multirace
Place of birth - Native, outside of US (%) - Other Race
Place of birth - Foreign born (%)
Place of birth - Foreign born (%) - White
Place of birth - Foreign born (%) - Black or African American
Place of birth - Foreign born (%) - Asian
Place of birth - Foreign born (%) - Hispanic or Latino
Place of birth - Foreign born (%) - American Indian and Alaska Native
Place of birth - Foreign born (%) - Multirace
Place of birth - Foreign born (%) - Other Race
Residents speaking English at home (%)
Residents speaking English at home - Born in the United States (%)
Residents speaking English at home - Native, born elsewhere (%)
Residents speaking English at home - Foreign born (%)
Residents speaking Spanish at home (%)
Residents speaking Spanish at home - Born in the United States (%)
Residents speaking Spanish at home - Native, born elsewhere (%)
Residents speaking Spanish at home - Foreign born (%)
Residents speaking other language at home (%)
Residents speaking other language at home - Born in the United States (%)
Residents speaking other language at home - Native, born elsewhere (%)
Residents speaking other language at home - Foreign born (%)
Marital status - Never married (%)
Marital status - Now married (%)
Marital status - Separated (%)
Marital status - Widowed (%)
Marital status - Divorced (%)
Ancestries Reported - Arab (%)
Ancestries Reported - Czech (%)
Ancestries Reported - Danish (%)
Ancestries Reported - Dutch (%)
Ancestries Reported - English (%)
Ancestries Reported - French (%)
Ancestries Reported - French Canadian (%)
Ancestries Reported - German (%)
Ancestries Reported - Greek (%)
Ancestries Reported - Hungarian (%)
Ancestries Reported - Irish (%)
Ancestries Reported - Italian (%)
Ancestries Reported - Lithuanian (%)
Ancestries Reported - Norwegian (%)
Ancestries Reported - Polish (%)
Ancestries Reported - Portuguese (%)
Ancestries Reported - Russian (%)
Ancestries Reported - Scotch-Irish (%)
Ancestries Reported - Scottish (%)
Ancestries Reported - Slovak (%)
Ancestries Reported - Subsaharan African (%)
Ancestries Reported - Swedish (%)
Ancestries Reported - Swiss (%)
Ancestries Reported - Ukrainian (%)
Ancestries Reported - United States (%)
Ancestries Reported - Welsh (%)
Ancestries Reported - West Indian (%)
Ancestries Reported - Other (%)
Geographical mobility - Same house 1 year ago (%)
Geographical mobility - Same house 1 year ago (%) - White
Geographical mobility - Same house 1 year ago (%) - Black or African American
Geographical mobility - Same house 1 year ago (%) - Asian
Geographical mobility - Same house 1 year ago (%) - Hispanic or Latino
Geographical mobility - Same house 1 year ago (%) - American Indian and Alaska Native
Geographical mobility - Same house 1 year ago (%) - Multirace
Geographical mobility - Same house 1 year ago (%) - Other Race
Geographical mobility - Moved within same county (%)
Geographical mobility - Moved within same county (%) - White
Geographical mobility - Moved within same county (%) - Black or African American
Geographical mobility - Moved within same county (%) - Asian
Geographical mobility - Moved within same county (%) - Hispanic or Latino
Geographical mobility - Moved within same county (%) - American Indian and Alaska Native
Geographical mobility - Moved within same county (%) - Multirace
Geographical mobility - Moved within same county (%) - Other Race
Geographical mobility - Moved from different county within same state (%)
Geographical mobility - Moved from different county within same state (%) - White
Geographical mobility - Moved from different county within same state (%) - Black or African American
Geographical mobility - Moved from different county within same state (%) - Asian
Geographical mobility - Moved from different county within same state (%) - Hispanic or Latino
Geographical mobility - Moved from different county within same state (%) - American Indian and Alaska Native
Geographical mobility - Moved from different county within same state (%) - Multirace
Geographical mobility - Moved from different county within same state (%) - Other Race
Geographical mobility - Moved from different state (%)
Geographical mobility - Moved from different state (%) - White
Geographical mobility - Moved from different state (%) - Black or African American
Geographical mobility - Moved from different state (%) - Asian
Geographical mobility - Moved from different state (%) - Hispanic or Latino
Geographical mobility - Moved from different state (%) - American Indian and Alaska Native
Geographical mobility - Moved from different state (%) - Multirace
Geographical mobility - Moved from different state (%) - Other Race
Geographical mobility - Moved from abroad (%)
Geographical mobility - Moved from abroad (%) - White
Geographical mobility - Moved from abroad (%) - Black or African American
Geographical mobility - Moved from abroad (%) - Asian
Geographical mobility - Moved from abroad (%) - Hispanic or Latino
Geographical mobility - Moved from abroad (%) - American Indian and Alaska Native
Geographical mobility - Moved from abroad (%) - Multirace
Geographical mobility - Moved from abroad (%) - Other Race
Place of birth for the foreign-born population - Ireland (%)
Place of birth for the foreign-born population - Denmark (%)
Place of birth for the foreign-born population - Norway (%)
Place of birth for the foreign-born population - Sweden (%)
Place of birth for the foreign-born population - United Kingdom (%)
Place of birth for the foreign-born population - England (%)
Place of birth for the foreign-born population - Scotland (%)
Place of birth for the foreign-born population - Other Northern Europe (%)
Place of birth for the foreign-born population - Austria (%)
Place of birth for the foreign-born population - Belgium (%)
Place of birth for the foreign-born population - France (%)
Place of birth for the foreign-born population - Germany (%)
Place of birth for the foreign-born population - Netherlands (%)
Place of birth for the foreign-born population - Switzerland (%)
Place of birth for the foreign-born population - Other Western Europe (%)
Place of birth for the foreign-born population - Greece (%)
Place of birth for the foreign-born population - Italy (%)
Place of birth for the foreign-born population - Portugal (%)
Place of birth for the foreign-born population - Spain (%)
Place of birth for the foreign-born population - Other Southern Europe (%)
Place of birth for the foreign-born population - Albania (%)
Place of birth for the foreign-born population - Belarus (%)
Place of birth for the foreign-born population - Bosnia and Herzegovina (%)
Place of birth for the foreign-born population - Bulgaria (%)
Place of birth for the foreign-born population - Croatia (%)
Place of birth for the foreign-born population - Czechoslovakia (%)
Place of birth for the foreign-born population - Hungary (%)
Place of birth for the foreign-born population - Latvia (%)
Place of birth for the foreign-born population - Lithuania (%)
Place of birth for the foreign-born population - North Macedonia (Macedonia) (%)
Place of birth for the foreign-born population - Moldova (%)
Place of birth for the foreign-born population - Poland (%)
Place of birth for the foreign-born population - Romania (%)
Place of birth for the foreign-born population - Russia (%)
Place of birth for the foreign-born population - Serbia (%)
Place of birth for the foreign-born population - Ukraine (%)
Place of birth for the foreign-born population - Other Eastern Europe (%)
Place of birth for the foreign-born population - China (%)
Place of birth for the foreign-born population - Hong Kong (%)
Place of birth for the foreign-born population - Taiwan (%)
Place of birth for the foreign-born population - Japan (%)
Place of birth for the foreign-born population - Korea (%)
Place of birth for the foreign-born population - Other Eastern Asia (%)
Place of birth for the foreign-born population - Afghanistan (%)
Place of birth for the foreign-born population - Bangladesh (%)
Place of birth for the foreign-born population - India (%)
Place of birth for the foreign-born population - Iran (%)
Place of birth for the foreign-born population - Kazakhstan (%)
Place of birth for the foreign-born population - Nepal (%)
Place of birth for the foreign-born population - Pakistan (%)
Place of birth for the foreign-born population - Sri Lanka (%)
Place of birth for the foreign-born population - Uzbekistan (%)
Place of birth for the foreign-born population - Other South Central Asia (%)
Place of birth for the foreign-born population - Burma (%)
Place of birth for the foreign-born population - Cambodia (%)
Place of birth for the foreign-born population - Indonesia (%)
Place of birth for the foreign-born population - Laos (%)
Place of birth for the foreign-born population - Malaysia (%)
Place of birth for the foreign-born population - Philippines (%)
Place of birth for the foreign-born population - Singapore (%)
Place of birth for the foreign-born population - Thailand (%)
Place of birth for the foreign-born population - Vietnam (%)
Place of birth for the foreign-born population - Other South Eastern Asia (%)
Place of birth for the foreign-born population - Armenia (%)
Place of birth for the foreign-born population - Iraq (%)
Place of birth for the foreign-born population - Israel (%)
Place of birth for the foreign-born population - Jordan (%)
Place of birth for the foreign-born population - Kuwait (%)
Place of birth for the foreign-born population - Lebanon (%)
Place of birth for the foreign-born population - Saudi Arabia (%)
Place of birth for the foreign-born population - Syria (%)
Place of birth for the foreign-born population - Turkey (%)
Place of birth for the foreign-born population - Yemen (%)
Place of birth for the foreign-born population - Other Western Asia (%)
Place of birth for the foreign-born population - Eritrea (%)
Place of birth for the foreign-born population - Ethiopia (%)
Place of birth for the foreign-born population - Kenya (%)
Place of birth for the foreign-born population - Somalia (%)
Place of birth for the foreign-born population - Uganda (%)
Place of birth for the foreign-born population - Zimbabwe (%)
Place of birth for the foreign-born population - Other Eastern Africa (%)
Place of birth for the foreign-born population - Cameroon (%)
Place of birth for the foreign-born population - Congo (%)
Place of birth for the foreign-born population - Democratic Republic of Congo (Zaire) (%)
Place of birth for the foreign-born population - Other Middle Africa (%)
Place of birth for the foreign-born population - Egypt (%)
Place of birth for the foreign-born population - Morocco (%)
Place of birth for the foreign-born population - Sudan (%)
Place of birth for the foreign-born population - Other Northern Africa (%)
Place of birth for the foreign-born population - South Africa (%)
Place of birth for the foreign-born population - Other Southern Africa (%)
Place of birth for the foreign-born population - Cabo Verde (%)
Place of birth for the foreign-born population - Ghana (%)
Place of birth for the foreign-born population - Liberia (%)
Place of birth for the foreign-born population - Nigeria (%)
Place of birth for the foreign-born population - Senegal (%)
Place of birth for the foreign-born population - Sierra Leone (%)
Place of birth for the foreign-born population - Other Western Africa (%)
Place of birth for the foreign-born population - Australia (%)
Place of birth for the foreign-born population - New Zealand (%)
Place of birth for the foreign-born population - Fiji (%)
Place of birth for the foreign-born population - Micronesia (%)
Place of birth for the foreign-born population - Bahamas (%)
Place of birth for the foreign-born population - Barbados (%)
Place of birth for the foreign-born population - Cuba (%)
Place of birth for the foreign-born population - Dominica (%)
Place of birth for the foreign-born population - Dominican Republic (%)
Place of birth for the foreign-born population - Grenada (%)
Place of birth for the foreign-born population - Haiti (%)
Place of birth for the foreign-born population - Jamaica (%)
Place of birth for the foreign-born population - St. Vincent and the Grenadines (%)
Place of birth for the foreign-born population - Trinidad and Tobago (%)
Place of birth for the foreign-born population - West Indies (%)
Place of birth for the foreign-born population - Other Caribbean (%)
Place of birth for the foreign-born population - Belize (%)
Place of birth for the foreign-born population - Costa Rica (%)
Place of birth for the foreign-born population - El Salvador (%)
Place of birth for the foreign-born population - Guatemala (%)
Place of birth for the foreign-born population - Honduras (%)
Place of birth for the foreign-born population - Mexico (%)
Place of birth for the foreign-born population - Nicaragua (%)
Place of birth for the foreign-born population - Panama (%)
Place of birth for the foreign-born population - Other Central America (%)
Place of birth for the foreign-born population - Argentina (%)
Place of birth for the foreign-born population - Bolivia (%)
Place of birth for the foreign-born population - Brazil (%)
Place of birth for the foreign-born population - Chile (%)
Place of birth for the foreign-born population - Colombia (%)
Place of birth for the foreign-born population - Ecuador (%)
Place of birth for the foreign-born population - Guyana (%)
Place of birth for the foreign-born population - Peru (%)
Place of birth for the foreign-born population - Uruguay (%)
Place of birth for the foreign-born population - Venezuela (%)
Place of birth for the foreign-born population - Other South America (%)
Place of birth for the foreign-born population - Canada (%)
Place of birth for the foreign-born population - Other Northern America (%)
Place of birth for the foreign-born population - Other (%)
Latest news about races in Milford, CT collected exclusively by city-data.com from local newspapers, TV, and radio stations
According to 2022 data, the most numerous races in Milford, CT are White alone (40,988 residents), Hispanic (4,095 residents), and Black alone (836 residents). 87.2% of Milford residents speak English at home. 10.1% of Milford, CT residents are foreign-born (4.0% born in Asia, 2.9% born in Europe, 2.3% born in Latin America), which is 48.1% less than the foreign-born rate of 15.0% across the entire state of Connecticut.
Race distribution in Milford
2000 2022
2,638,845 77.5% White alone 320,323 9.4% Hispanic 295,571 8.7% Black alone 81,564 2.4% Asian alone 52,896 1.6% Two or more races 8,141 0.2% Other race alone 7,267 0.2% American Indian alone 958 0.03% Native Hawaiian and Other
2,246,913 62.0% White alone 658,978 18.2% Hispanic 353,973 9.8% Black alone 172,929 4.8% Asian alone 159,631 4.4% Two or more races 29,761 0.8% Other race alone 3,428 0.09% American Indian alone 592 0.02% Native Hawaiian and Other
Income and house value in Milford Median household income in 2022 $100,303 White non-Hispanic householders$68,551 Black householders$143,198 Asian householders$96,578 Some other race householders$117,499 Two or more races householders$108,694 Hispanic or Latino race householdersMedian 2022 house value $394,260 White Non-Hispanic householders$407,839 Black or African American householders$207,197 American Indian or Alaska Native householders $468,242 Asian householders$385,363 Some other race householders$409,712 Two or more races householders$378,808 Hispanic or Latino householders
Median age by race in Milford
50.3 Median age for White residents47.4 52.3 36.8 Median age for Black or African American residents38.7 36.3 45.9 Median age for American Indian / Alaska Native residents47.7 -704,477,611.2 42.3 Median age for Asian residents47.0 41.2 -641,269,840.6 Median age for Native Hawaiian / Pacific Islander residents-414,239,481.8 -691,588,784.4 37.9 Median age for Other race residents37.1 38.9 22.7 Median age for Two or more races residents16.3 29.1 50.0 Median age for White alone residents46.9 52.2 31.5 Median age for Hispanic or Latino residents31.6 31.6
Owner/renter occupied households by race in Milford
House owners and renters - White residents 14,400 78.4% Owner occupied3,977 21.6% Renter occupiedHouse owners and renters - Black or African American residents 85 28.5% Owner occupied214 71.5% Renter occupiedHouse owners and renters - American Indian / Alaska Native residents 28 100.0% Owner occupiedHouse owners and renters - Asian residents 592 67.0% Owner occupied291 33.0% Renter occupiedHouse owners and renters - Other race residents 286 64.8% Owner occupied155 35.2% Renter occupiedHouse owners and renters - Two or more races residents 768 88.1% Owner occupied104 11.9% Renter occupiedHouse owners and renters - White alone residents 14,302 77.7% Owner occupied4,103 22.3% Renter occupiedHouse owners and renters - Hispanic or Latino residents 854 68.9% Owner occupied385 31.1% Renter occupied
Language usage in Milford
English speakers - Total 87.2% of residents of Milford speak English at home.
3.1% of residents speak Spanish at home 1,073 70.1% Speak English very well457 29.9% Speak English less than very well9.1% of residents speak other language at home 3,131 70.5% Speak English very well1,307 29.5% Speak English less than very well
English speakers - Born in the United States 93.8% of residents of Milford speak English at home.
1.7% of residents speak Spanish at home 183 90.1% Speak English very well20 9.9% Speak English less than very well3.6% of residents speak other language at home 385 91.7% Speak English very well35 8.3% Speak English less than very well
English speakers - Native, born elsewhere 70.9% of residents of Milford speak English at home.
29.5% of residents speak Spanish at home 120 45.1% Speak English very well146 54.9% Speak English less than very well5.5% of residents speak other language at home 50 100.0% Speak English very well
English speakers - Foreign-born 27.1% of residents of Milford speak English at home.
11.8% of residents speak Spanish at home 351 57.8% Speak English very well256 42.2% Speak English less than very well60.3% of residents speak other language at home 1,886 61.0% Speak English very well1,207 39.0% Speak English less than very well
White (Caucasian) - Speak only English Native:
98.4% (37,024)Foreign-born:
43.7% (788)
White (Caucasian) - Speak another language Native:
2.6% (980)Foreign-born:
58.6% (1,058)
Black or African American - Speak only English Native:
78.8% (494)Foreign-born:
29.0% (52)
Black or African American - Speak another language Native:
22.7% (142)Foreign-born:
61.8% (110)
American Indian / Alaska Native - Speak only English Native:
37.0% (8)Foreign-born:
28.1% (17)
American Indian / Alaska Native - Speak another language Native:
75.6% (16)Foreign-born:
73.2% (45)
Asian - Speak only English Native:
62.0% (452)Foreign-born:
13.4% (231)
Asian - Speak another language Native:
38.5% (281)Foreign-born:
86.7% (1,488)
Other race - Speak only English Native:
69.6% (497)Foreign-born:
25.8% (136)
Other race - Speak another language Native:
35.0% (250)Foreign-born:
70.5% (371)
Two or more races - Speak only English Native:
84.5% (2,419)Foreign-born:
6.0% (34)
Two or more races - Speak another language Native:
11.5% (330)Foreign-born:
96.1% (544)
White alone - Speak only English Native:
97.2% (36,635)Foreign-born:
40.6% (816)
White alone - Speak another language Native:
2.8% (1,055)Foreign-born:
59.6% (1,197)
Hispanic or Latino - Speak only English Native:
77.7% (2,280)Foreign-born:
18.7% (149)
Hispanic or Latino - Speak another language Native:
24.9% (730)Foreign-born:
78.6% (628)
Foreign-born residents in Milford 5,152 residents are foreign born (4.0% Asia , 2.9% Europe , 2.3% Latin America ).
This city:
10.1%Connecticut:
15.0%
Marital status for residents in Milford Marital status - White (Caucasian) population 15 years and over
Males 33.0% Never married54.6% Now married0.4% Separated2.3% Widowed9.6% DivorcedFemales 27.9% Never married48.2% Now married0.5% Separated10.5% Widowed12.9% DivorcedWomen who gave birth in the past 12 months Now married:
98.1% (291)Unmarried:
1.9% (6)
Women who did not give birth in the past 12 months Now married:
39.5% (3,139)Unmarried:
60.5% (4,816)
Marital status - Black or African American population 15 years and over
Males 43.1% Never married49.5% Now married0.0% Separated0.0% Widowed7.4% DivorcedFemales 51.8% Never married36.8% Now married3.1% Separated4.6% Widowed3.7% DivorcedWomen who did not give birth in the past 12 months Now married:
23.8% (68)Unmarried:
76.2% (217)
Marital status - American Indian / Alaska Native population 15 years and over
Males 26.5% Never married73.5% Now married0.0% Separated0.0% Widowed0.0% DivorcedFemales 0.0% Never married100.0% Now married0.0% Separated0.0% Widowed0.0% DivorcedWomen who did not give birth in the past 12 months Now married:
100.0% (21)Unmarried:
0.0% (0)
Marital status - Asian population 15 years and over
Males 18.5% Never married77.6% Now married0.0% Separated1.7% Widowed2.2% DivorcedFemales 23.4% Never married66.0% Now married0.0% Separated3.0% Widowed7.6% DivorcedWomen who gave birth in the past 12 months Now married:
100.0% (55)Unmarried:
0.0% (0)
Women who did not give birth in the past 12 months Now married:
59.6% (490)Unmarried:
40.4% (332)
Marital status - Other race population 15 years and over
Males 41.9% Never married46.3% Now married0.0% Separated0.0% Widowed11.8% DivorcedFemales 23.0% Never married69.0% Now married1.9% Separated0.8% Widowed5.3% DivorcedWomen who gave birth in the past 12 months Now married:
100.0% (27)Unmarried:
0.0% (0)
Women who did not give birth in the past 12 months Now married:
45.4% (85)Unmarried:
54.6% (102)
Marital status - Two or more races population 15 years and over
Males 49.0% Never married38.6% Now married0.0% Separated0.8% Widowed11.5% DivorcedFemales 52.4% Never married33.9% Now married0.0% Separated6.7% Widowed7.0% DivorcedWomen who gave birth in the past 12 months Now married:
100.0% (23)Unmarried:
0.0% (0)
Women who did not give birth in the past 12 months Now married:
28.8% (327)Unmarried:
71.2% (807)
Marital status - White alone, not Hispanic / Latino population 15 years and over
Males 32.7% Never married54.7% Now married0.5% Separated2.3% Widowed9.8% DivorcedFemales 27.5% Never married48.6% Now married0.5% Separated10.7% Widowed12.7% DivorcedWomen who gave birth in the past 12 months Now married:
98.1% (307)Unmarried:
1.9% (6)
Women who did not give birth in the past 12 months Now married:
40.2% (3,239)Unmarried:
59.8% (4,823)
Marital status - Hispanic or Latino population 15 years and over
Males 46.1% Never married42.3% Now married0.0% Separated0.7% Widowed10.8% DivorcedFemales 41.9% Never married41.0% Now married0.0% Separated5.6% Widowed11.5% DivorcedWomen who gave birth in the past 12 months Now married:
100.0% (34)Unmarried:
0.0% (0)
Women who did not give birth in the past 12 months Now married:
32.4% (344)Unmarried:
67.6% (718)
Ancestries in Milford
4,550 22.4% Italian2,137 10.5% Irish1,300 6.4% English1,155 5.7% German1,043 5.1% American702 3.5% Polish389 1.9% European387 1.9% French384 1.9% French Canadian308 1.5% Brazilian232 1.1% Eastern European224 1.1% Ukrainian217 1.1% Turkish197 1.0% Hungarian184 0.9% Russian179 0.9% Greek178 0.9% Scottish153 0.8% Portuguese132 0.6% Albanian132 0.6% Slovak129 0.6% Cape Verdean100 0.5% Swedish99 0.5% Norwegian76 0.4% Northern European75 0.4% Canadian70 0.3% Croatian70 0.3% Czech58 0.3% British53 0.3% Bulgarian44 0.2% Romanian40 0.2% Lebanese33 0.2% Austrian33 0.2% Arab29 0.1% Ethiopian28 0.1% Dutch24 0.1% Scandinavian23 0.1% Scotch-Irish23 0.1% Egyptian22 0.1% Czechoslovakian22 0.1% Armenian21 0.1% Finnish19 0.09% Ghanaian19 0.09% Jordanian18 0.09% Lithuanian18 0.09% Haitian15 0.07% West Indian14 0.07% Moroccan14 0.07% Swiss10 0.05% Slovene9 0.04% Jamaican8 0.04% Belgian8 0.04% Serbian8 0.04% Trinidadian and Tobagonian6 0.03% Syrian
Geographical mobility in Milford Same house 1 year ago 37,134 92.3% White (Caucasian)636 71.8% Black or African American69 94.8% American Indian / Alaska Native2,035 82.3% Asian1,088 85.7% Other race3,716 92.9% Two or more races37,606 92.4% White alone, not Hispanic / Latino3,513 87.5% Hispanic or LatinoMoved within same county 1,164 2.9% White / Caucasian132 14.9% Black or African American21 0.9% Asian41 3.2% Other race63 1.6% Two or more races1,200 2.9% White alone, not Hispanic / Latino119 3.0% Hispanic or LatinoMoved within same state 920 2.3% White / Caucasian27 3.0% Black or African American60 2.4% Asian80 6.3% Other race127 3.2% Two or more races866 2.1% White alone, not Hispanic / Latino277 6.9% Hispanic or LatinoMoved from different state 792 2.0% White / Caucasian89 10.0% Black or African American407 16.4% Asian14 1.1% Other race132 3.3% Two or more races757 1.9% White alone, not Hispanic / Latino117 2.9% Hispanic or LatinoMoved from abroad 106 0.3% White27 1.1% Asian114 0.3% White alone, not Hispanic / Latino
Children Nativity (place of birth) in Milford
Children under 6 years - Living with two parents Both parents native 1,571 100.0% NativeBoth parents foreign-born 188 93.6% Native13 6.4% Foreign-bornOne native, one foreign-born parent 369 100.0% NativeChildren under 6 years - Living with one parent Native parent 424 100.0% NativeForeign-born parent 55 68.7% Native25 31.3% Foreign-bornChildren 6 to 17 years - Living with two parents Both parents native 3,135 100.0% NativeBoth parents foreign-born 614 82.1% Native134 17.9% Foreign-bornOne native, one foreign-born parent 449 100.0% NativeChildren 6 to 17 years - Living with one parent Native parent 1,261 100.0% NativeForeign-born parent 117 52.7% Native105 47.3% Foreign-born
Grandparents responsible for own grandchildren in Milford
Grandparents (30 to 59 years) White / Caucasian 25 21.0% Responsible for grandchildren94 79.0% Not responsible for grandchildrenAsian 16 100.0% Responsible for grandchildrenOther race 18 100.0% Not responsible for grandchildrenTwo or more races 10 100.0% Responsible for grandchildrenWhite alone, not Hispanic / Latino 28 35.5% Responsible for grandchildren52 64.5% Not responsible for grandchildrenHispanic or Latino 5 6.2% Responsible for grandchildren77 93.8% Not responsible for grandchildrenGrandparents (60 years and over) White / Caucasian 30 9.7% Responsible for grandchildren276 90.3% Not responsible for grandchildrenAsian 57 51.8% Responsible for grandchildren53 48.2% Not responsible for grandchildrenTwo or more races 38 68.7% Responsible for grandchildren17 31.3% Not responsible for grandchildrenWhite alone, not Hispanic / Latino 31 10.1% Responsible for grandchildren277 89.9% Not responsible for grandchildrenHispanic or Latino 15 100.0% Not responsible for grandchildren