Races in Mill Creek, Washington (WA) Detailed Stats
Data:
Races - White alone (%)
Races - White alone (% change since 2000)
Races - Black alone (%)
Races - Black alone (% change since 2000)
Races - American Indian alone (%)
Races - American Indian alone (% change since 2000)
Races - Asian alone (%)
Races - Asian alone (% change since 2000)
Races - Hispanic (%)
Races - Hispanic (% change since 2000)
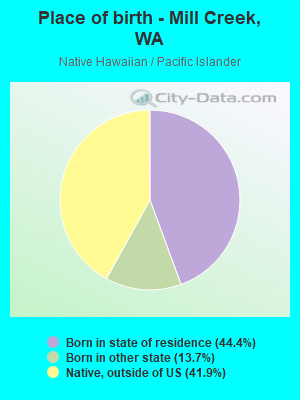
Races - Native Hawaiian and Other Pacific Islander alone (%)
Races - Native Hawaiian and Other Pacific Islander alone (% change since 2000)
Races - Two or more races(%)
Races - Two or more races(% change since 2000)
Races - Other race alone (%)
Races - Other race alone (% change since 2000)
Racial diversity
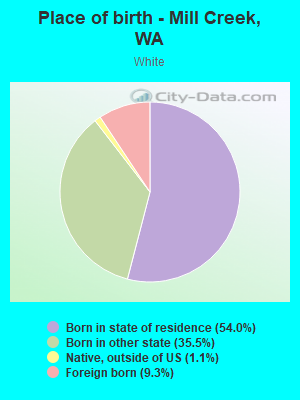
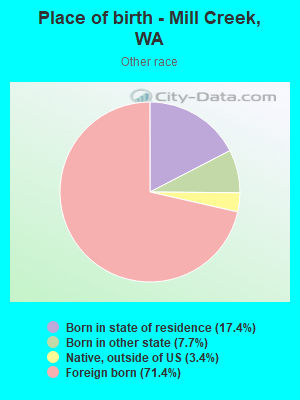
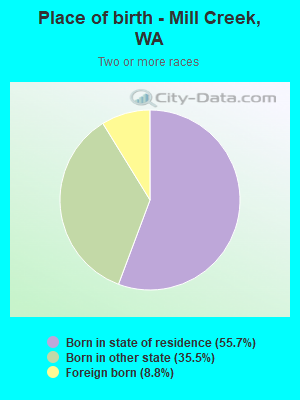
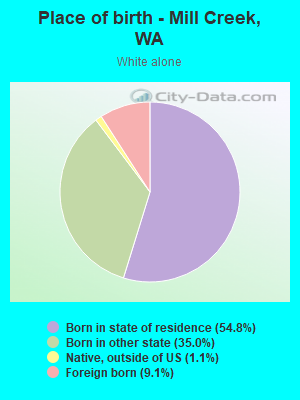
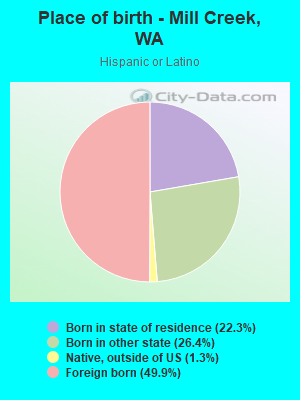
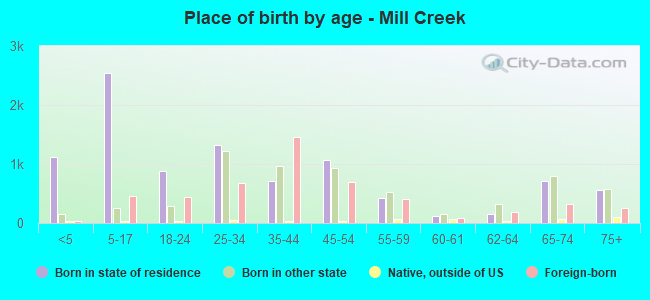
Place of birth - Born in state of residence (%)
Place of birth - Born in state of residence (%) - White
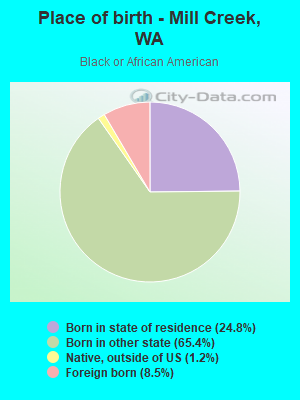
Place of birth - Born in state of residence (%) - Black or African American
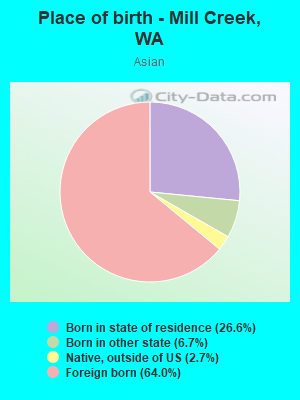
Place of birth - Born in state of residence (%) - Asian
Place of birth - Born in state of residence (%) - Hispanic or Latino
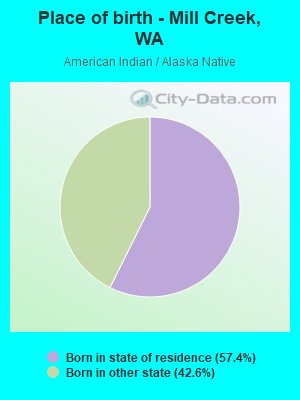
Place of birth - Born in state of residence (%) - American Indian and Alaska Native
Place of birth - Born in state of residence (%) - Multirace
Place of birth - Born in state of residence (%) - Other Race
Place of birth - Born in other state (%)
Place of birth - Born in other state (%) - White
Place of birth - Born in other state (%) - Black or African American
Place of birth - Born in other state (%) - Asian
Place of birth - Born in other state (%) - Hispanic or Latino
Place of birth - Born in other state (%) - American Indian and Alaska Native
Place of birth - Born in other state (%) - Multirace
Place of birth - Born in other state (%) - Other Race
Place of birth - Native, outside of US (%)
Place of birth - Native, outside of US (%) - White
Place of birth - Native, outside of US (%) - Black or African American
Place of birth - Native, outside of US (%) - Asian
Place of birth - Native, outside of US (%) - Hispanic or Latino
Place of birth - Native, outside of US (%) - American Indian and Alaska Native
Place of birth - Native, outside of US (%) - Multirace
Place of birth - Native, outside of US (%) - Other Race
Place of birth - Foreign born (%)
Place of birth - Foreign born (%) - White
Place of birth - Foreign born (%) - Black or African American
Place of birth - Foreign born (%) - Asian
Place of birth - Foreign born (%) - Hispanic or Latino
Place of birth - Foreign born (%) - American Indian and Alaska Native
Place of birth - Foreign born (%) - Multirace
Place of birth - Foreign born (%) - Other Race
Residents speaking English at home (%)
Residents speaking English at home - Born in the United States (%)
Residents speaking English at home - Native, born elsewhere (%)
Residents speaking English at home - Foreign born (%)
Residents speaking Spanish at home (%)
Residents speaking Spanish at home - Born in the United States (%)
Residents speaking Spanish at home - Native, born elsewhere (%)
Residents speaking Spanish at home - Foreign born (%)
Residents speaking other language at home (%)
Residents speaking other language at home - Born in the United States (%)
Residents speaking other language at home - Native, born elsewhere (%)
Residents speaking other language at home - Foreign born (%)
Marital status - Never married (%)
Marital status - Now married (%)
Marital status - Separated (%)
Marital status - Widowed (%)
Marital status - Divorced (%)
Ancestries Reported - Arab (%)
Ancestries Reported - Czech (%)
Ancestries Reported - Danish (%)
Ancestries Reported - Dutch (%)
Ancestries Reported - English (%)
Ancestries Reported - French (%)
Ancestries Reported - French Canadian (%)
Ancestries Reported - German (%)
Ancestries Reported - Greek (%)
Ancestries Reported - Hungarian (%)
Ancestries Reported - Irish (%)
Ancestries Reported - Italian (%)
Ancestries Reported - Lithuanian (%)
Ancestries Reported - Norwegian (%)
Ancestries Reported - Polish (%)
Ancestries Reported - Portuguese (%)
Ancestries Reported - Russian (%)
Ancestries Reported - Scotch-Irish (%)
Ancestries Reported - Scottish (%)
Ancestries Reported - Slovak (%)
Ancestries Reported - Subsaharan African (%)
Ancestries Reported - Swedish (%)
Ancestries Reported - Swiss (%)
Ancestries Reported - Ukrainian (%)
Ancestries Reported - United States (%)
Ancestries Reported - Welsh (%)
Ancestries Reported - West Indian (%)
Ancestries Reported - Other (%)
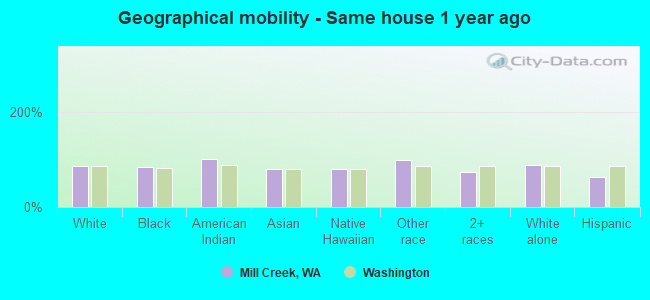
Geographical mobility - Same house 1 year ago (%)
Geographical mobility - Same house 1 year ago (%) - White
Geographical mobility - Same house 1 year ago (%) - Black or African American
Geographical mobility - Same house 1 year ago (%) - Asian
Geographical mobility - Same house 1 year ago (%) - Hispanic or Latino
Geographical mobility - Same house 1 year ago (%) - American Indian and Alaska Native
Geographical mobility - Same house 1 year ago (%) - Multirace
Geographical mobility - Same house 1 year ago (%) - Other Race
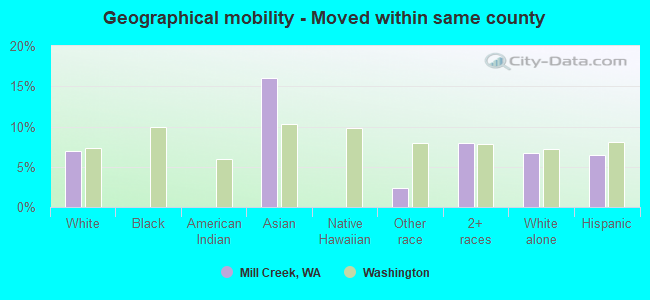
Geographical mobility - Moved within same county (%)
Geographical mobility - Moved within same county (%) - White
Geographical mobility - Moved within same county (%) - Black or African American
Geographical mobility - Moved within same county (%) - Asian
Geographical mobility - Moved within same county (%) - Hispanic or Latino
Geographical mobility - Moved within same county (%) - American Indian and Alaska Native
Geographical mobility - Moved within same county (%) - Multirace
Geographical mobility - Moved within same county (%) - Other Race
Geographical mobility - Moved from different county within same state (%)
Geographical mobility - Moved from different county within same state (%) - White
Geographical mobility - Moved from different county within same state (%) - Black or African American
Geographical mobility - Moved from different county within same state (%) - Asian
Geographical mobility - Moved from different county within same state (%) - Hispanic or Latino
Geographical mobility - Moved from different county within same state (%) - American Indian and Alaska Native
Geographical mobility - Moved from different county within same state (%) - Multirace
Geographical mobility - Moved from different county within same state (%) - Other Race
Geographical mobility - Moved from different state (%)
Geographical mobility - Moved from different state (%) - White
Geographical mobility - Moved from different state (%) - Black or African American
Geographical mobility - Moved from different state (%) - Asian
Geographical mobility - Moved from different state (%) - Hispanic or Latino
Geographical mobility - Moved from different state (%) - American Indian and Alaska Native
Geographical mobility - Moved from different state (%) - Multirace
Geographical mobility - Moved from different state (%) - Other Race
Geographical mobility - Moved from abroad (%)
Geographical mobility - Moved from abroad (%) - White
Geographical mobility - Moved from abroad (%) - Black or African American
Geographical mobility - Moved from abroad (%) - Asian
Geographical mobility - Moved from abroad (%) - Hispanic or Latino
Geographical mobility - Moved from abroad (%) - American Indian and Alaska Native
Geographical mobility - Moved from abroad (%) - Multirace
Geographical mobility - Moved from abroad (%) - Other Race
Place of birth for the foreign-born population - Ireland (%)
Place of birth for the foreign-born population - Denmark (%)
Place of birth for the foreign-born population - Norway (%)
Place of birth for the foreign-born population - Sweden (%)
Place of birth for the foreign-born population - United Kingdom (%)
Place of birth for the foreign-born population - England (%)
Place of birth for the foreign-born population - Scotland (%)
Place of birth for the foreign-born population - Other Northern Europe (%)
Place of birth for the foreign-born population - Austria (%)
Place of birth for the foreign-born population - Belgium (%)
Place of birth for the foreign-born population - France (%)
Place of birth for the foreign-born population - Germany (%)
Place of birth for the foreign-born population - Netherlands (%)
Place of birth for the foreign-born population - Switzerland (%)
Place of birth for the foreign-born population - Other Western Europe (%)
Place of birth for the foreign-born population - Greece (%)
Place of birth for the foreign-born population - Italy (%)
Place of birth for the foreign-born population - Portugal (%)
Place of birth for the foreign-born population - Spain (%)
Place of birth for the foreign-born population - Other Southern Europe (%)
Place of birth for the foreign-born population - Albania (%)
Place of birth for the foreign-born population - Belarus (%)
Place of birth for the foreign-born population - Bosnia and Herzegovina (%)
Place of birth for the foreign-born population - Bulgaria (%)
Place of birth for the foreign-born population - Croatia (%)
Place of birth for the foreign-born population - Czechoslovakia (%)
Place of birth for the foreign-born population - Hungary (%)
Place of birth for the foreign-born population - Latvia (%)
Place of birth for the foreign-born population - Lithuania (%)
Place of birth for the foreign-born population - North Macedonia (Macedonia) (%)
Place of birth for the foreign-born population - Moldova (%)
Place of birth for the foreign-born population - Poland (%)
Place of birth for the foreign-born population - Romania (%)
Place of birth for the foreign-born population - Russia (%)
Place of birth for the foreign-born population - Serbia (%)
Place of birth for the foreign-born population - Ukraine (%)
Place of birth for the foreign-born population - Other Eastern Europe (%)
Place of birth for the foreign-born population - China (%)
Place of birth for the foreign-born population - Hong Kong (%)
Place of birth for the foreign-born population - Taiwan (%)
Place of birth for the foreign-born population - Japan (%)
Place of birth for the foreign-born population - Korea (%)
Place of birth for the foreign-born population - Other Eastern Asia (%)
Place of birth for the foreign-born population - Afghanistan (%)
Place of birth for the foreign-born population - Bangladesh (%)
Place of birth for the foreign-born population - India (%)
Place of birth for the foreign-born population - Iran (%)
Place of birth for the foreign-born population - Kazakhstan (%)
Place of birth for the foreign-born population - Nepal (%)
Place of birth for the foreign-born population - Pakistan (%)
Place of birth for the foreign-born population - Sri Lanka (%)
Place of birth for the foreign-born population - Uzbekistan (%)
Place of birth for the foreign-born population - Other South Central Asia (%)
Place of birth for the foreign-born population - Burma (%)
Place of birth for the foreign-born population - Cambodia (%)
Place of birth for the foreign-born population - Indonesia (%)
Place of birth for the foreign-born population - Laos (%)
Place of birth for the foreign-born population - Malaysia (%)
Place of birth for the foreign-born population - Philippines (%)
Place of birth for the foreign-born population - Singapore (%)
Place of birth for the foreign-born population - Thailand (%)
Place of birth for the foreign-born population - Vietnam (%)
Place of birth for the foreign-born population - Other South Eastern Asia (%)
Place of birth for the foreign-born population - Armenia (%)
Place of birth for the foreign-born population - Iraq (%)
Place of birth for the foreign-born population - Israel (%)
Place of birth for the foreign-born population - Jordan (%)
Place of birth for the foreign-born population - Kuwait (%)
Place of birth for the foreign-born population - Lebanon (%)
Place of birth for the foreign-born population - Saudi Arabia (%)
Place of birth for the foreign-born population - Syria (%)
Place of birth for the foreign-born population - Turkey (%)
Place of birth for the foreign-born population - Yemen (%)
Place of birth for the foreign-born population - Other Western Asia (%)
Place of birth for the foreign-born population - Eritrea (%)
Place of birth for the foreign-born population - Ethiopia (%)
Place of birth for the foreign-born population - Kenya (%)
Place of birth for the foreign-born population - Somalia (%)
Place of birth for the foreign-born population - Uganda (%)
Place of birth for the foreign-born population - Zimbabwe (%)
Place of birth for the foreign-born population - Other Eastern Africa (%)
Place of birth for the foreign-born population - Cameroon (%)
Place of birth for the foreign-born population - Congo (%)
Place of birth for the foreign-born population - Democratic Republic of Congo (Zaire) (%)
Place of birth for the foreign-born population - Other Middle Africa (%)
Place of birth for the foreign-born population - Egypt (%)
Place of birth for the foreign-born population - Morocco (%)
Place of birth for the foreign-born population - Sudan (%)
Place of birth for the foreign-born population - Other Northern Africa (%)
Place of birth for the foreign-born population - South Africa (%)
Place of birth for the foreign-born population - Other Southern Africa (%)
Place of birth for the foreign-born population - Cabo Verde (%)
Place of birth for the foreign-born population - Ghana (%)
Place of birth for the foreign-born population - Liberia (%)
Place of birth for the foreign-born population - Nigeria (%)
Place of birth for the foreign-born population - Senegal (%)
Place of birth for the foreign-born population - Sierra Leone (%)
Place of birth for the foreign-born population - Other Western Africa (%)
Place of birth for the foreign-born population - Australia (%)
Place of birth for the foreign-born population - New Zealand (%)
Place of birth for the foreign-born population - Fiji (%)
Place of birth for the foreign-born population - Micronesia (%)
Place of birth for the foreign-born population - Bahamas (%)
Place of birth for the foreign-born population - Barbados (%)
Place of birth for the foreign-born population - Cuba (%)
Place of birth for the foreign-born population - Dominica (%)
Place of birth for the foreign-born population - Dominican Republic (%)
Place of birth for the foreign-born population - Grenada (%)
Place of birth for the foreign-born population - Haiti (%)
Place of birth for the foreign-born population - Jamaica (%)
Place of birth for the foreign-born population - St. Vincent and the Grenadines (%)
Place of birth for the foreign-born population - Trinidad and Tobago (%)
Place of birth for the foreign-born population - West Indies (%)
Place of birth for the foreign-born population - Other Caribbean (%)
Place of birth for the foreign-born population - Belize (%)
Place of birth for the foreign-born population - Costa Rica (%)
Place of birth for the foreign-born population - El Salvador (%)
Place of birth for the foreign-born population - Guatemala (%)
Place of birth for the foreign-born population - Honduras (%)
Place of birth for the foreign-born population - Mexico (%)
Place of birth for the foreign-born population - Nicaragua (%)
Place of birth for the foreign-born population - Panama (%)
Place of birth for the foreign-born population - Other Central America (%)
Place of birth for the foreign-born population - Argentina (%)
Place of birth for the foreign-born population - Bolivia (%)
Place of birth for the foreign-born population - Brazil (%)
Place of birth for the foreign-born population - Chile (%)
Place of birth for the foreign-born population - Colombia (%)
Place of birth for the foreign-born population - Ecuador (%)
Place of birth for the foreign-born population - Guyana (%)
Place of birth for the foreign-born population - Peru (%)
Place of birth for the foreign-born population - Uruguay (%)
Place of birth for the foreign-born population - Venezuela (%)
Place of birth for the foreign-born population - Other South America (%)
Place of birth for the foreign-born population - Canada (%)
Place of birth for the foreign-born population - Other Northern America (%)
Place of birth for the foreign-born population - Other (%)
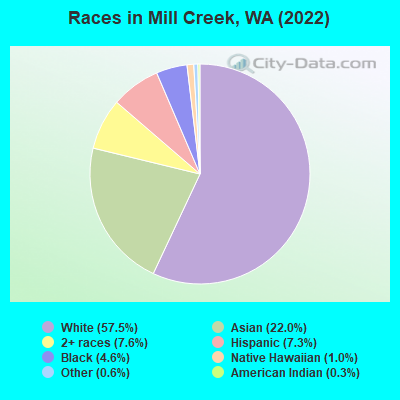
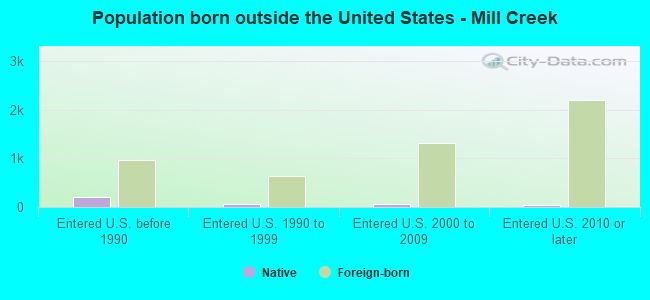
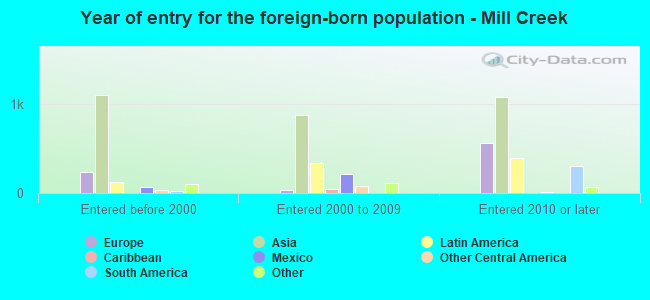
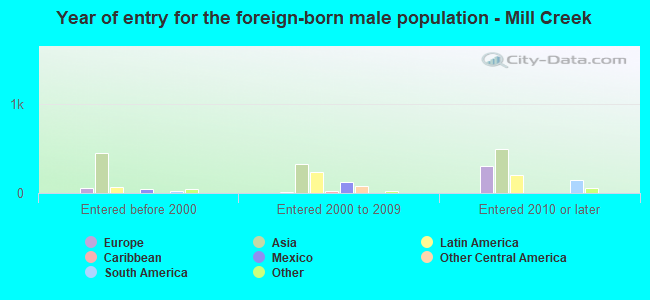
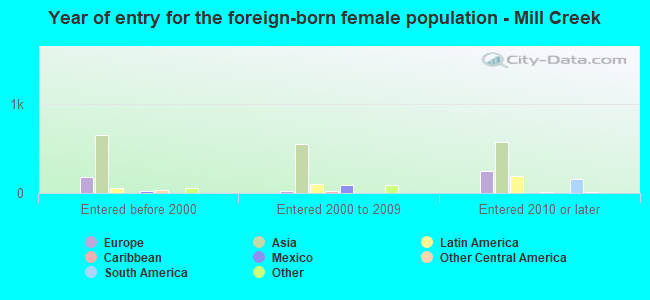
According to 2022 data, the most numerous races in Mill Creek, WA are White alone (12,120 residents), Hispanic (1,542 residents), and Asian alone (4,641 residents). 74.8% of Mill Creek residents speak English at home. 23.7% of Mill Creek, WA residents are foreign-born (13.9% born in Asia, 4.1% born in Latin America, 3.8% born in Europe), which is 36.6% greater than the foreign-born rate of 15.0% across the entire state of Washington.
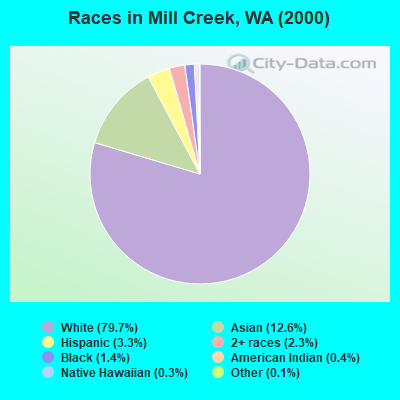
Race distribution in Mill Creek
2000 2022
4,652,490 78.9% White alone 441,509 7.5% Hispanic 319,401 5.4% Asian alone 184,631 3.1% Black alone 175,926 3.0% Two or more races 85,396 1.4% American Indian alone 22,779 0.4% Native Hawaiian and Other 11,989 0.2% Other race alone
4,941,456 63.5% White alone 1,093,313 14.0% Hispanic 755,832 9.7% Asian alone 523,448 6.7% Two or more races 299,537 3.8% Black alone 69,024 0.9% American Indian alone 52,231 0.7% Native Hawaiian and Other 50,945 0.7% Other race alone
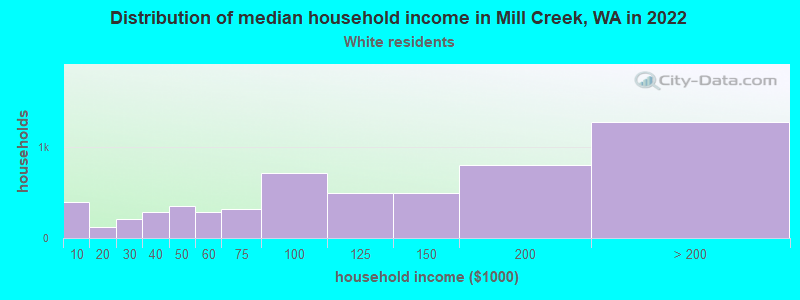
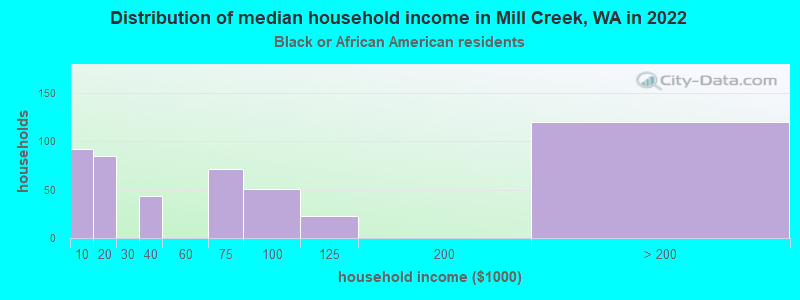
Income and house value in Mill Creek Median household income in 2022 $106,416 White non-Hispanic householders$70,127 Black householders$174,113 Asian householders$109,480 Some other race householders$145,320 Two or more races householders$107,241 Hispanic or Latino race householdersMedian 2022 house value $929,415 White Non-Hispanic householdersover $1,000,000 Black or African American householders$746,310 American Indian or Alaska Native householders over $1,000,000 Asian householdersover $1,000,000 Some other race householdersover $1,000,000 Two or more races householdersover $1,000,000 Hispanic or Latino householders
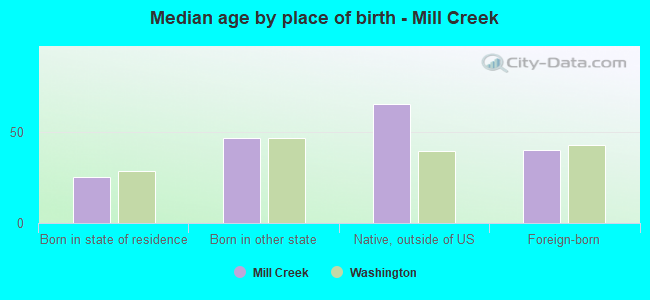
Median age by race in Mill Creek
44.3 Median age for White residents41.5 47.4 27.1 Median age for Black or African American residents25.6 38.7 61.0 Median age for American Indian / Alaska Native residents69.7 46.9 37.4 Median age for Asian residents39.8 33.4 28.2 Median age for Native Hawaiian / Pacific Islander residents27.2 -844,317,095.6 32.5 Median age for Other race residents32.6 29.6 23.0 Median age for Two or more races residents23.8 24.2 44.9 Median age for White alone residents41.8 47.1 31.2 Median age for Hispanic or Latino residents34.9 28.7
Owner/renter occupied households by race in Mill Creek
House owners and renters - White residents 3,456 60.1% Owner occupied2,295 39.9% Renter occupiedHouse owners and renters - Black or African American residents 116 21.8% Owner occupied415 78.2% Renter occupiedHouse owners and renters - American Indian / Alaska Native residents 39 100.0% Owner occupiedHouse owners and renters - Asian residents 1,249 81.0% Owner occupied292 19.0% Renter occupiedHouse owners and renters - Native Hawaiian / Pacific Islander residents 32 42.1% Owner occupied44 57.9% Renter occupiedHouse owners and renters - Other race residents 107 32.6% Owner occupied222 67.4% Renter occupiedHouse owners and renters - Two or more races residents 217 56.7% Owner occupied166 43.3% Renter occupiedHouse owners and renters - White alone residents 3,454 61.6% Owner occupied2,150 38.4% Renter occupiedHouse owners and renters - Hispanic or Latino residents 133 23.1% Owner occupied444 76.9% Renter occupied
Language usage in Mill Creek
English speakers - Total 74.8% of residents of Mill Creek speak English at home.
5.1% of residents speak Spanish at home 718 70.7% Speak English very well297 29.3% Speak English less than very well20.0% of residents speak other language at home 2,799 70.5% Speak English very well1,169 29.5% Speak English less than very well
English speakers - Born in the United States 94.6% of residents of Mill Creek speak English at home.
1.6% of residents speak Spanish at home 94 100.0% Speak English very well3.6% of residents speak other language at home 219 100.0% Speak English very well
English speakers - Native, born elsewhere 42.0% of residents of Mill Creek speak English at home.
2.4% of residents speak Spanish at home 9 100.0% Speak English very well55.1% of residents speak other language at home 163 79.1% Speak English very well43 20.9% Speak English less than very well
English speakers - Foreign-born 29.5% of residents of Mill Creek speak English at home.
13.2% of residents speak Spanish at home 386 58.2% Speak English very well277 41.8% Speak English less than very well59.1% of residents speak other language at home 1,937 65.4% Speak English very well1,025 34.6% Speak English less than very well
White (Caucasian) - Speak only English Native:
96.7% (10,296)Foreign-born:
59.2% (679)
White (Caucasian) - Speak another language Native:
3.3% (352)Foreign-born:
42.5% (487)
Black or African American - Speak another language Native:
5.7% (48)Foreign-born:
82.3% (73)
Asian - Speak only English Native:
44.4% (538)Foreign-born:
15.2% (449)
Asian - Speak another language Native:
55.8% (676)Foreign-born:
85.0% (2,505)
Other race - Speak only English Native:
64.2% (114)Foreign-born:
32.3% (191)
Other race - Speak another language Native:
31.0% (55)Foreign-born:
75.6% (446)
Two or more races - Speak only English Native:
91.8% (1,516)Foreign-born:
3.4% (6)
Two or more races - Speak another language Native:
8.4% (139)Foreign-born:
93.3% (171)
White alone - Speak only English Native:
96.3% (10,097)Foreign-born:
62.2% (684)
White alone - Speak another language Native:
3.7% (384)Foreign-born:
33.7% (371)
Hispanic or Latino - Speak only English Native:
76.2% (564)Foreign-born:
13.7% (105)
Hispanic or Latino - Speak another language Native:
26.1% (193)Foreign-born:
86.6% (660)
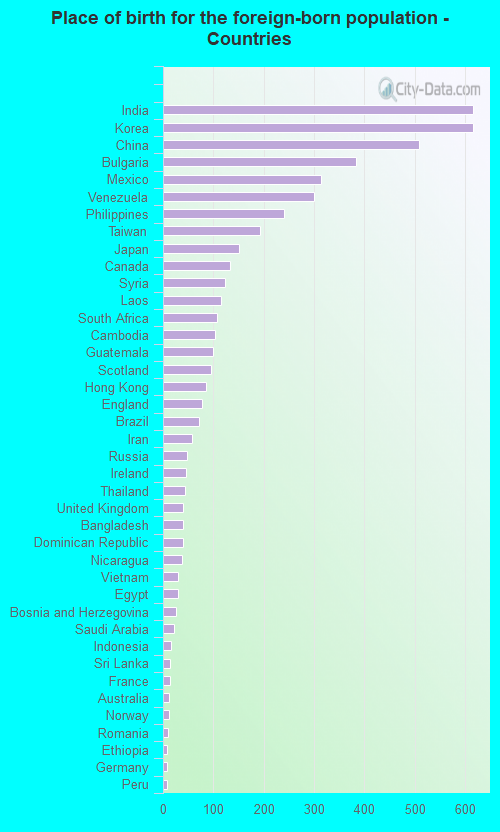
Foreign-born residents in Mill Creek 4,993 residents are foreign born (13.9% Asia , 4.1% Latin America , 3.8% Europe ).
This city:
23.7%Washington:
14.9%
Marital status for residents in Mill Creek Marital status - White (Caucasian) population 15 years and over
Males 25.0% Never married65.8% Now married0.0% Separated0.9% Widowed8.3% DivorcedFemales 25.3% Never married51.1% Now married1.3% Separated8.5% Widowed13.8% DivorcedWomen who gave birth in the past 12 months Now married:
88.4% (157)Unmarried:
11.6% (21)
Women who did not give birth in the past 12 months Now married:
47.2% (1,320)Unmarried:
52.8% (1,477)
Marital status - Black or African American population 15 years and over
Males 35.7% Never married64.3% Now married0.0% Separated0.0% Widowed0.0% DivorcedFemales 28.6% Never married23.9% Now married0.0% Separated0.0% Widowed47.4% DivorcedWomen who gave birth in the past 12 months Now married:
9.4% (9)Unmarried:
90.6% (88)
Women who did not give birth in the past 12 months Now married:
77.4% (55)Unmarried:
22.6% (16)
Marital status - American Indian / Alaska Native population 15 years and over
Males 0.0% Never married100.0% Now married0.0% Separated0.0% Widowed0.0% DivorcedFemales 0.0% Never married100.0% Now married0.0% Separated0.0% Widowed0.0% DivorcedWomen who did not give birth in the past 12 months Now married:
100.0% (13)Unmarried:
0.0% (0)
Marital status - Asian population 15 years and over
Males 26.4% Never married72.0% Now married0.0% Separated0.6% Widowed1.0% DivorcedFemales 19.9% Never married65.5% Now married0.0% Separated3.6% Widowed11.0% DivorcedWomen who gave birth in the past 12 months Now married:
100.0% (114)Unmarried:
0.0% (0)
Women who did not give birth in the past 12 months Now married:
66.6% (722)Unmarried:
33.4% (362)
Marital status - Native Hawaiian / Pacific Islander population 15 years and over
Males 47.9% Never married52.1% Now married0.0% Separated0.0% Widowed0.0% DivorcedFemales 0.0% Never married100.0% Now married0.0% Separated0.0% Widowed0.0% DivorcedMarital status - Other race population 15 years and over
Males 35.4% Never married28.0% Now married0.0% Separated0.0% Widowed36.6% DivorcedFemales 57.5% Never married36.3% Now married0.0% Separated6.1% Widowed0.0% DivorcedWomen who gave birth in the past 12 months Now married:
100.0% (34)Unmarried:
0.0% (0)
Women who did not give birth in the past 12 months Now married:
30.3% (75)Unmarried:
69.7% (172)
Marital status - Two or more races population 15 years and over
Males 51.5% Never married46.3% Now married0.0% Separated0.0% Widowed2.2% DivorcedFemales 30.6% Never married60.7% Now married3.7% Separated0.0% Widowed5.0% DivorcedWomen who did not give birth in the past 12 months Now married:
63.0% (295)Unmarried:
37.0% (173)
Marital status - White alone, not Hispanic / Latino population 15 years and over
Males 24.5% Never married66.2% Now married0.0% Separated0.9% Widowed8.3% DivorcedFemales 22.9% Never married53.2% Now married1.4% Separated8.3% Widowed14.2% DivorcedWomen who gave birth in the past 12 months Now married:
92.8% (160)Unmarried:
7.2% (12)
Women who did not give birth in the past 12 months Now married:
51.2% (1,343)Unmarried:
48.8% (1,282)
Marital status - Hispanic or Latino population 15 years and over
Males 27.3% Never married49.3% Now married0.0% Separated0.0% Widowed23.4% DivorcedFemales 57.9% Never married28.1% Now married0.0% Separated8.0% Widowed5.9% DivorcedWomen who gave birth in the past 12 months Now married:
72.7% (26)Unmarried:
27.3% (10)
Women who did not give birth in the past 12 months Now married:
20.7% (105)Unmarried:
79.3% (403)
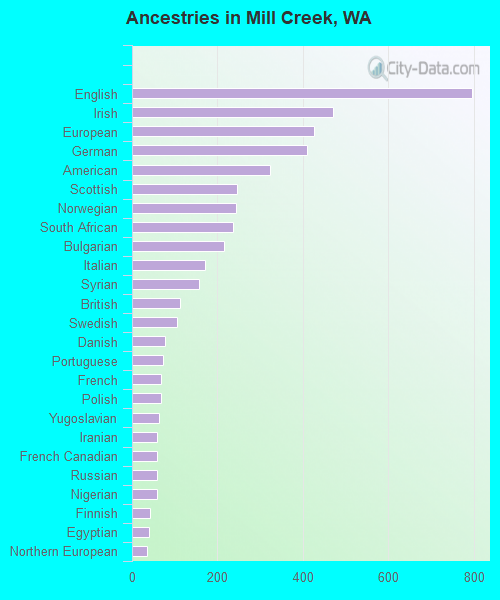
Ancestries in Mill Creek
796 7.6% English470 4.5% Irish427 4.1% European409 3.9% German322 3.1% American245 2.3% Scottish243 2.3% Norwegian237 2.3% South African216 2.1% Bulgarian172 1.6% Italian157 1.5% Syrian113 1.1% British105 1.0% Swedish78 0.7% Danish73 0.7% Portuguese68 0.6% French67 0.6% Polish63 0.6% Yugoslavian59 0.6% Iranian59 0.6% French Canadian58 0.6% Russian58 0.6% Nigerian42 0.4% Finnish39 0.4% Egyptian35 0.3% Northern European33 0.3% Scandinavian31 0.3% Dutch31 0.3% Czechoslovakian30 0.3% Austrian24 0.2% Hungarian23 0.2% Canadian21 0.2% Icelander21 0.2% Scotch-Irish21 0.2% Belgian20 0.2% Australian15 0.1% Greek14 0.1% Serbian12 0.1% Arab10 0.10% Slovak9 0.09% Welsh7 0.07% Romanian4 0.04% Ukrainian
Children Nativity (place of birth) in Mill Creek
Children under 6 years - Living with two parents Both parents native 766 100.0% NativeBoth parents foreign-born 425 95.5% Native20 4.5% Foreign-bornOne native, one foreign-born parent 334 100.0% NativeChildren under 6 years - Living with one parent Native parent 71 100.0% NativeForeign-born parent 4 100.0% Foreign-bornChildren 6 to 17 years - Living with two parents Both parents native 1,086 79.9% Native272 20.1% Foreign-bornBoth parents foreign-born 633 79.5% Native163 20.5% Foreign-bornOne native, one foreign-born parent 224 100.0% NativeChildren 6 to 17 years - Living with one parent Native parent 344 100.0% NativeForeign-born parent 153 49.1% Native159 50.9% Foreign-born
Grandparents responsible for own grandchildren in Mill Creek
Grandparents (30 to 59 years) White / Caucasian 7 10.1% Responsible for grandchildren62 89.9% Not responsible for grandchildrenBlack or African American 23 100.0% Not responsible for grandchildrenWhite alone, not Hispanic / Latino 7 10.1% Responsible for grandchildren66 89.9% Not responsible for grandchildren
Grandparents (60 years and over) White / Caucasian 94 100.0% Not responsible for grandchildrenWhite alone, not Hispanic / Latino 98 100.0% Not responsible for grandchildren