Races in Mill Plain, Washington (WA) Detailed Stats
Ancestries, Foreign-born residents, place of birth

Recent posts about races in Mill Plain, Washington on our local forum with over 2,400,000 registered users:
 | Salmon Creek vs. Fishers Landing (222 replies) |
| Szechuan Brothers restaurant on Mill Plain? (9 replies) |
| Suggest Vancouver / Camas neighborhoods for family with older kids (17 replies) |
| Rental houses that allow German Shepherds (6 replies) |
| Eating in Clark County (72 replies) |
| Potential Move to Camas (53 replies) |
14.2% of Mill Plain, WA residents are foreign-born (7.3% born in Europe, 3.6% born in Asia, 2.3% born in Latin America), which is 5.3% less than the foreign-born rate of 15.0% across the entire state of Washington.
Race distribution in Mill Plain

- 6,34785.8%White alone
- 4586.2%Asian alone
- 2293.1%Two or more races
- 1972.7%Hispanic
- 1191.6%Black alone
- 390.5%American Indian alone
- 80.1%Native Hawaiian and Other
Pacific Islander alone - 30.04%Other race alone
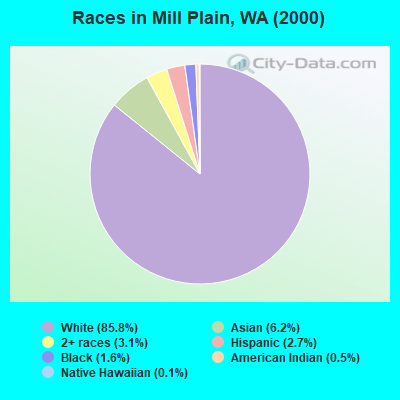
2000
2022
-
- 4,652,49078.9%White alone
- 441,5097.5%Hispanic
- 319,4015.4%Asian alone
- 184,6313.1%Black alone
- 175,9263.0%Two or more races
- 85,3961.4%American Indian alone
- 22,7790.4%Native Hawaiian and Other
Pacific Islander alone - 11,9890.2%Other race alone

-
- 4,941,45663.5%White alone
- 1,093,31314.0%Hispanic
- 755,8329.7%Asian alone
- 523,4486.7%Two or more races
- 299,5373.8%Black alone
- 69,0240.9%American Indian alone
- 52,2310.7%Native Hawaiian and Other
Pacific Islander alone - 50,9450.7%Other race alone

Income and house value in Mill Plain
- Median household income in 2022
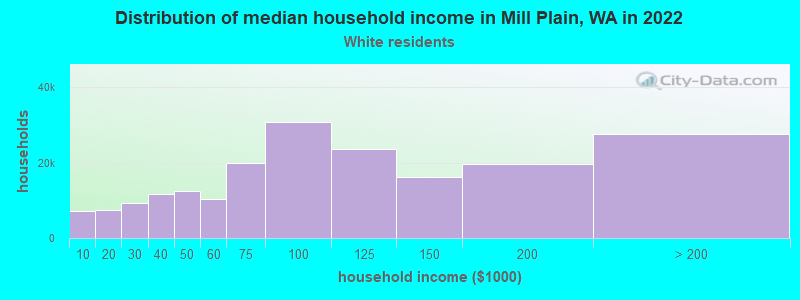
- $110,405White non-Hispanic householders
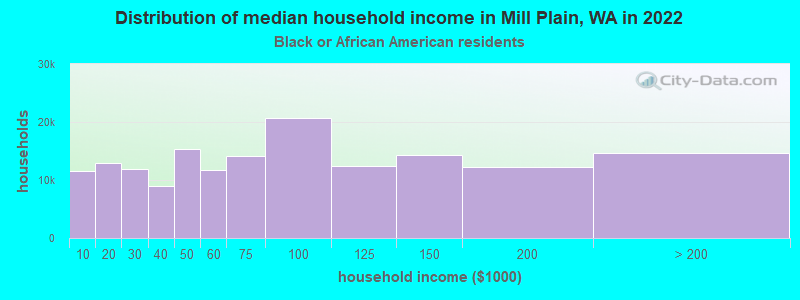
- $72,310Black householders
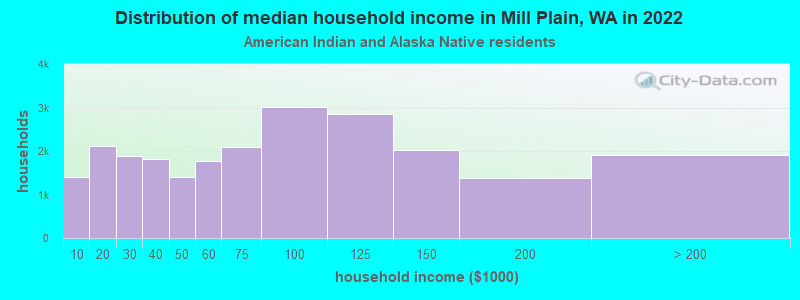
- $106,464American Indian and Alaska Native householders
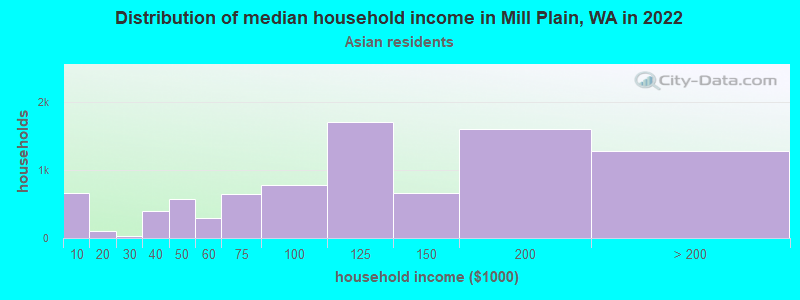
- $116,700Asian householders
- $35,992Some other race householders
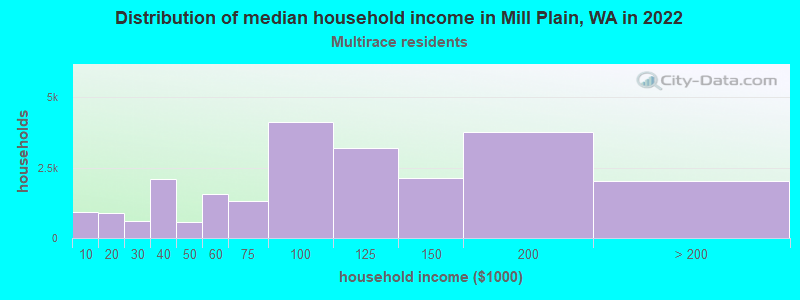
- $118,449Two or more races householders
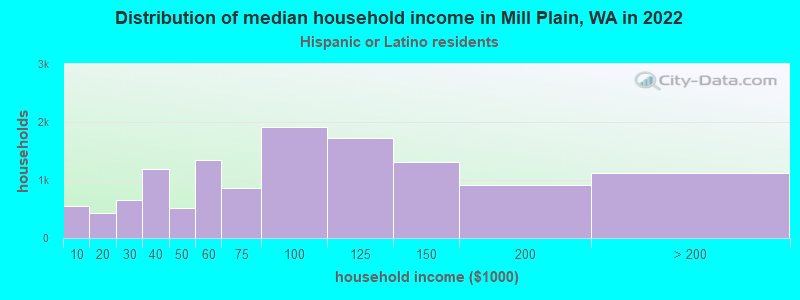
- $68,309Hispanic or Latino race householders
- Median 2022 house value
- $564,392White Non-Hispanic householders
- $708,012Black or African American householders
- $541,441American Indian or Alaska Native householders
- $497,625Asian householders
- $428,076Some other race householders
- $550,482Two or more races householders
- $557,785Hispanic or Latino householders
Household income for White non-Hispanic householders
Household income for Black householders
Household income for American Indian and Alaska Native householders
Household income for Asian householders
Household income for Two or more races householders
Household income for Hispanic or Latino race householders
Foreign-born residents in Mill Plain
1,054 residents are foreign born (7.3% Europe, 3.6% Asia, 2.3% Latin America).
| This city: | 14.2% |
| Washington: | 10.4% |
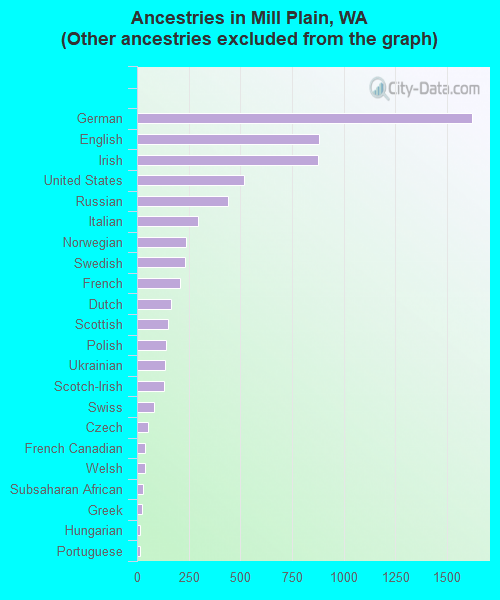
Ancestries in Mill Plain

- 1,77821.9%Other
- 1,62320.0%German
- 87910.8%English
- 87710.8%Irish
- 5176.4%United States
- 4395.4%Russian
- 2973.7%Italian
- 2382.9%Norwegian
- 2322.9%Swedish
- 2082.6%French
- 1652.0%Dutch
- 1491.8%Scottish
- 1391.7%Polish
- 1371.7%Ukrainian
- 1291.6%Scotch-Irish
- 821.0%Swiss
- 520.6%Czech
- 400.5%French Canadian
- 370.5%Welsh
- 280.3%Subsaharan African
- 250.3%Greek
- 160.2%Hungarian
- 150.2%Portuguese
- 90.1%Danish
- 80.10%West Indian
- 70.09%Lithuanian
Zip codes: 98682.