Races in Millburn, New Jersey (NJ) Detailed Stats
Ancestries, Foreign-born residents, place of birth

Recent posts about races in Millburn, New Jersey on our local forum with over 2,400,000 registered users:
 | Curious about Change in Demographic in Millburn Short Hills (43 replies) |
| School culture in Millburn and Short hills (200 replies) |
| Millburn fire code (4 replies) |
| Ridgewood vs Millburn (44 replies) |
| Millburn - communities near Deerfield Elementary vs Wyoming School (7 replies) |
| Glen Rock vs. Millburn vs. Westfield (14 replies) |
Latest news about races in Millburn, NJ collected exclusively by city-data.com from local newspapers, TV, and radio stations
14.7% of Millburn, NJ residents are foreign-born (6.3% born in Asia, 5.4% born in Europe, 1.9% born in Latin America), which is 56.8% less than the foreign-born rate of 23.0% across the entire state of New Jersey.
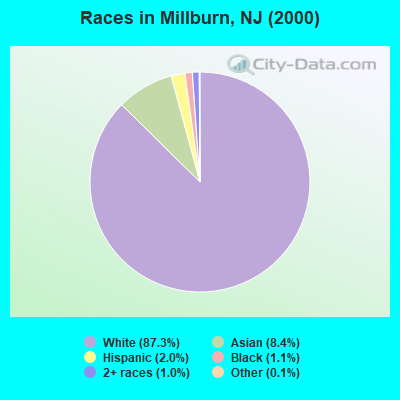
Race distribution in Millburn

- 17,26287.3%White alone
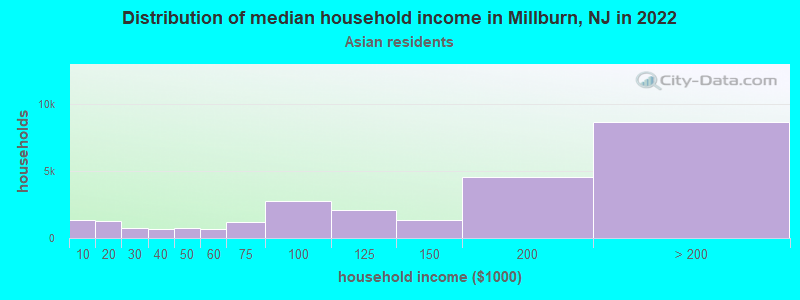
- 1,6588.4%Asian alone
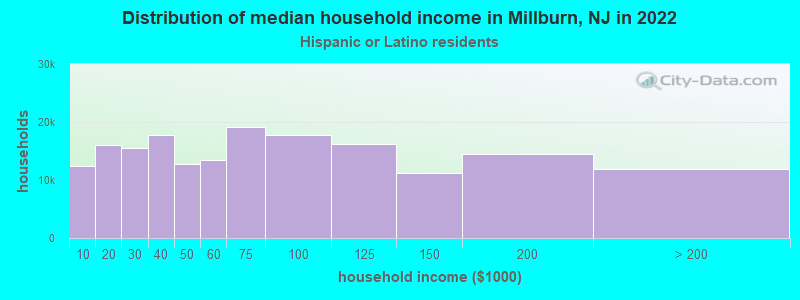
- 4042.0%Hispanic
- 2121.1%Black alone
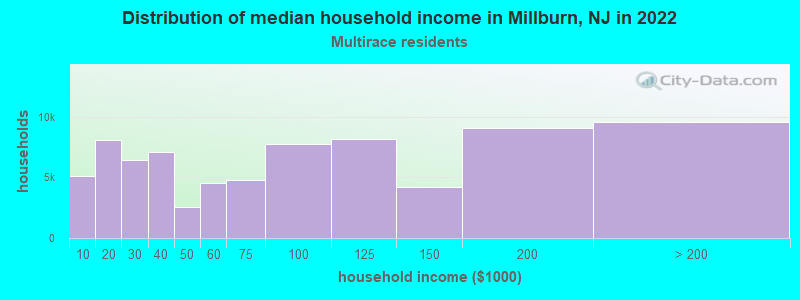
- 1891.0%Two or more races
- 270.1%Other race alone
- 70.04%American Indian alone
- 60.03%Native Hawaiian and Other
Pacific Islander alone
2000
2022
-
- 5,557,20966.0%White alone
- 1,117,19113.3%Hispanic
- 1,096,17113.0%Black alone
- 477,0125.7%Asian alone
- 133,6891.6%Two or more races
- 19,5650.2%Other race alone
- 11,3380.1%American Indian alone
- 2,1750.03%Native Hawaiian and Other
Pacific Islander alone

-
- 4,766,47651.5%White alone
- 2,028,47021.9%Hispanic
- 1,111,63212.0%Black alone
- 923,54610.0%Asian alone
- 332,2373.6%Two or more races
- 89,8471.0%Other race alone
- 8,5570.09%American Indian alone
- 9340.01%Native Hawaiian and Other
Pacific Islander alone

Income and house value in Millburn
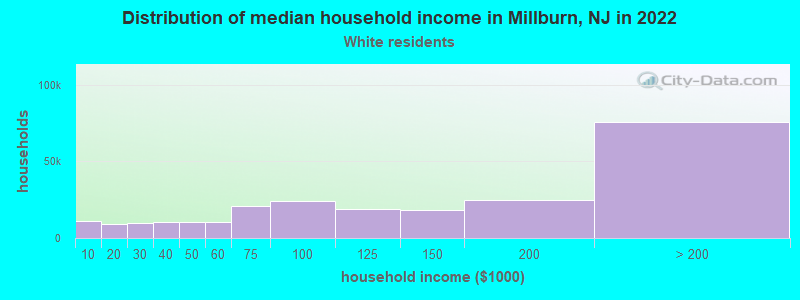
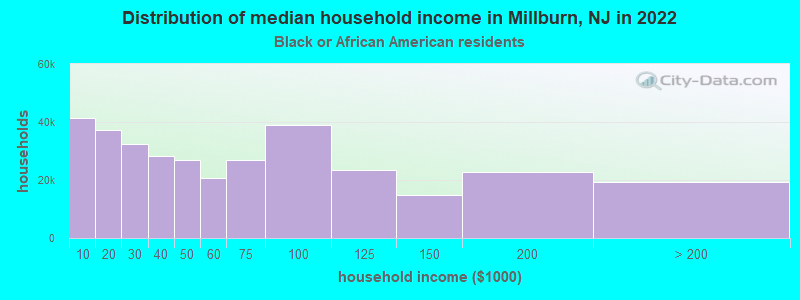
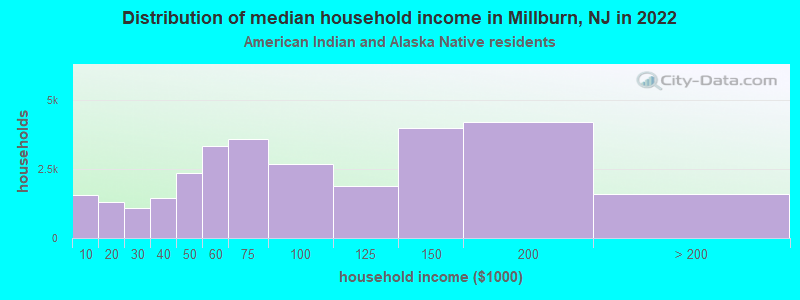
- Median household income in 2022
- over $200,000White non-Hispanic householders
- $140,131Black householders
- $156,083American Indian and Alaska Native householders
- over $200,000Asian householders
- $46,366Some other race householders
- $181,227Two or more races householders
- $168,135Hispanic or Latino race householders
- Median 2022 house value
- over $1,000,000White Non-Hispanic householders
- $947,025Black or African American householders
- over $1,000,000Asian householders
- $295,043Some other race householders
- $721,218Two or more races householders
- over $1,000,000Hispanic or Latino householders
Household income for White non-Hispanic householders
Household income for Black householders
Household income for American Indian and Alaska Native householders
Household income for Asian householders
Household income for Two or more races householders
Household income for Hispanic or Latino race householders
Foreign-born residents in Millburn
2,899 residents are foreign born (6.3% Asia, 5.4% Europe, 1.9% Latin America).
| This city: | 14.7% |
| New Jersey: | 17.5% |
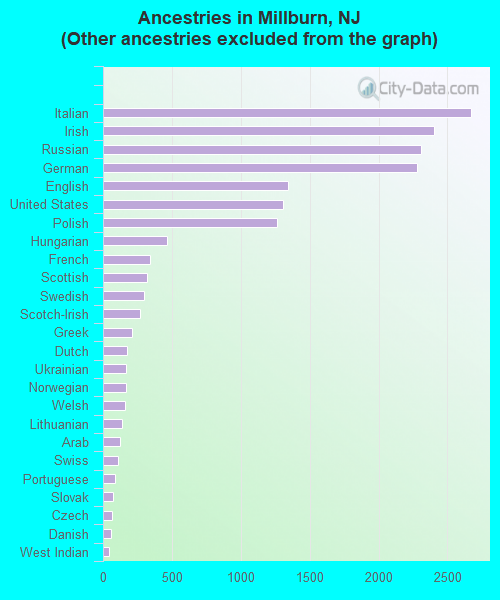
Ancestries in Millburn

- 6,16126.7%Other
- 2,66811.6%Italian
- 2,40310.4%Irish
- 2,30910.0%Russian
- 2,2779.9%German
- 1,3455.8%English
- 1,3065.7%United States
- 1,2655.5%Polish
- 4652.0%Hungarian
- 3431.5%French
- 3191.4%Scottish
- 3001.3%Swedish
- 2701.2%Scotch-Irish
- 2080.9%Greek
- 1710.7%Dutch
- 1700.7%Ukrainian
- 1680.7%Norwegian
- 1610.7%Welsh
- 1370.6%Lithuanian
- 1270.6%Arab
- 1110.5%Swiss
- 890.4%Portuguese
- 740.3%Slovak
- 670.3%Czech
- 550.2%Danish
- 440.2%West Indian
- 330.1%Subsaharan African
- 260.1%French Canadian
Zip codes: 07078.