Races in Millersville, Pennsylvania (PA) Detailed Stats
Data:
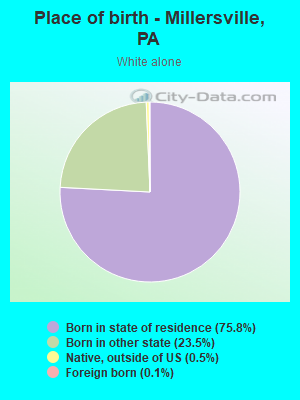
Races - White alone (%)
Races - White alone (% change since 2000)
Races - Black alone (%)
Races - Black alone (% change since 2000)
Races - American Indian alone (%)
Races - American Indian alone (% change since 2000)
Races - Asian alone (%)
Races - Asian alone (% change since 2000)
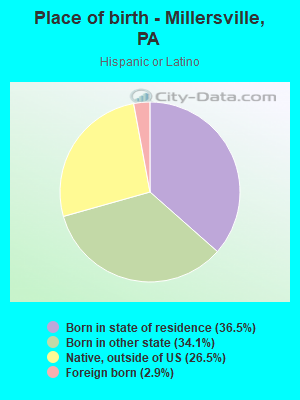
Races - Hispanic (%)
Races - Hispanic (% change since 2000)
Races - Native Hawaiian and Other Pacific Islander alone (%)
Races - Native Hawaiian and Other Pacific Islander alone (% change since 2000)
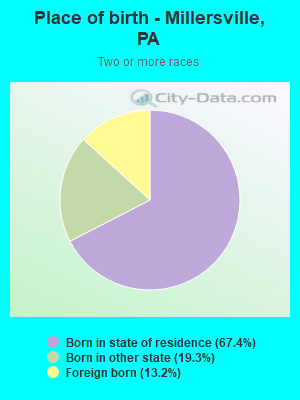
Races - Two or more races(%)
Races - Two or more races(% change since 2000)
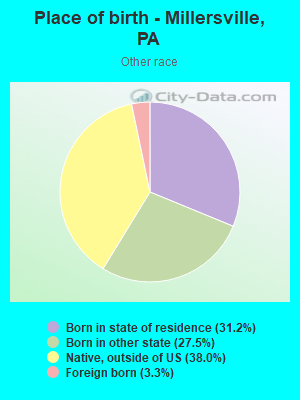
Races - Other race alone (%)
Races - Other race alone (% change since 2000)
Racial diversity
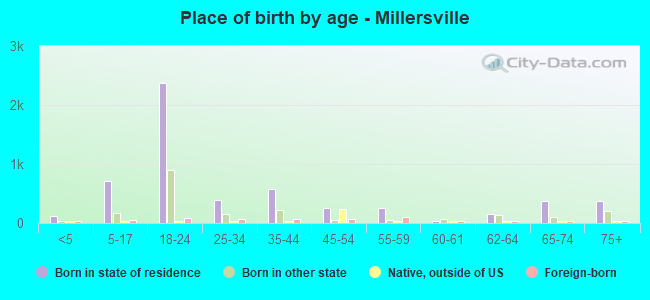
Place of birth - Born in state of residence (%)
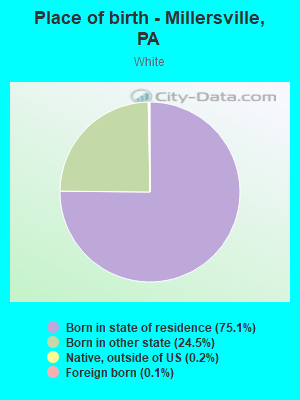
Place of birth - Born in state of residence (%) - White
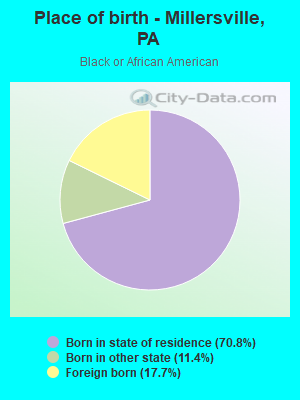
Place of birth - Born in state of residence (%) - Black or African American
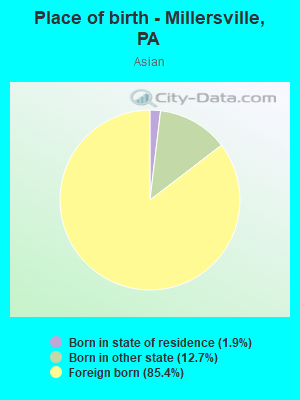
Place of birth - Born in state of residence (%) - Asian
Place of birth - Born in state of residence (%) - Hispanic or Latino
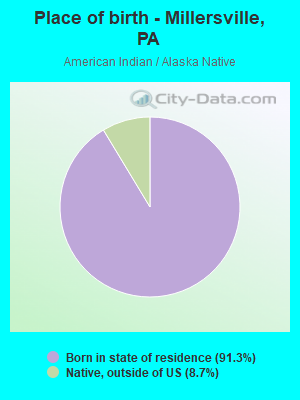
Place of birth - Born in state of residence (%) - American Indian and Alaska Native
Place of birth - Born in state of residence (%) - Multirace
Place of birth - Born in state of residence (%) - Other Race
Place of birth - Born in other state (%)
Place of birth - Born in other state (%) - White
Place of birth - Born in other state (%) - Black or African American
Place of birth - Born in other state (%) - Asian
Place of birth - Born in other state (%) - Hispanic or Latino
Place of birth - Born in other state (%) - American Indian and Alaska Native
Place of birth - Born in other state (%) - Multirace
Place of birth - Born in other state (%) - Other Race
Place of birth - Native, outside of US (%)
Place of birth - Native, outside of US (%) - White
Place of birth - Native, outside of US (%) - Black or African American
Place of birth - Native, outside of US (%) - Asian
Place of birth - Native, outside of US (%) - Hispanic or Latino
Place of birth - Native, outside of US (%) - American Indian and Alaska Native
Place of birth - Native, outside of US (%) - Multirace
Place of birth - Native, outside of US (%) - Other Race
Place of birth - Foreign born (%)
Place of birth - Foreign born (%) - White
Place of birth - Foreign born (%) - Black or African American
Place of birth - Foreign born (%) - Asian
Place of birth - Foreign born (%) - Hispanic or Latino
Place of birth - Foreign born (%) - American Indian and Alaska Native
Place of birth - Foreign born (%) - Multirace
Place of birth - Foreign born (%) - Other Race
Residents speaking English at home (%)
Residents speaking English at home - Born in the United States (%)
Residents speaking English at home - Native, born elsewhere (%)
Residents speaking English at home - Foreign born (%)
Residents speaking Spanish at home (%)
Residents speaking Spanish at home - Born in the United States (%)
Residents speaking Spanish at home - Native, born elsewhere (%)
Residents speaking Spanish at home - Foreign born (%)
Residents speaking other language at home (%)
Residents speaking other language at home - Born in the United States (%)
Residents speaking other language at home - Native, born elsewhere (%)
Residents speaking other language at home - Foreign born (%)
Marital status - Never married (%)
Marital status - Now married (%)
Marital status - Separated (%)
Marital status - Widowed (%)
Marital status - Divorced (%)
Ancestries Reported - Arab (%)
Ancestries Reported - Czech (%)
Ancestries Reported - Danish (%)
Ancestries Reported - Dutch (%)
Ancestries Reported - English (%)
Ancestries Reported - French (%)
Ancestries Reported - French Canadian (%)
Ancestries Reported - German (%)
Ancestries Reported - Greek (%)
Ancestries Reported - Hungarian (%)
Ancestries Reported - Irish (%)
Ancestries Reported - Italian (%)
Ancestries Reported - Lithuanian (%)
Ancestries Reported - Norwegian (%)
Ancestries Reported - Polish (%)
Ancestries Reported - Portuguese (%)
Ancestries Reported - Russian (%)
Ancestries Reported - Scotch-Irish (%)
Ancestries Reported - Scottish (%)
Ancestries Reported - Slovak (%)
Ancestries Reported - Subsaharan African (%)
Ancestries Reported - Swedish (%)
Ancestries Reported - Swiss (%)
Ancestries Reported - Ukrainian (%)
Ancestries Reported - United States (%)
Ancestries Reported - Welsh (%)
Ancestries Reported - West Indian (%)
Ancestries Reported - Other (%)
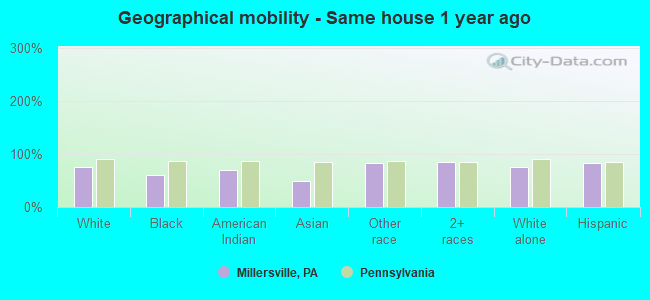
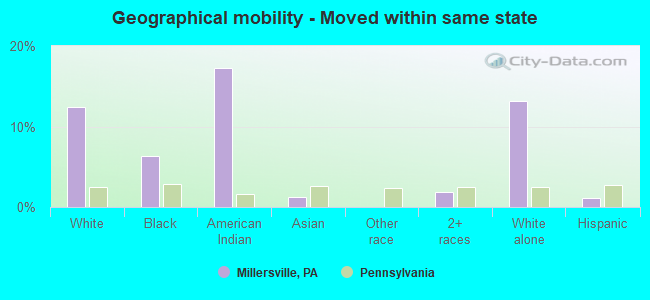
Geographical mobility - Same house 1 year ago (%)
Geographical mobility - Same house 1 year ago (%) - White
Geographical mobility - Same house 1 year ago (%) - Black or African American
Geographical mobility - Same house 1 year ago (%) - Asian
Geographical mobility - Same house 1 year ago (%) - Hispanic or Latino
Geographical mobility - Same house 1 year ago (%) - American Indian and Alaska Native
Geographical mobility - Same house 1 year ago (%) - Multirace
Geographical mobility - Same house 1 year ago (%) - Other Race
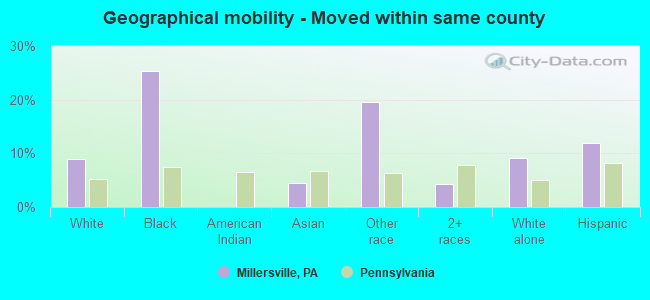
Geographical mobility - Moved within same county (%)
Geographical mobility - Moved within same county (%) - White
Geographical mobility - Moved within same county (%) - Black or African American
Geographical mobility - Moved within same county (%) - Asian
Geographical mobility - Moved within same county (%) - Hispanic or Latino
Geographical mobility - Moved within same county (%) - American Indian and Alaska Native
Geographical mobility - Moved within same county (%) - Multirace
Geographical mobility - Moved within same county (%) - Other Race
Geographical mobility - Moved from different county within same state (%)
Geographical mobility - Moved from different county within same state (%) - White
Geographical mobility - Moved from different county within same state (%) - Black or African American
Geographical mobility - Moved from different county within same state (%) - Asian
Geographical mobility - Moved from different county within same state (%) - Hispanic or Latino
Geographical mobility - Moved from different county within same state (%) - American Indian and Alaska Native
Geographical mobility - Moved from different county within same state (%) - Multirace
Geographical mobility - Moved from different county within same state (%) - Other Race
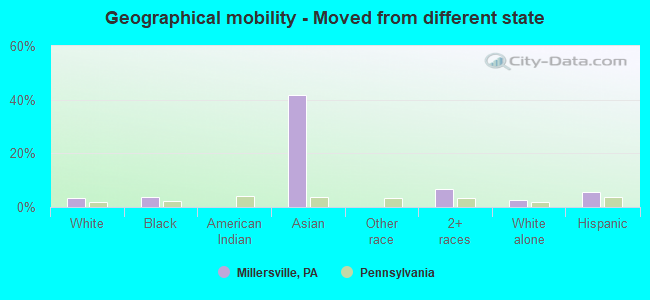
Geographical mobility - Moved from different state (%)
Geographical mobility - Moved from different state (%) - White
Geographical mobility - Moved from different state (%) - Black or African American
Geographical mobility - Moved from different state (%) - Asian
Geographical mobility - Moved from different state (%) - Hispanic or Latino
Geographical mobility - Moved from different state (%) - American Indian and Alaska Native
Geographical mobility - Moved from different state (%) - Multirace
Geographical mobility - Moved from different state (%) - Other Race
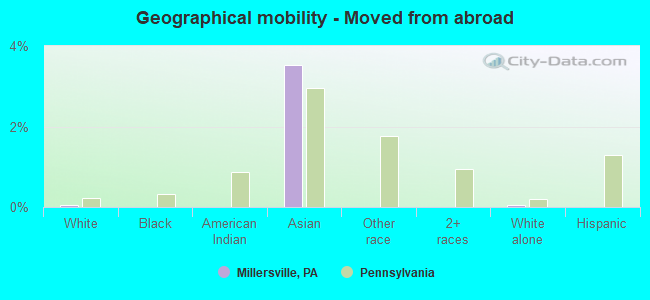
Geographical mobility - Moved from abroad (%)
Geographical mobility - Moved from abroad (%) - White
Geographical mobility - Moved from abroad (%) - Black or African American
Geographical mobility - Moved from abroad (%) - Asian
Geographical mobility - Moved from abroad (%) - Hispanic or Latino
Geographical mobility - Moved from abroad (%) - American Indian and Alaska Native
Geographical mobility - Moved from abroad (%) - Multirace
Geographical mobility - Moved from abroad (%) - Other Race
Place of birth for the foreign-born population - Ireland (%)
Place of birth for the foreign-born population - Denmark (%)
Place of birth for the foreign-born population - Norway (%)
Place of birth for the foreign-born population - Sweden (%)
Place of birth for the foreign-born population - United Kingdom (%)
Place of birth for the foreign-born population - England (%)
Place of birth for the foreign-born population - Scotland (%)
Place of birth for the foreign-born population - Other Northern Europe (%)
Place of birth for the foreign-born population - Austria (%)
Place of birth for the foreign-born population - Belgium (%)
Place of birth for the foreign-born population - France (%)
Place of birth for the foreign-born population - Germany (%)
Place of birth for the foreign-born population - Netherlands (%)
Place of birth for the foreign-born population - Switzerland (%)
Place of birth for the foreign-born population - Other Western Europe (%)
Place of birth for the foreign-born population - Greece (%)
Place of birth for the foreign-born population - Italy (%)
Place of birth for the foreign-born population - Portugal (%)
Place of birth for the foreign-born population - Spain (%)
Place of birth for the foreign-born population - Other Southern Europe (%)
Place of birth for the foreign-born population - Albania (%)
Place of birth for the foreign-born population - Belarus (%)
Place of birth for the foreign-born population - Bosnia and Herzegovina (%)
Place of birth for the foreign-born population - Bulgaria (%)
Place of birth for the foreign-born population - Croatia (%)
Place of birth for the foreign-born population - Czechoslovakia (%)
Place of birth for the foreign-born population - Hungary (%)
Place of birth for the foreign-born population - Latvia (%)
Place of birth for the foreign-born population - Lithuania (%)
Place of birth for the foreign-born population - North Macedonia (Macedonia) (%)
Place of birth for the foreign-born population - Moldova (%)
Place of birth for the foreign-born population - Poland (%)
Place of birth for the foreign-born population - Romania (%)
Place of birth for the foreign-born population - Russia (%)
Place of birth for the foreign-born population - Serbia (%)
Place of birth for the foreign-born population - Ukraine (%)
Place of birth for the foreign-born population - Other Eastern Europe (%)
Place of birth for the foreign-born population - China (%)
Place of birth for the foreign-born population - Hong Kong (%)
Place of birth for the foreign-born population - Taiwan (%)
Place of birth for the foreign-born population - Japan (%)
Place of birth for the foreign-born population - Korea (%)
Place of birth for the foreign-born population - Other Eastern Asia (%)
Place of birth for the foreign-born population - Afghanistan (%)
Place of birth for the foreign-born population - Bangladesh (%)
Place of birth for the foreign-born population - India (%)
Place of birth for the foreign-born population - Iran (%)
Place of birth for the foreign-born population - Kazakhstan (%)
Place of birth for the foreign-born population - Nepal (%)
Place of birth for the foreign-born population - Pakistan (%)
Place of birth for the foreign-born population - Sri Lanka (%)
Place of birth for the foreign-born population - Uzbekistan (%)
Place of birth for the foreign-born population - Other South Central Asia (%)
Place of birth for the foreign-born population - Burma (%)
Place of birth for the foreign-born population - Cambodia (%)
Place of birth for the foreign-born population - Indonesia (%)
Place of birth for the foreign-born population - Laos (%)
Place of birth for the foreign-born population - Malaysia (%)
Place of birth for the foreign-born population - Philippines (%)
Place of birth for the foreign-born population - Singapore (%)
Place of birth for the foreign-born population - Thailand (%)
Place of birth for the foreign-born population - Vietnam (%)
Place of birth for the foreign-born population - Other South Eastern Asia (%)
Place of birth for the foreign-born population - Armenia (%)
Place of birth for the foreign-born population - Iraq (%)
Place of birth for the foreign-born population - Israel (%)
Place of birth for the foreign-born population - Jordan (%)
Place of birth for the foreign-born population - Kuwait (%)
Place of birth for the foreign-born population - Lebanon (%)
Place of birth for the foreign-born population - Saudi Arabia (%)
Place of birth for the foreign-born population - Syria (%)
Place of birth for the foreign-born population - Turkey (%)
Place of birth for the foreign-born population - Yemen (%)
Place of birth for the foreign-born population - Other Western Asia (%)
Place of birth for the foreign-born population - Eritrea (%)
Place of birth for the foreign-born population - Ethiopia (%)
Place of birth for the foreign-born population - Kenya (%)
Place of birth for the foreign-born population - Somalia (%)
Place of birth for the foreign-born population - Uganda (%)
Place of birth for the foreign-born population - Zimbabwe (%)
Place of birth for the foreign-born population - Other Eastern Africa (%)
Place of birth for the foreign-born population - Cameroon (%)
Place of birth for the foreign-born population - Congo (%)
Place of birth for the foreign-born population - Democratic Republic of Congo (Zaire) (%)
Place of birth for the foreign-born population - Other Middle Africa (%)
Place of birth for the foreign-born population - Egypt (%)
Place of birth for the foreign-born population - Morocco (%)
Place of birth for the foreign-born population - Sudan (%)
Place of birth for the foreign-born population - Other Northern Africa (%)
Place of birth for the foreign-born population - South Africa (%)
Place of birth for the foreign-born population - Other Southern Africa (%)
Place of birth for the foreign-born population - Cabo Verde (%)
Place of birth for the foreign-born population - Ghana (%)
Place of birth for the foreign-born population - Liberia (%)
Place of birth for the foreign-born population - Nigeria (%)
Place of birth for the foreign-born population - Senegal (%)
Place of birth for the foreign-born population - Sierra Leone (%)
Place of birth for the foreign-born population - Other Western Africa (%)
Place of birth for the foreign-born population - Australia (%)
Place of birth for the foreign-born population - New Zealand (%)
Place of birth for the foreign-born population - Fiji (%)
Place of birth for the foreign-born population - Micronesia (%)
Place of birth for the foreign-born population - Bahamas (%)
Place of birth for the foreign-born population - Barbados (%)
Place of birth for the foreign-born population - Cuba (%)
Place of birth for the foreign-born population - Dominica (%)
Place of birth for the foreign-born population - Dominican Republic (%)
Place of birth for the foreign-born population - Grenada (%)
Place of birth for the foreign-born population - Haiti (%)
Place of birth for the foreign-born population - Jamaica (%)
Place of birth for the foreign-born population - St. Vincent and the Grenadines (%)
Place of birth for the foreign-born population - Trinidad and Tobago (%)
Place of birth for the foreign-born population - West Indies (%)
Place of birth for the foreign-born population - Other Caribbean (%)
Place of birth for the foreign-born population - Belize (%)
Place of birth for the foreign-born population - Costa Rica (%)
Place of birth for the foreign-born population - El Salvador (%)
Place of birth for the foreign-born population - Guatemala (%)
Place of birth for the foreign-born population - Honduras (%)
Place of birth for the foreign-born population - Mexico (%)
Place of birth for the foreign-born population - Nicaragua (%)
Place of birth for the foreign-born population - Panama (%)
Place of birth for the foreign-born population - Other Central America (%)
Place of birth for the foreign-born population - Argentina (%)
Place of birth for the foreign-born population - Bolivia (%)
Place of birth for the foreign-born population - Brazil (%)
Place of birth for the foreign-born population - Chile (%)
Place of birth for the foreign-born population - Colombia (%)
Place of birth for the foreign-born population - Ecuador (%)
Place of birth for the foreign-born population - Guyana (%)
Place of birth for the foreign-born population - Peru (%)
Place of birth for the foreign-born population - Uruguay (%)
Place of birth for the foreign-born population - Venezuela (%)
Place of birth for the foreign-born population - Other South America (%)
Place of birth for the foreign-born population - Canada (%)
Place of birth for the foreign-born population - Other Northern America (%)
Place of birth for the foreign-born population - Other (%)
Latest news about races in Millersville, PA collected exclusively by city-data.com from local newspapers, TV, and radio stations
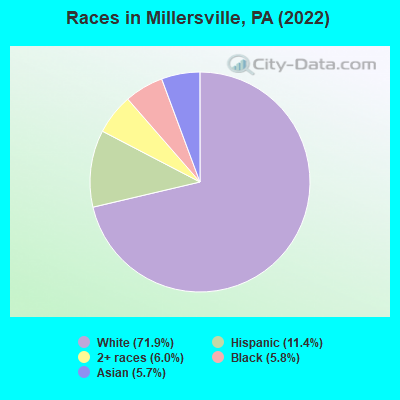
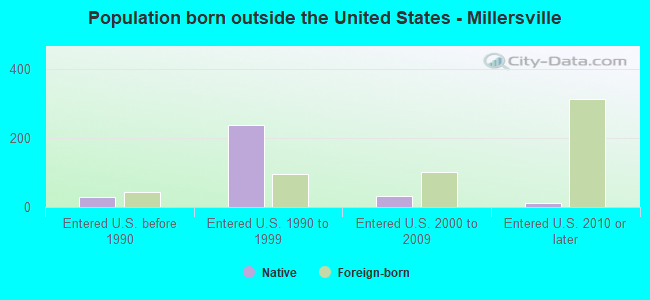
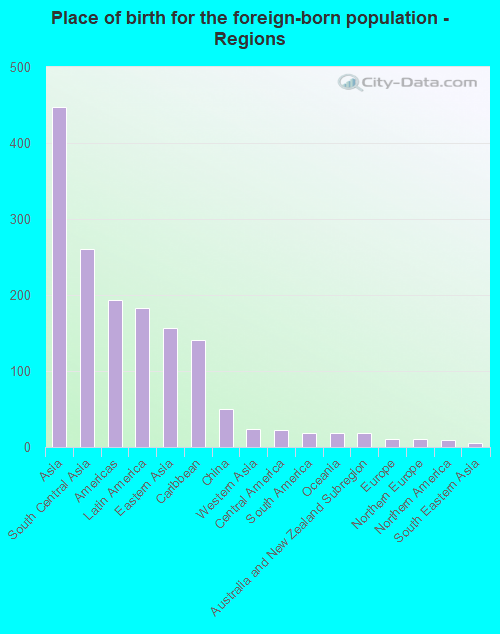
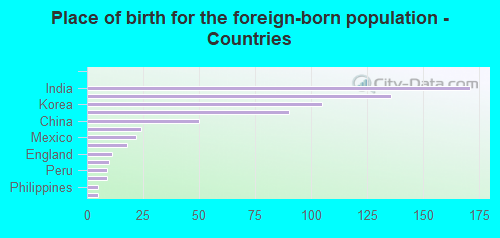
According to 2022 data, the most numerous races in Millersville, PA are White alone (6,099 residents), Black alone (493 residents), and Hispanic (963 residents). 85.9% of Millersville residents speak English at home. 7.9% of Millersville, PA residents are foreign-born (5.1% born in Asia, 2.1% born in Latin America), which is 11.6% greater than the foreign-born rate of 7.0% across the entire state of Pennsylvania.
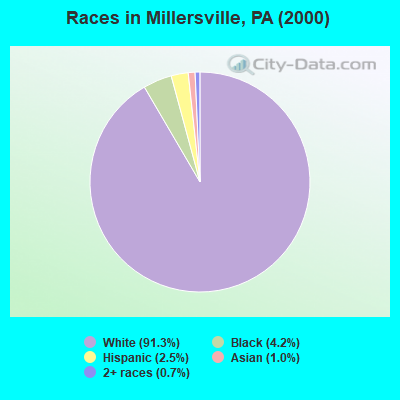
Race distribution in Millersville
2000 2022
10,322,455 84.1% White alone 1,202,437 9.8% Black alone 394,088 3.2% Hispanic 218,296 1.8% Asian alone 113,097 0.9% Two or more races 13,086 0.1% Other race alone 14,904 0.1% American Indian alone 2,691 0.02% Native Hawaiian and Other
9,487,228 73.1% White alone 1,311,581 10.1% Black alone 1,115,997 8.6% Hispanic 493,942 3.8% Two or more races 487,124 3.8% Asian alone 63,582 0.5% Other race alone 10,130 0.08% American Indian alone 2,424 0.02% Native Hawaiian and Other
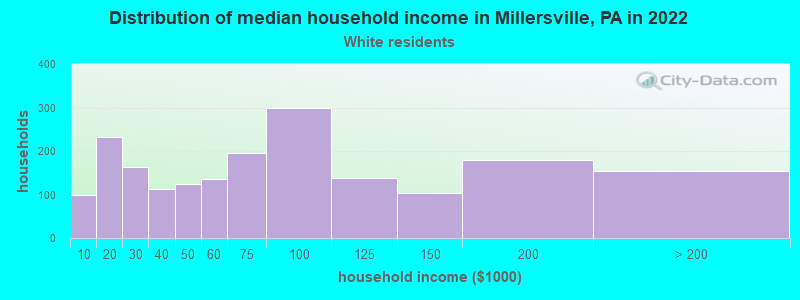
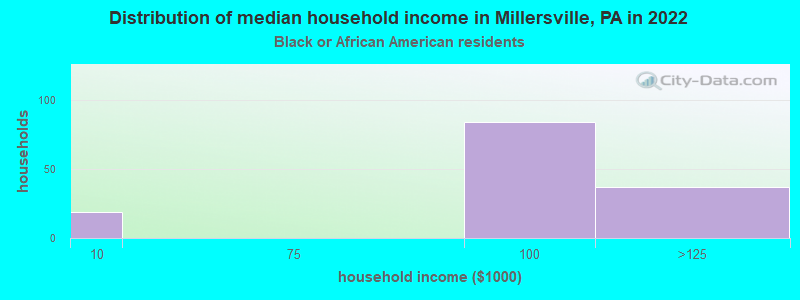
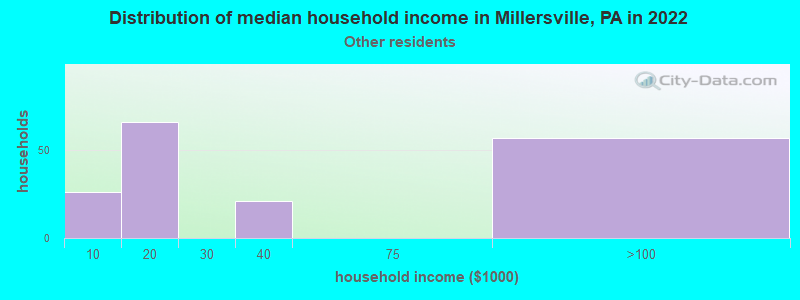
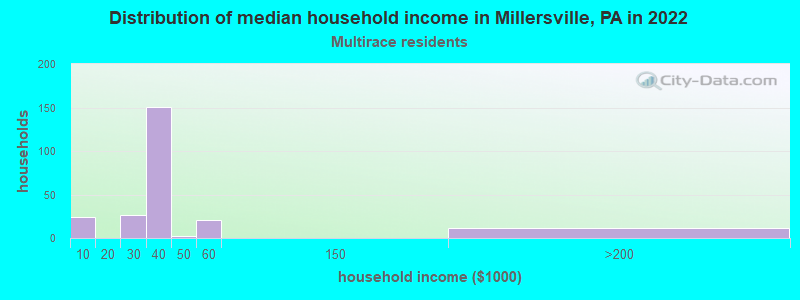
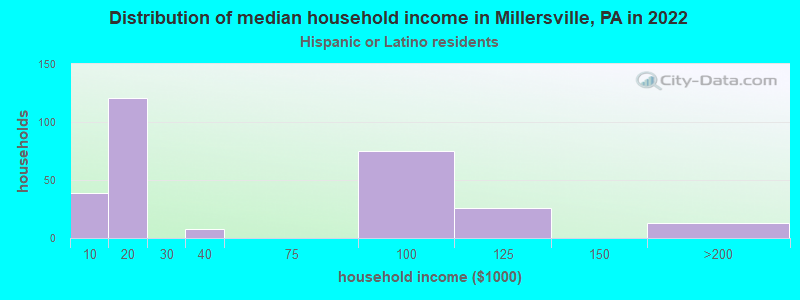
Income and house value in Millersville Median household income in 2022 $66,282 White non-Hispanic householders$81,664 Black householders$32,542 Two or more races householdersMedian 2022 house value $254,021 White Non-Hispanic householders $211,498 Asian householders$306,116 Some other race householders$189,235 Two or more races householders$250,459 Hispanic or Latino householders
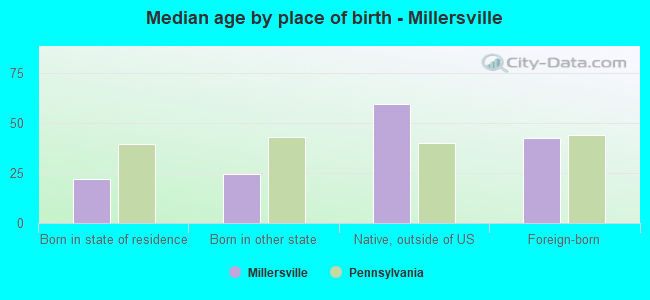
Median age by race in Millersville
23.0 Median age for White residents23.0 23.2 39.2 Median age for Black or African American residents37.4 41.5 60.0 Median age for American Indian / Alaska Native residents-714,583,332.6 -577,519,379.3 41.6 Median age for Asian residents40.9 23.8 -612,499,999.4 Median age for Native Hawaiian / Pacific Islander residents-760,416,665.9 -747,474,746.7 39.2 Median age for Other race residents44.4 18.5 26.7 Median age for Two or more races residents26.4 24.9 22.6 Median age for White alone residents22.8 22.9 26.0 Median age for Hispanic or Latino residents48.1 22.4
Owner/renter occupied households by race in Millersville
House owners and renters - White residents 1,156 59.0% Owner occupied803 41.0% Renter occupiedHouse owners and renters - Black or African American residents 104 100.0% Renter occupiedHouse owners and renters - Asian residents 71 100.0% Renter occupiedHouse owners and renters - Other race residents 48 31.4% Owner occupied104 68.6% Renter occupiedHouse owners and renters - Two or more races residents 130 66.0% Owner occupied67 34.0% Renter occupiedHouse owners and renters - White alone residents 1,144 58.0% Owner occupied829 42.0% Renter occupiedHouse owners and renters - Hispanic or Latino residents 81 39.1% Owner occupied126 60.9% Renter occupied
Language usage in Millersville
English speakers - Total 85.9% of residents of Millersville speak English at home.
8.1% of residents speak Spanish at home 630 92.8% Speak English very well49 7.2% Speak English less than very well6.7% of residents speak other language at home 243 43.6% Speak English very well314 56.4% Speak English less than very well
English speakers - Born in the United States 88.6% of residents of Millersville speak English at home.
8.9% of residents speak Spanish at home 163 95.3% Speak English very well8 4.7% Speak English less than very well2.6% of residents speak other language at home 49 100.0% Speak English very well
English speakers - Native, born elsewhere 12.2% of residents of Millersville speak English at home.
87.4% of residents speak Spanish at home 189 82.5% Speak English very well40 17.5% Speak English less than very well
English speakers - Foreign-born 21.7% of residents of Millersville speak English at home.
9.0% of residents speak Spanish at home 50 100.0% Speak English very well75.1% of residents speak other language at home 152 36.5% Speak English very well264 63.5% Speak English less than very well
White (Caucasian) - Speak only English Native:
98.9% (5,983)Foreign-born:
100.0% (6)
Black or African American - Speak only English Native:
97.5% (450)Foreign-born:
79.8% (88)
Black or African American - Speak another language Native:
3.3% (15)Foreign-born:
45.6% (50)
Asian - Speak only English Native:
20.8% (13)Foreign-born:
5.3% (22)
Asian - Speak another language Native:
57.7% (35)Foreign-born:
96.7% (399)
Other race - Speak another language Native:
84.0% (602)Foreign-born:
86.0% (19)
Two or more races - Speak only English Native:
89.7% (515)Foreign-born:
30.8% (29)
Two or more races - Speak another language Native:
12.1% (69)Foreign-born:
56.3% (53)
White alone - Speak only English Native:
98.7% (5,939)Foreign-born:
100.0% (7)
Hispanic or Latino - Speak another language Native:
61.6% (603)Foreign-born:
99.2% (28)
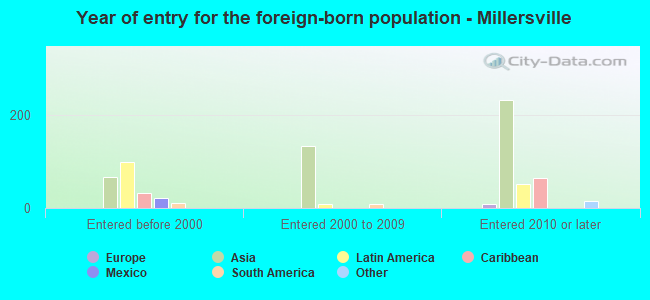
Foreign-born residents in Millersville 671 residents are foreign born (5.1% Asia , 2.1% Latin America ).
This city:
7.9%Pennsylvania:
7.3%
Marital status for residents in Millersville Marital status - White (Caucasian) population 15 years and over
Males 57.1% Never married34.4% Now married4.0% Separated0.6% Widowed3.8% DivorcedFemales 61.4% Never married23.3% Now married0.2% Separated5.7% Widowed9.4% DivorcedWomen who gave birth in the past 12 months Now married:
14.8% (4)Unmarried:
85.2% (22)
Women who did not give birth in the past 12 months Now married:
12.8% (275)Unmarried:
87.2% (1,871)
Marital status - Black or African American population 15 years and over
Males 78.5% Never married21.5% Now married0.0% Separated0.0% Widowed0.0% DivorcedFemales 69.1% Never married30.9% Now married0.0% Separated0.0% Widowed0.0% DivorcedWomen who did not give birth in the past 12 months Now married:
0.0% (0)Unmarried:
100.0% (153)
Marital status - American Indian / Alaska Native population 15 years and over
Males 0.0% Never married0.0% Now married0.0% Separated0.0% Widowed100.0% DivorcedFemales 33.3% Never married66.7% Now married0.0% Separated0.0% Widowed0.0% DivorcedWomen who did not give birth in the past 12 months Now married:
0.0% (0)Unmarried:
100.0% (5)
Marital status - Asian population 15 years and over
Males 24.0% Never married45.1% Now married0.0% Separated5.9% Widowed25.0% DivorcedFemales 36.6% Never married36.1% Now married0.0% Separated27.3% Widowed0.0% DivorcedWomen who did not give birth in the past 12 months Now married:
47.7% (65)Unmarried:
52.3% (71)
Marital status - Other race population 15 years and over
Males 95.7% Never married4.3% Now married0.0% Separated0.0% Widowed0.0% DivorcedFemales 86.3% Never married13.7% Now married0.0% Separated0.0% Widowed0.0% DivorcedWomen who did not give birth in the past 12 months Now married:
5.6% (11)Unmarried:
94.4% (177)
Marital status - Two or more races population 15 years and over
Males 73.6% Never married26.4% Now married0.0% Separated0.0% Widowed0.0% DivorcedFemales 69.1% Never married10.5% Now married0.0% Separated0.0% Widowed20.4% DivorcedWomen who gave birth in the past 12 months Now married:
16.2% (17)Unmarried:
83.8% (90)
Women who did not give birth in the past 12 months Now married:
4.5% (15)Unmarried:
95.5% (305)
Marital status - White alone, not Hispanic / Latino population 15 years and over
Males 57.1% Never married35.2% Now married4.1% Separated0.7% Widowed2.9% DivorcedFemales 60.4% Never married23.9% Now married0.2% Separated5.9% Widowed9.6% DivorcedWomen who gave birth in the past 12 months Now married:
14.8% (4)Unmarried:
85.2% (23)
Women who did not give birth in the past 12 months Now married:
13.3% (284)Unmarried:
86.7% (1,849)
Marital status - Hispanic or Latino population 15 years and over
Males 88.0% Never married6.2% Now married0.0% Separated0.0% Widowed5.8% DivorcedFemales 93.4% Never married6.6% Now married0.0% Separated0.0% Widowed0.0% DivorcedWomen who did not give birth in the past 12 months Now married:
2.6% (9)Unmarried:
97.4% (336)
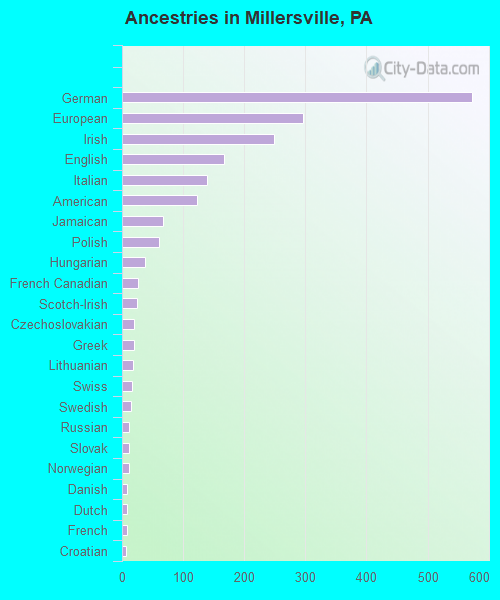
Ancestries in Millersville
572 17.2% German297 8.9% European248 7.4% Irish167 5.0% English139 4.2% Italian123 3.7% American67 2.0% Jamaican61 1.8% Polish37 1.1% Hungarian27 0.8% French Canadian24 0.7% Scotch-Irish19 0.6% Czechoslovakian19 0.6% Greek18 0.5% Lithuanian16 0.5% Swiss15 0.5% Swedish12 0.4% Russian12 0.4% Slovak11 0.3% Norwegian9 0.3% Danish9 0.3% Dutch8 0.2% French6 0.2% Croatian1 0.03% African
Children Nativity (place of birth) in Millersville
Children under 6 years - Living with two parents Both parents native 123 100.0% NativeBoth parents foreign-born 22 100.0% NativeChildren under 6 years - Living with one parent Native parent 48 100.0% NativeChildren 6 to 17 years - Living with two parents Both parents native 524 97.2% Native15 2.8% Foreign-bornBoth parents foreign-born 47 100.0% Foreign-bornOne native, one foreign-born parent 5 100.0% NativeChildren 6 to 17 years - Living with one parent Native parent 213 100.0% NativeForeign-born parent 71 45.0% Native86 55.0% Foreign-born
Grandparents responsible for own grandchildren in Millersville
Grandparents (30 to 59 years) White / Caucasian 17 100.0% Not responsible for grandchildrenWhite alone, not Hispanic / Latino 19 100.0% Not responsible for grandchildrenGrandparents (60 years and over) White / Caucasian 23 46.2% Responsible for grandchildren27 53.8% Not responsible for grandchildrenWhite alone, not Hispanic / Latino 24 45.1% Responsible for grandchildren29 54.9% Not responsible for grandchildren