Races in Milltown, New Jersey (NJ) Detailed Stats
Data:
Races - White alone (%)
Races - White alone (% change since 2000)
Races - Black alone (%)
Races - Black alone (% change since 2000)
Races - American Indian alone (%)
Races - American Indian alone (% change since 2000)
Races - Asian alone (%)
Races - Asian alone (% change since 2000)
Races - Hispanic (%)
Races - Hispanic (% change since 2000)
Races - Native Hawaiian and Other Pacific Islander alone (%)
Races - Native Hawaiian and Other Pacific Islander alone (% change since 2000)
Races - Two or more races(%)
Races - Two or more races(% change since 2000)
Races - Other race alone (%)
Races - Other race alone (% change since 2000)
Racial diversity
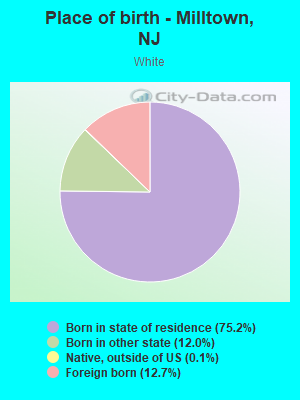
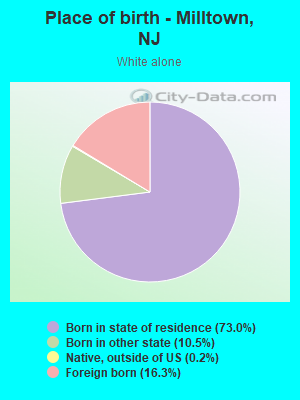
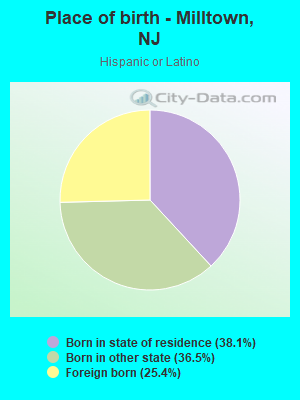
Place of birth - Born in state of residence (%)
Place of birth - Born in state of residence (%) - White
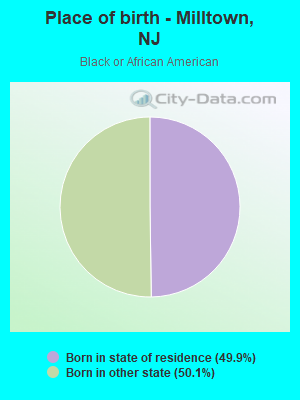
Place of birth - Born in state of residence (%) - Black or African American
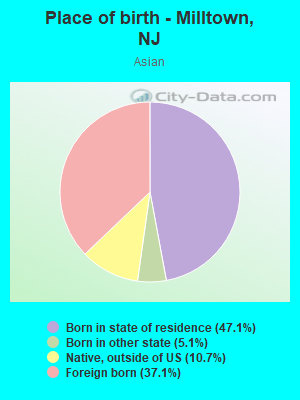
Place of birth - Born in state of residence (%) - Asian
Place of birth - Born in state of residence (%) - Hispanic or Latino
Place of birth - Born in state of residence (%) - American Indian and Alaska Native
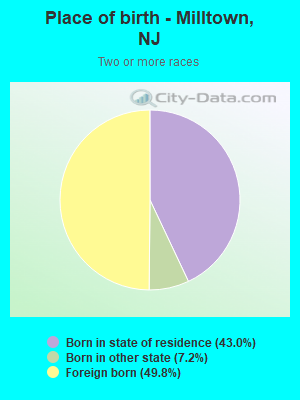
Place of birth - Born in state of residence (%) - Multirace
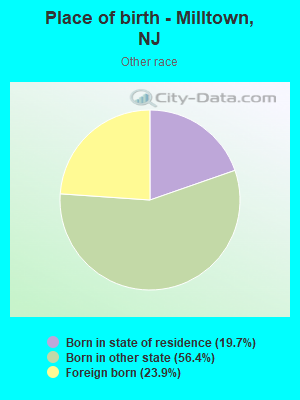
Place of birth - Born in state of residence (%) - Other Race
Place of birth - Born in other state (%)
Place of birth - Born in other state (%) - White
Place of birth - Born in other state (%) - Black or African American
Place of birth - Born in other state (%) - Asian
Place of birth - Born in other state (%) - Hispanic or Latino
Place of birth - Born in other state (%) - American Indian and Alaska Native
Place of birth - Born in other state (%) - Multirace
Place of birth - Born in other state (%) - Other Race
Place of birth - Native, outside of US (%)
Place of birth - Native, outside of US (%) - White
Place of birth - Native, outside of US (%) - Black or African American
Place of birth - Native, outside of US (%) - Asian
Place of birth - Native, outside of US (%) - Hispanic or Latino
Place of birth - Native, outside of US (%) - American Indian and Alaska Native
Place of birth - Native, outside of US (%) - Multirace
Place of birth - Native, outside of US (%) - Other Race
Place of birth - Foreign born (%)
Place of birth - Foreign born (%) - White
Place of birth - Foreign born (%) - Black or African American
Place of birth - Foreign born (%) - Asian
Place of birth - Foreign born (%) - Hispanic or Latino
Place of birth - Foreign born (%) - American Indian and Alaska Native
Place of birth - Foreign born (%) - Multirace
Place of birth - Foreign born (%) - Other Race
Residents speaking English at home (%)
Residents speaking English at home - Born in the United States (%)
Residents speaking English at home - Native, born elsewhere (%)
Residents speaking English at home - Foreign born (%)
Residents speaking Spanish at home (%)
Residents speaking Spanish at home - Born in the United States (%)
Residents speaking Spanish at home - Native, born elsewhere (%)
Residents speaking Spanish at home - Foreign born (%)
Residents speaking other language at home (%)
Residents speaking other language at home - Born in the United States (%)
Residents speaking other language at home - Native, born elsewhere (%)
Residents speaking other language at home - Foreign born (%)
Marital status - Never married (%)
Marital status - Now married (%)
Marital status - Separated (%)
Marital status - Widowed (%)
Marital status - Divorced (%)
Ancestries Reported - Arab (%)
Ancestries Reported - Czech (%)
Ancestries Reported - Danish (%)
Ancestries Reported - Dutch (%)
Ancestries Reported - English (%)
Ancestries Reported - French (%)
Ancestries Reported - French Canadian (%)
Ancestries Reported - German (%)
Ancestries Reported - Greek (%)
Ancestries Reported - Hungarian (%)
Ancestries Reported - Irish (%)
Ancestries Reported - Italian (%)
Ancestries Reported - Lithuanian (%)
Ancestries Reported - Norwegian (%)
Ancestries Reported - Polish (%)
Ancestries Reported - Portuguese (%)
Ancestries Reported - Russian (%)
Ancestries Reported - Scotch-Irish (%)
Ancestries Reported - Scottish (%)
Ancestries Reported - Slovak (%)
Ancestries Reported - Subsaharan African (%)
Ancestries Reported - Swedish (%)
Ancestries Reported - Swiss (%)
Ancestries Reported - Ukrainian (%)
Ancestries Reported - United States (%)
Ancestries Reported - Welsh (%)
Ancestries Reported - West Indian (%)
Ancestries Reported - Other (%)
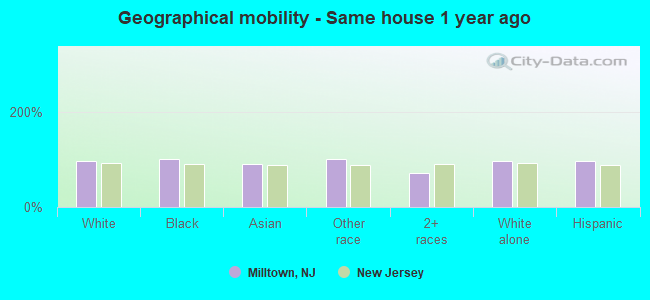
Geographical mobility - Same house 1 year ago (%)
Geographical mobility - Same house 1 year ago (%) - White
Geographical mobility - Same house 1 year ago (%) - Black or African American
Geographical mobility - Same house 1 year ago (%) - Asian
Geographical mobility - Same house 1 year ago (%) - Hispanic or Latino
Geographical mobility - Same house 1 year ago (%) - American Indian and Alaska Native
Geographical mobility - Same house 1 year ago (%) - Multirace
Geographical mobility - Same house 1 year ago (%) - Other Race
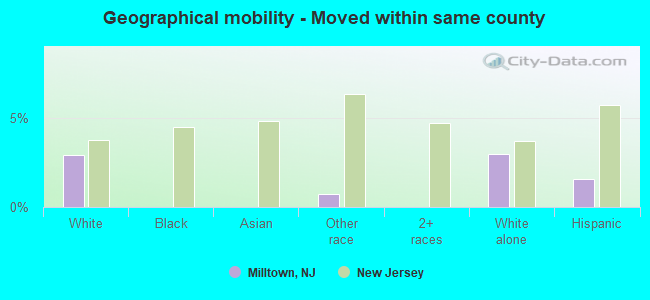
Geographical mobility - Moved within same county (%)
Geographical mobility - Moved within same county (%) - White
Geographical mobility - Moved within same county (%) - Black or African American
Geographical mobility - Moved within same county (%) - Asian
Geographical mobility - Moved within same county (%) - Hispanic or Latino
Geographical mobility - Moved within same county (%) - American Indian and Alaska Native
Geographical mobility - Moved within same county (%) - Multirace
Geographical mobility - Moved within same county (%) - Other Race
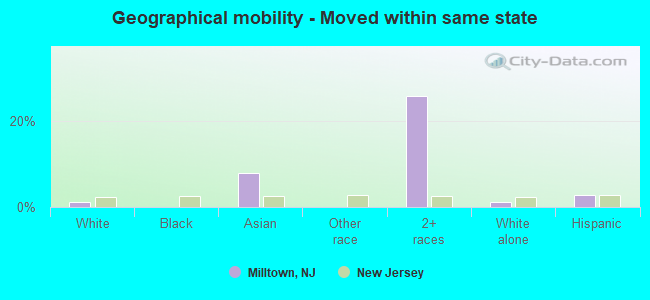
Geographical mobility - Moved from different county within same state (%)
Geographical mobility - Moved from different county within same state (%) - White
Geographical mobility - Moved from different county within same state (%) - Black or African American
Geographical mobility - Moved from different county within same state (%) - Asian
Geographical mobility - Moved from different county within same state (%) - Hispanic or Latino
Geographical mobility - Moved from different county within same state (%) - American Indian and Alaska Native
Geographical mobility - Moved from different county within same state (%) - Multirace
Geographical mobility - Moved from different county within same state (%) - Other Race
Geographical mobility - Moved from different state (%)
Geographical mobility - Moved from different state (%) - White
Geographical mobility - Moved from different state (%) - Black or African American
Geographical mobility - Moved from different state (%) - Asian
Geographical mobility - Moved from different state (%) - Hispanic or Latino
Geographical mobility - Moved from different state (%) - American Indian and Alaska Native
Geographical mobility - Moved from different state (%) - Multirace
Geographical mobility - Moved from different state (%) - Other Race
Geographical mobility - Moved from abroad (%)
Geographical mobility - Moved from abroad (%) - White
Geographical mobility - Moved from abroad (%) - Black or African American
Geographical mobility - Moved from abroad (%) - Asian
Geographical mobility - Moved from abroad (%) - Hispanic or Latino
Geographical mobility - Moved from abroad (%) - American Indian and Alaska Native
Geographical mobility - Moved from abroad (%) - Multirace
Geographical mobility - Moved from abroad (%) - Other Race
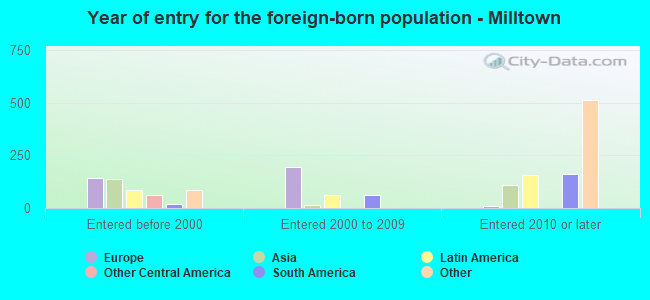
Place of birth for the foreign-born population - Ireland (%)
Place of birth for the foreign-born population - Denmark (%)
Place of birth for the foreign-born population - Norway (%)
Place of birth for the foreign-born population - Sweden (%)
Place of birth for the foreign-born population - United Kingdom (%)
Place of birth for the foreign-born population - England (%)
Place of birth for the foreign-born population - Scotland (%)
Place of birth for the foreign-born population - Other Northern Europe (%)
Place of birth for the foreign-born population - Austria (%)
Place of birth for the foreign-born population - Belgium (%)
Place of birth for the foreign-born population - France (%)
Place of birth for the foreign-born population - Germany (%)
Place of birth for the foreign-born population - Netherlands (%)
Place of birth for the foreign-born population - Switzerland (%)
Place of birth for the foreign-born population - Other Western Europe (%)
Place of birth for the foreign-born population - Greece (%)
Place of birth for the foreign-born population - Italy (%)
Place of birth for the foreign-born population - Portugal (%)
Place of birth for the foreign-born population - Spain (%)
Place of birth for the foreign-born population - Other Southern Europe (%)
Place of birth for the foreign-born population - Albania (%)
Place of birth for the foreign-born population - Belarus (%)
Place of birth for the foreign-born population - Bosnia and Herzegovina (%)
Place of birth for the foreign-born population - Bulgaria (%)
Place of birth for the foreign-born population - Croatia (%)
Place of birth for the foreign-born population - Czechoslovakia (%)
Place of birth for the foreign-born population - Hungary (%)
Place of birth for the foreign-born population - Latvia (%)
Place of birth for the foreign-born population - Lithuania (%)
Place of birth for the foreign-born population - North Macedonia (Macedonia) (%)
Place of birth for the foreign-born population - Moldova (%)
Place of birth for the foreign-born population - Poland (%)
Place of birth for the foreign-born population - Romania (%)
Place of birth for the foreign-born population - Russia (%)
Place of birth for the foreign-born population - Serbia (%)
Place of birth for the foreign-born population - Ukraine (%)
Place of birth for the foreign-born population - Other Eastern Europe (%)
Place of birth for the foreign-born population - China (%)
Place of birth for the foreign-born population - Hong Kong (%)
Place of birth for the foreign-born population - Taiwan (%)
Place of birth for the foreign-born population - Japan (%)
Place of birth for the foreign-born population - Korea (%)
Place of birth for the foreign-born population - Other Eastern Asia (%)
Place of birth for the foreign-born population - Afghanistan (%)
Place of birth for the foreign-born population - Bangladesh (%)
Place of birth for the foreign-born population - India (%)
Place of birth for the foreign-born population - Iran (%)
Place of birth for the foreign-born population - Kazakhstan (%)
Place of birth for the foreign-born population - Nepal (%)
Place of birth for the foreign-born population - Pakistan (%)
Place of birth for the foreign-born population - Sri Lanka (%)
Place of birth for the foreign-born population - Uzbekistan (%)
Place of birth for the foreign-born population - Other South Central Asia (%)
Place of birth for the foreign-born population - Burma (%)
Place of birth for the foreign-born population - Cambodia (%)
Place of birth for the foreign-born population - Indonesia (%)
Place of birth for the foreign-born population - Laos (%)
Place of birth for the foreign-born population - Malaysia (%)
Place of birth for the foreign-born population - Philippines (%)
Place of birth for the foreign-born population - Singapore (%)
Place of birth for the foreign-born population - Thailand (%)
Place of birth for the foreign-born population - Vietnam (%)
Place of birth for the foreign-born population - Other South Eastern Asia (%)
Place of birth for the foreign-born population - Armenia (%)
Place of birth for the foreign-born population - Iraq (%)
Place of birth for the foreign-born population - Israel (%)
Place of birth for the foreign-born population - Jordan (%)
Place of birth for the foreign-born population - Kuwait (%)
Place of birth for the foreign-born population - Lebanon (%)
Place of birth for the foreign-born population - Saudi Arabia (%)
Place of birth for the foreign-born population - Syria (%)
Place of birth for the foreign-born population - Turkey (%)
Place of birth for the foreign-born population - Yemen (%)
Place of birth for the foreign-born population - Other Western Asia (%)
Place of birth for the foreign-born population - Eritrea (%)
Place of birth for the foreign-born population - Ethiopia (%)
Place of birth for the foreign-born population - Kenya (%)
Place of birth for the foreign-born population - Somalia (%)
Place of birth for the foreign-born population - Uganda (%)
Place of birth for the foreign-born population - Zimbabwe (%)
Place of birth for the foreign-born population - Other Eastern Africa (%)
Place of birth for the foreign-born population - Cameroon (%)
Place of birth for the foreign-born population - Congo (%)
Place of birth for the foreign-born population - Democratic Republic of Congo (Zaire) (%)
Place of birth for the foreign-born population - Other Middle Africa (%)
Place of birth for the foreign-born population - Egypt (%)
Place of birth for the foreign-born population - Morocco (%)
Place of birth for the foreign-born population - Sudan (%)
Place of birth for the foreign-born population - Other Northern Africa (%)
Place of birth for the foreign-born population - South Africa (%)
Place of birth for the foreign-born population - Other Southern Africa (%)
Place of birth for the foreign-born population - Cabo Verde (%)
Place of birth for the foreign-born population - Ghana (%)
Place of birth for the foreign-born population - Liberia (%)
Place of birth for the foreign-born population - Nigeria (%)
Place of birth for the foreign-born population - Senegal (%)
Place of birth for the foreign-born population - Sierra Leone (%)
Place of birth for the foreign-born population - Other Western Africa (%)
Place of birth for the foreign-born population - Australia (%)
Place of birth for the foreign-born population - New Zealand (%)
Place of birth for the foreign-born population - Fiji (%)
Place of birth for the foreign-born population - Micronesia (%)
Place of birth for the foreign-born population - Bahamas (%)
Place of birth for the foreign-born population - Barbados (%)
Place of birth for the foreign-born population - Cuba (%)
Place of birth for the foreign-born population - Dominica (%)
Place of birth for the foreign-born population - Dominican Republic (%)
Place of birth for the foreign-born population - Grenada (%)
Place of birth for the foreign-born population - Haiti (%)
Place of birth for the foreign-born population - Jamaica (%)
Place of birth for the foreign-born population - St. Vincent and the Grenadines (%)
Place of birth for the foreign-born population - Trinidad and Tobago (%)
Place of birth for the foreign-born population - West Indies (%)
Place of birth for the foreign-born population - Other Caribbean (%)
Place of birth for the foreign-born population - Belize (%)
Place of birth for the foreign-born population - Costa Rica (%)
Place of birth for the foreign-born population - El Salvador (%)
Place of birth for the foreign-born population - Guatemala (%)
Place of birth for the foreign-born population - Honduras (%)
Place of birth for the foreign-born population - Mexico (%)
Place of birth for the foreign-born population - Nicaragua (%)
Place of birth for the foreign-born population - Panama (%)
Place of birth for the foreign-born population - Other Central America (%)
Place of birth for the foreign-born population - Argentina (%)
Place of birth for the foreign-born population - Bolivia (%)
Place of birth for the foreign-born population - Brazil (%)
Place of birth for the foreign-born population - Chile (%)
Place of birth for the foreign-born population - Colombia (%)
Place of birth for the foreign-born population - Ecuador (%)
Place of birth for the foreign-born population - Guyana (%)
Place of birth for the foreign-born population - Peru (%)
Place of birth for the foreign-born population - Uruguay (%)
Place of birth for the foreign-born population - Venezuela (%)
Place of birth for the foreign-born population - Other South America (%)
Place of birth for the foreign-born population - Canada (%)
Place of birth for the foreign-born population - Other Northern America (%)
Place of birth for the foreign-born population - Other (%)
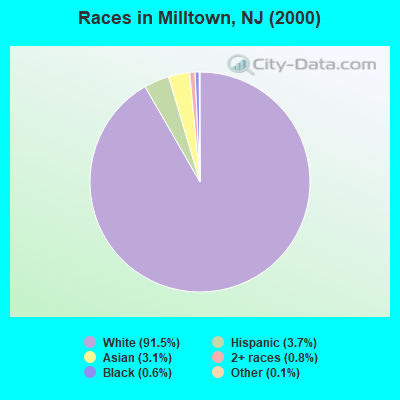
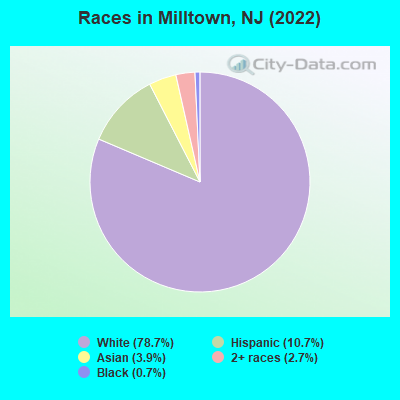
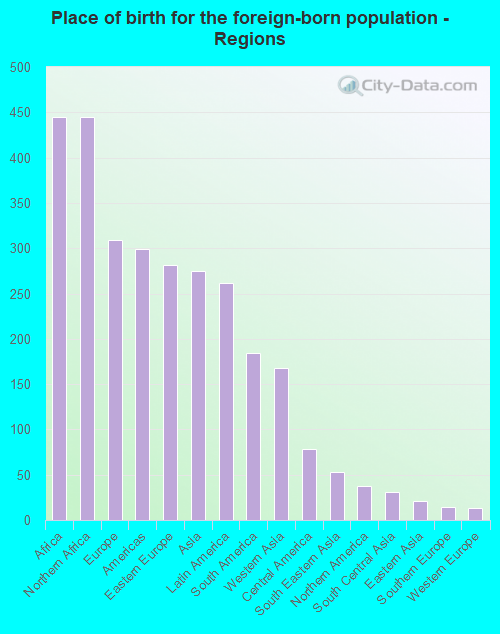
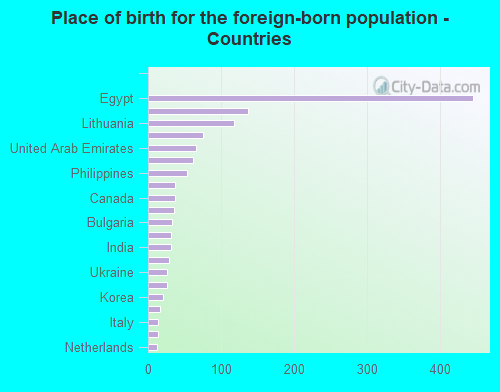
According to 2022 data, the most numerous races in Milltown, NJ are White alone (5,533 residents), Hispanic (751 residents), and Black alone (46 residents). 74.3% of Milltown residents speak English at home. 18.9% of Milltown, NJ residents are foreign-born (6.2% born in Africa, 4.3% born in Europe, 3.9% born in Asia, 3.7% born in Latin America), which is 21.6% less than the foreign-born rate of 23.0% across the entire state of New Jersey.
Race distribution in Milltown
2000 2022
5,557,209 66.0% White alone 1,117,191 13.3% Hispanic 1,096,171 13.0% Black alone 477,012 5.7% Asian alone 133,689 1.6% Two or more races 19,565 0.2% Other race alone 11,338 0.1% American Indian alone 2,175 0.03% Native Hawaiian and Other
4,766,476 51.5% White alone 2,028,470 21.9% Hispanic 1,111,632 12.0% Black alone 923,546 10.0% Asian alone 332,237 3.6% Two or more races 89,847 1.0% Other race alone 8,557 0.09% American Indian alone 934 0.01% Native Hawaiian and Other
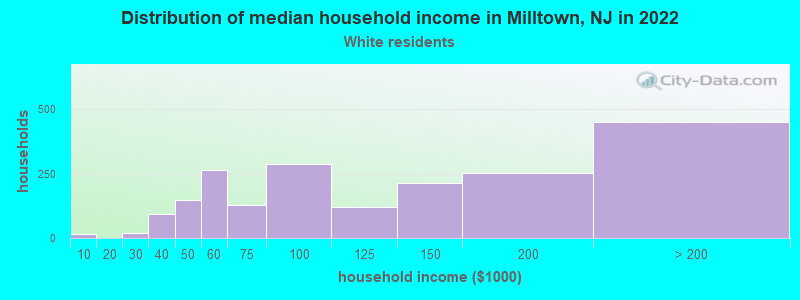
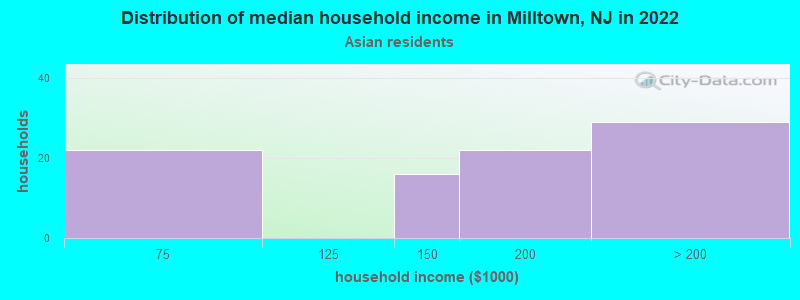
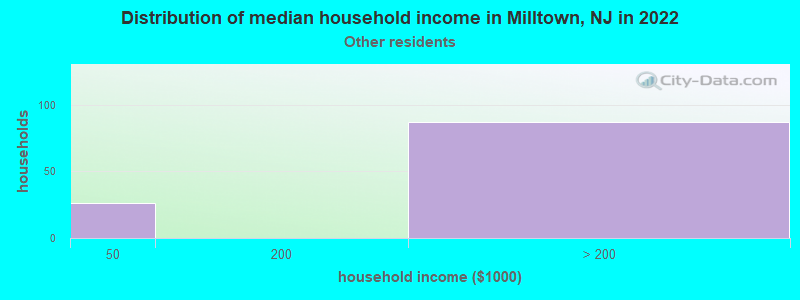
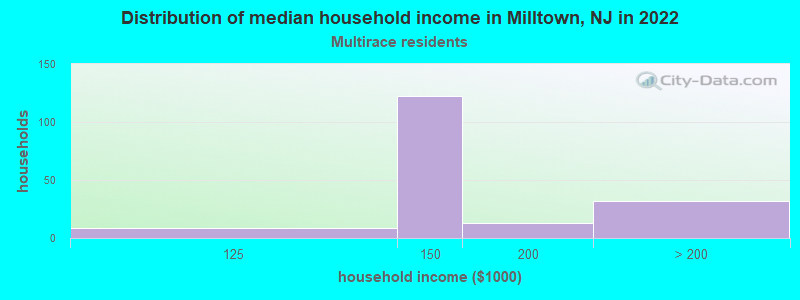
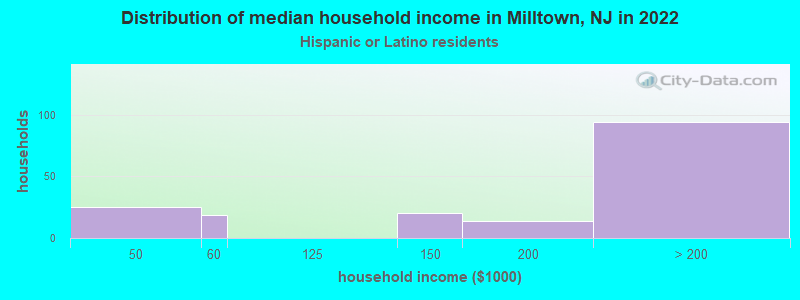
Income and house value in Milltown Median household income in 2022 $103,816 White non-Hispanic householders$171,968 Asian householders$123,222 Two or more races householdersover $200,000 Hispanic or Latino race householdersMedian 2022 house value $436,492 White Non-Hispanic householders $718,331 Asian householders$556,750 Two or more races householders$634,200 Hispanic or Latino householders
Median age by race in Milltown
46.2 Median age for White residents39.7 48.5 -661,246,611.8 Median age for Black or African American residents-679,886,684.9 -639,175,257.1 -673,036,092.7 Median age for American Indian / Alaska Native residents-624,624,624.0 -739,999,999.3 31.5 Median age for Asian residents31.0 32.9 -939,393,938.5 Median age for Native Hawaiian / Pacific Islander residents-860,335,194.7 -713,070,378.3 45.2 Median age for Other race residents36.7 46.3 38.4 Median age for Two or more races residents37.1 36.4 44.5 Median age for White alone residents38.9 46.3 32.7 Median age for Hispanic or Latino residents32.1 34.2
Owner/renter occupied households by race in Milltown
House owners and renters - White residents 1,669 82.6% Owner occupied352 17.4% Renter occupiedHouse owners and renters - Black or African American residents 21 100.0% Owner occupiedHouse owners and renters - Asian residents 92 100.0% Owner occupiedHouse owners and renters - Other race residents 81 71.3% Owner occupied33 28.7% Renter occupiedHouse owners and renters - Two or more races residents 161 94.0% Owner occupied10 6.0% Renter occupiedHouse owners and renters - White alone residents 1,699 79.8% Owner occupied431 20.2% Renter occupiedHouse owners and renters - Hispanic or Latino residents 164 88.5% Owner occupied21 11.5% Renter occupied
Language usage in Milltown
English speakers - Total 74.3% of residents of Milltown speak English at home.
5.9% of residents speak Spanish at home 345 90.6% Speak English very well36 9.4% Speak English less than very well19.4% of residents speak other language at home 654 52.0% Speak English very well603 48.0% Speak English less than very well
English speakers - Born in the United States 88.6% of residents of Milltown speak English at home.
11.6% of residents speak Spanish at home 86 83.5% Speak English very well17 16.5% Speak English less than very well
English speakers - Native, born elsewhere 0.0% of residents of Milltown speak English at home.
100.0% of residents speak other language at home 35 100.0% Speak English very well
English speakers - Foreign-born 6.1% of residents of Milltown speak English at home.
9.9% of residents speak Spanish at home 136 100.0% Speak English very well80.8% of residents speak other language at home 538 48.6% Speak English very well569 51.4% Speak English less than very well
White (Caucasian) - Speak only English Native:
100.0% (4,018)Foreign-born:
7.7% (49)
White (Caucasian) - Speak another language Native:
2.6% (106)Foreign-born:
87.9% (565)
Asian - Speak only English Native:
78.4% (127)Foreign-born:
22.9% (24)
Asian - Speak another language Native:
20.3% (33)Foreign-born:
78.4% (83)
Other race - Speak only English Native:
66.9% (224)Foreign-born:
9.1% (9)
Other race - Speak another language Native:
42.1% (141)Foreign-born:
91.4% (94)
Two or more races - Speak another language Native:
49.5% (100)Foreign-born:
100.0% (286)
White alone - Speak only English Native:
98.5% (4,146)Foreign-born:
4.0% (36)
White alone - Speak another language Native:
2.6% (110)Foreign-born:
94.2% (845)
Hispanic or Latino - Speak only English Native:
54.8% (263)Foreign-born:
15.0% (28)
Hispanic or Latino - Speak another language Native:
47.0% (225)Foreign-born:
87.7% (161)
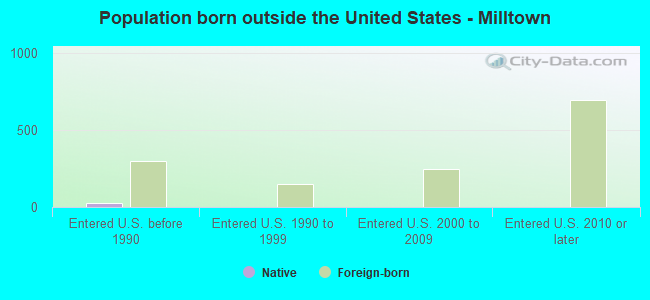
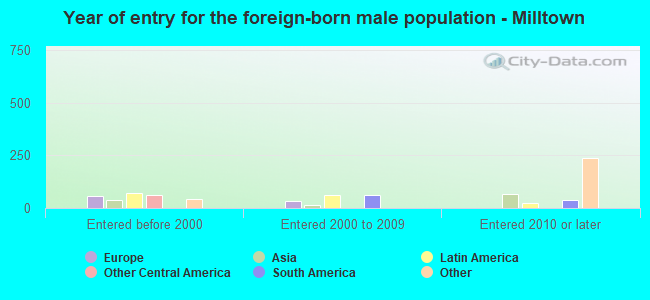
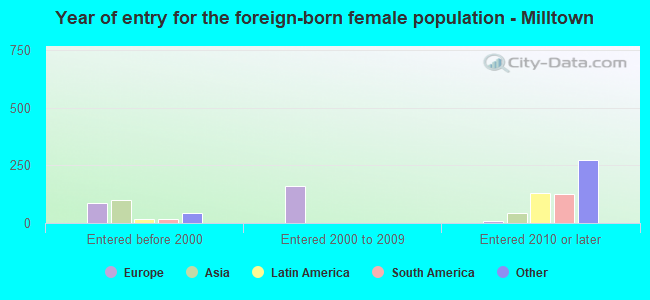
Foreign-born residents in Milltown 1,329 residents are foreign born (6.2% Africa , 4.3% Europe , 3.9% Asia , 3.7% Latin America ).
This city:
18.9%New Jersey:
23.2%
Marital status for residents in Milltown Marital status - White (Caucasian) population 15 years and over
Males 21.3% Never married71.6% Now married0.7% Separated0.7% Widowed5.7% DivorcedFemales 17.1% Never married48.2% Now married2.2% Separated15.2% Widowed17.3% DivorcedWomen who gave birth in the past 12 months Now married:
100.0% (69)Unmarried:
0.0% (0)
Women who did not give birth in the past 12 months Now married:
59.6% (610)Unmarried:
40.4% (414)
Marital status - Black or African American population 15 years and over
Males 0.0% Never married100.0% Now married0.0% Separated0.0% Widowed0.0% DivorcedFemales 0.0% Never married100.0% Now married0.0% Separated0.0% Widowed0.0% DivorcedMarital status - Asian population 15 years and over
Males 25.0% Never married42.0% Now married0.0% Separated0.0% Widowed33.0% DivorcedFemales 12.3% Never married87.7% Now married0.0% Separated0.0% Widowed0.0% DivorcedWomen who did not give birth in the past 12 months Now married:
80.9% (39)Unmarried:
19.1% (9)
Marital status - Other race population 15 years and over
Males 46.1% Never married53.9% Now married0.0% Separated0.0% Widowed0.0% DivorcedFemales 0.0% Never married100.0% Now married0.0% Separated0.0% Widowed0.0% DivorcedWomen who did not give birth in the past 12 months Now married:
100.0% (76)Unmarried:
0.0% (0)
Marital status - Two or more races population 15 years and over
Males 21.9% Never married35.6% Now married0.0% Separated0.0% Widowed42.5% DivorcedFemales 21.7% Never married46.5% Now married0.0% Separated0.0% Widowed31.8% DivorcedWomen who gave birth in the past 12 months Now married:
0.0% (0)Unmarried:
100.0% (91)
Women who did not give birth in the past 12 months Now married:
47.8% (57)Unmarried:
52.2% (62)
Marital status - White alone, not Hispanic / Latino population 15 years and over
Males 20.4% Never married72.2% Now married0.7% Separated0.7% Widowed5.9% DivorcedFemales 16.2% Never married48.5% Now married2.2% Separated15.5% Widowed17.6% DivorcedWomen who gave birth in the past 12 months Now married:
100.0% (81)Unmarried:
0.0% (0)
Women who did not give birth in the past 12 months Now married:
60.7% (705)Unmarried:
39.3% (456)
Marital status - Hispanic or Latino population 15 years and over
Males 43.5% Never married56.5% Now married0.0% Separated0.0% Widowed0.0% DivorcedFemales 33.8% Never married66.2% Now married0.0% Separated0.0% Widowed0.0% DivorcedWomen who did not give birth in the past 12 months Now married:
57.7% (106)Unmarried:
42.3% (78)
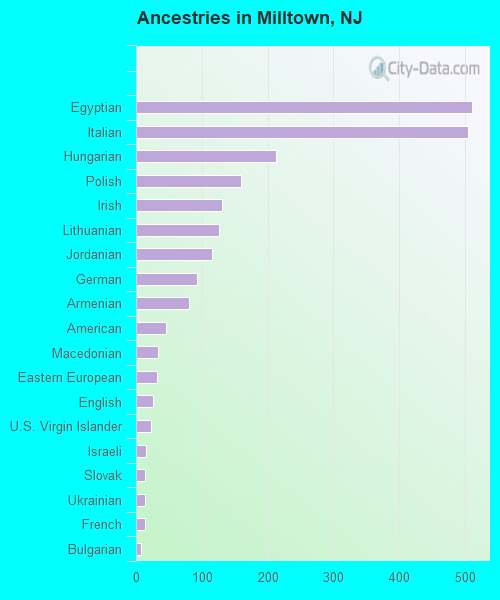
Ancestries in Milltown
511 19.2% Egyptian505 19.0% Italian213 8.0% Hungarian159 6.0% Polish131 4.9% Irish126 4.7% Lithuanian116 4.4% Jordanian93 3.5% German81 3.0% Armenian45 1.7% American33 1.2% Macedonian32 1.2% Eastern European26 1.0% English23 0.9% U.S. Virgin Islander15 0.6% Israeli14 0.5% Slovak14 0.5% Ukrainian13 0.5% French7 0.3% Bulgarian4 0.2% Brazilian
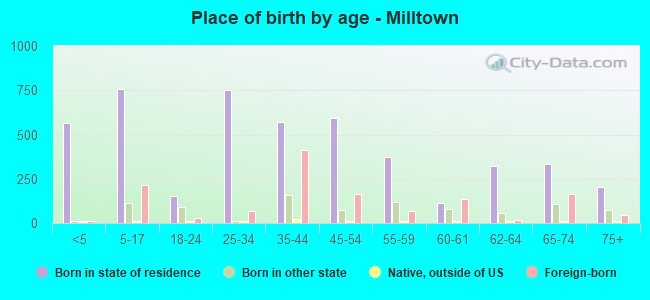
Children Nativity (place of birth) in Milltown
Children under 6 years - Living with two parents Both parents native 471 100.0% NativeBoth parents foreign-born 66 81.4% Native15 18.6% Foreign-bornOne native, one foreign-born parent 19 100.0% NativeChildren under 6 years - Living with one parent Native parent 47 100.0% NativeForeign-born parent 44 100.0% NativeChildren 6 to 17 years - Living with two parents Both parents native 443 100.0% NativeBoth parents foreign-born 15 7.8% Native180 92.2% Foreign-bornOne native, one foreign-born parent 68 100.0% NativeChildren 6 to 17 years - Living with one parent Native parent 246 100.0% NativeForeign-born parent 26 52.6% Native23 47.4% Foreign-born
Grandparents responsible for own grandchildren in Milltown
Grandparents (30 to 59 years) White / Caucasian 12 100.0% Not responsible for grandchildrenWhite alone, not Hispanic / Latino 14 100.0% Not responsible for grandchildren
Grandparents (60 years and over) White / Caucasian 70 100.0% Not responsible for grandchildrenWhite alone, not Hispanic / Latino 82 100.0% Not responsible for grandchildren