Races in Milton, Florida (FL) Detailed Stats
Data:
Races - White alone (%)
Races - White alone (% change since 2000)
Races - Black alone (%)
Races - Black alone (% change since 2000)
Races - American Indian alone (%)
Races - American Indian alone (% change since 2000)
Races - Asian alone (%)
Races - Asian alone (% change since 2000)
Races - Hispanic (%)
Races - Hispanic (% change since 2000)
Races - Native Hawaiian and Other Pacific Islander alone (%)
Races - Native Hawaiian and Other Pacific Islander alone (% change since 2000)
Races - Two or more races(%)
Races - Two or more races(% change since 2000)
Races - Other race alone (%)
Races - Other race alone (% change since 2000)
Racial diversity
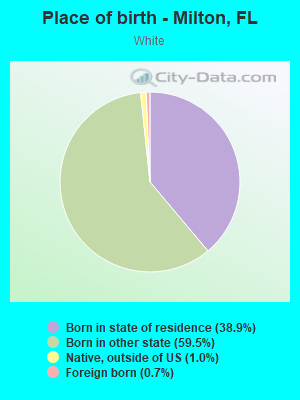
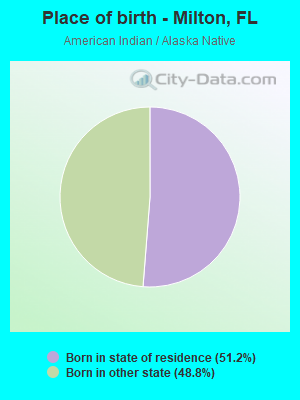
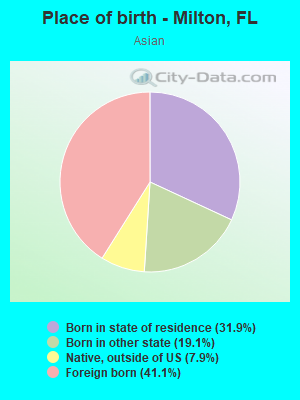
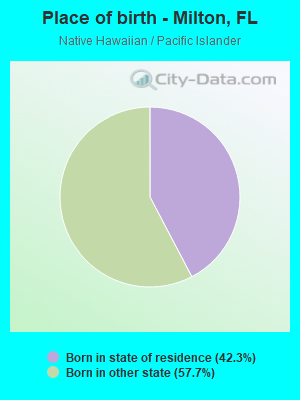
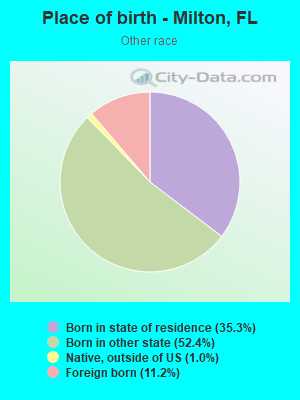
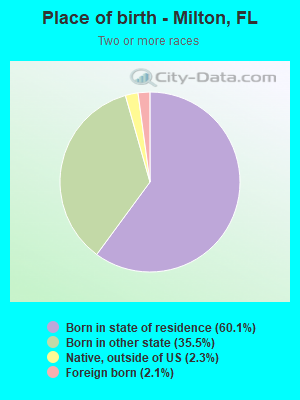
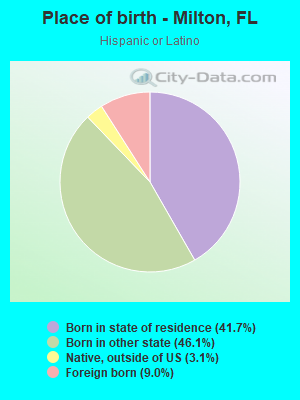
Place of birth - Born in state of residence (%)
Place of birth - Born in state of residence (%) - White
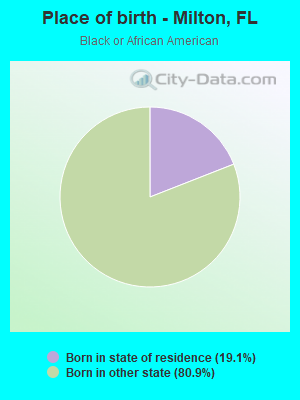
Place of birth - Born in state of residence (%) - Black or African American
Place of birth - Born in state of residence (%) - Asian
Place of birth - Born in state of residence (%) - Hispanic or Latino
Place of birth - Born in state of residence (%) - American Indian and Alaska Native
Place of birth - Born in state of residence (%) - Multirace
Place of birth - Born in state of residence (%) - Other Race
Place of birth - Born in other state (%)
Place of birth - Born in other state (%) - White
Place of birth - Born in other state (%) - Black or African American
Place of birth - Born in other state (%) - Asian
Place of birth - Born in other state (%) - Hispanic or Latino
Place of birth - Born in other state (%) - American Indian and Alaska Native
Place of birth - Born in other state (%) - Multirace
Place of birth - Born in other state (%) - Other Race
Place of birth - Native, outside of US (%)
Place of birth - Native, outside of US (%) - White
Place of birth - Native, outside of US (%) - Black or African American
Place of birth - Native, outside of US (%) - Asian
Place of birth - Native, outside of US (%) - Hispanic or Latino
Place of birth - Native, outside of US (%) - American Indian and Alaska Native
Place of birth - Native, outside of US (%) - Multirace
Place of birth - Native, outside of US (%) - Other Race
Place of birth - Foreign born (%)
Place of birth - Foreign born (%) - White
Place of birth - Foreign born (%) - Black or African American
Place of birth - Foreign born (%) - Asian
Place of birth - Foreign born (%) - Hispanic or Latino
Place of birth - Foreign born (%) - American Indian and Alaska Native
Place of birth - Foreign born (%) - Multirace
Place of birth - Foreign born (%) - Other Race
Residents speaking English at home (%)
Residents speaking English at home - Born in the United States (%)
Residents speaking English at home - Native, born elsewhere (%)
Residents speaking English at home - Foreign born (%)
Residents speaking Spanish at home (%)
Residents speaking Spanish at home - Born in the United States (%)
Residents speaking Spanish at home - Native, born elsewhere (%)
Residents speaking Spanish at home - Foreign born (%)
Residents speaking other language at home (%)
Residents speaking other language at home - Born in the United States (%)
Residents speaking other language at home - Native, born elsewhere (%)
Residents speaking other language at home - Foreign born (%)
Marital status - Never married (%)
Marital status - Now married (%)
Marital status - Separated (%)
Marital status - Widowed (%)
Marital status - Divorced (%)
Ancestries Reported - Arab (%)
Ancestries Reported - Czech (%)
Ancestries Reported - Danish (%)
Ancestries Reported - Dutch (%)
Ancestries Reported - English (%)
Ancestries Reported - French (%)
Ancestries Reported - French Canadian (%)
Ancestries Reported - German (%)
Ancestries Reported - Greek (%)
Ancestries Reported - Hungarian (%)
Ancestries Reported - Irish (%)
Ancestries Reported - Italian (%)
Ancestries Reported - Lithuanian (%)
Ancestries Reported - Norwegian (%)
Ancestries Reported - Polish (%)
Ancestries Reported - Portuguese (%)
Ancestries Reported - Russian (%)
Ancestries Reported - Scotch-Irish (%)
Ancestries Reported - Scottish (%)
Ancestries Reported - Slovak (%)
Ancestries Reported - Subsaharan African (%)
Ancestries Reported - Swedish (%)
Ancestries Reported - Swiss (%)
Ancestries Reported - Ukrainian (%)
Ancestries Reported - United States (%)
Ancestries Reported - Welsh (%)
Ancestries Reported - West Indian (%)
Ancestries Reported - Other (%)
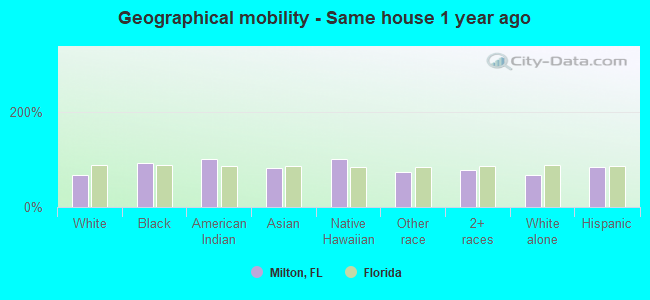
Geographical mobility - Same house 1 year ago (%)
Geographical mobility - Same house 1 year ago (%) - White
Geographical mobility - Same house 1 year ago (%) - Black or African American
Geographical mobility - Same house 1 year ago (%) - Asian
Geographical mobility - Same house 1 year ago (%) - Hispanic or Latino
Geographical mobility - Same house 1 year ago (%) - American Indian and Alaska Native
Geographical mobility - Same house 1 year ago (%) - Multirace
Geographical mobility - Same house 1 year ago (%) - Other Race
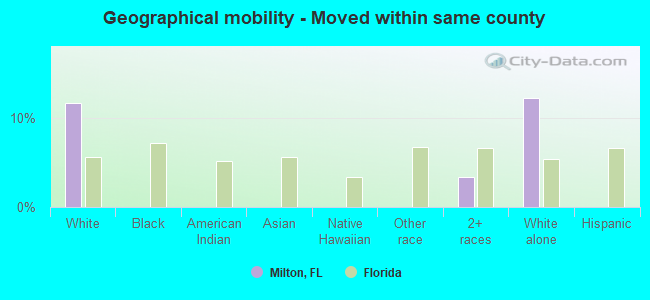
Geographical mobility - Moved within same county (%)
Geographical mobility - Moved within same county (%) - White
Geographical mobility - Moved within same county (%) - Black or African American
Geographical mobility - Moved within same county (%) - Asian
Geographical mobility - Moved within same county (%) - Hispanic or Latino
Geographical mobility - Moved within same county (%) - American Indian and Alaska Native
Geographical mobility - Moved within same county (%) - Multirace
Geographical mobility - Moved within same county (%) - Other Race
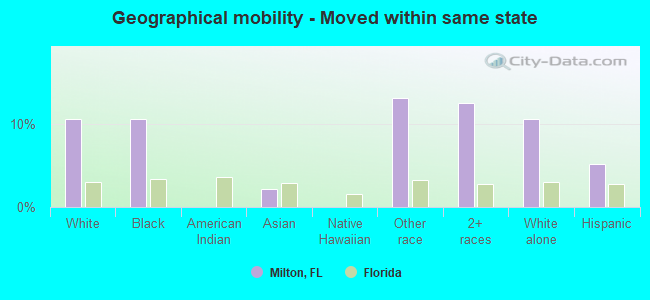
Geographical mobility - Moved from different county within same state (%)
Geographical mobility - Moved from different county within same state (%) - White
Geographical mobility - Moved from different county within same state (%) - Black or African American
Geographical mobility - Moved from different county within same state (%) - Asian
Geographical mobility - Moved from different county within same state (%) - Hispanic or Latino
Geographical mobility - Moved from different county within same state (%) - American Indian and Alaska Native
Geographical mobility - Moved from different county within same state (%) - Multirace
Geographical mobility - Moved from different county within same state (%) - Other Race
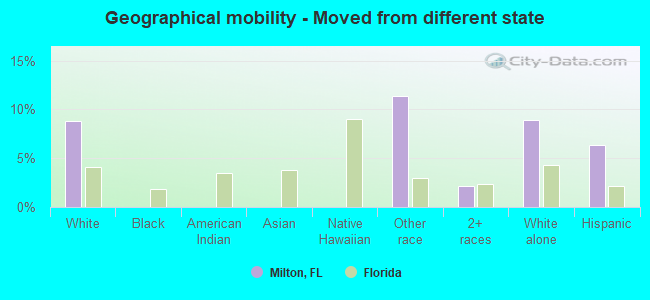
Geographical mobility - Moved from different state (%)
Geographical mobility - Moved from different state (%) - White
Geographical mobility - Moved from different state (%) - Black or African American
Geographical mobility - Moved from different state (%) - Asian
Geographical mobility - Moved from different state (%) - Hispanic or Latino
Geographical mobility - Moved from different state (%) - American Indian and Alaska Native
Geographical mobility - Moved from different state (%) - Multirace
Geographical mobility - Moved from different state (%) - Other Race
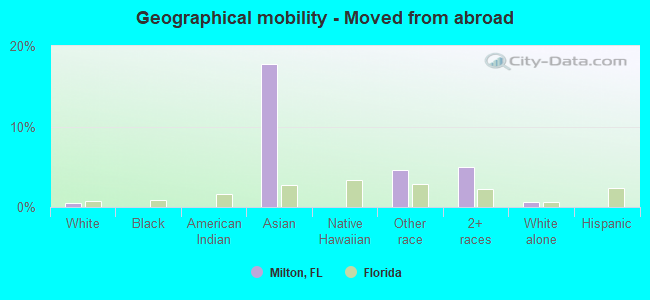
Geographical mobility - Moved from abroad (%)
Geographical mobility - Moved from abroad (%) - White
Geographical mobility - Moved from abroad (%) - Black or African American
Geographical mobility - Moved from abroad (%) - Asian
Geographical mobility - Moved from abroad (%) - Hispanic or Latino
Geographical mobility - Moved from abroad (%) - American Indian and Alaska Native
Geographical mobility - Moved from abroad (%) - Multirace
Geographical mobility - Moved from abroad (%) - Other Race
Place of birth for the foreign-born population - Ireland (%)
Place of birth for the foreign-born population - Denmark (%)
Place of birth for the foreign-born population - Norway (%)
Place of birth for the foreign-born population - Sweden (%)
Place of birth for the foreign-born population - United Kingdom (%)
Place of birth for the foreign-born population - England (%)
Place of birth for the foreign-born population - Scotland (%)
Place of birth for the foreign-born population - Other Northern Europe (%)
Place of birth for the foreign-born population - Austria (%)
Place of birth for the foreign-born population - Belgium (%)
Place of birth for the foreign-born population - France (%)
Place of birth for the foreign-born population - Germany (%)
Place of birth for the foreign-born population - Netherlands (%)
Place of birth for the foreign-born population - Switzerland (%)
Place of birth for the foreign-born population - Other Western Europe (%)
Place of birth for the foreign-born population - Greece (%)
Place of birth for the foreign-born population - Italy (%)
Place of birth for the foreign-born population - Portugal (%)
Place of birth for the foreign-born population - Spain (%)
Place of birth for the foreign-born population - Other Southern Europe (%)
Place of birth for the foreign-born population - Albania (%)
Place of birth for the foreign-born population - Belarus (%)
Place of birth for the foreign-born population - Bosnia and Herzegovina (%)
Place of birth for the foreign-born population - Bulgaria (%)
Place of birth for the foreign-born population - Croatia (%)
Place of birth for the foreign-born population - Czechoslovakia (%)
Place of birth for the foreign-born population - Hungary (%)
Place of birth for the foreign-born population - Latvia (%)
Place of birth for the foreign-born population - Lithuania (%)
Place of birth for the foreign-born population - North Macedonia (Macedonia) (%)
Place of birth for the foreign-born population - Moldova (%)
Place of birth for the foreign-born population - Poland (%)
Place of birth for the foreign-born population - Romania (%)
Place of birth for the foreign-born population - Russia (%)
Place of birth for the foreign-born population - Serbia (%)
Place of birth for the foreign-born population - Ukraine (%)
Place of birth for the foreign-born population - Other Eastern Europe (%)
Place of birth for the foreign-born population - China (%)
Place of birth for the foreign-born population - Hong Kong (%)
Place of birth for the foreign-born population - Taiwan (%)
Place of birth for the foreign-born population - Japan (%)
Place of birth for the foreign-born population - Korea (%)
Place of birth for the foreign-born population - Other Eastern Asia (%)
Place of birth for the foreign-born population - Afghanistan (%)
Place of birth for the foreign-born population - Bangladesh (%)
Place of birth for the foreign-born population - India (%)
Place of birth for the foreign-born population - Iran (%)
Place of birth for the foreign-born population - Kazakhstan (%)
Place of birth for the foreign-born population - Nepal (%)
Place of birth for the foreign-born population - Pakistan (%)
Place of birth for the foreign-born population - Sri Lanka (%)
Place of birth for the foreign-born population - Uzbekistan (%)
Place of birth for the foreign-born population - Other South Central Asia (%)
Place of birth for the foreign-born population - Burma (%)
Place of birth for the foreign-born population - Cambodia (%)
Place of birth for the foreign-born population - Indonesia (%)
Place of birth for the foreign-born population - Laos (%)
Place of birth for the foreign-born population - Malaysia (%)
Place of birth for the foreign-born population - Philippines (%)
Place of birth for the foreign-born population - Singapore (%)
Place of birth for the foreign-born population - Thailand (%)
Place of birth for the foreign-born population - Vietnam (%)
Place of birth for the foreign-born population - Other South Eastern Asia (%)
Place of birth for the foreign-born population - Armenia (%)
Place of birth for the foreign-born population - Iraq (%)
Place of birth for the foreign-born population - Israel (%)
Place of birth for the foreign-born population - Jordan (%)
Place of birth for the foreign-born population - Kuwait (%)
Place of birth for the foreign-born population - Lebanon (%)
Place of birth for the foreign-born population - Saudi Arabia (%)
Place of birth for the foreign-born population - Syria (%)
Place of birth for the foreign-born population - Turkey (%)
Place of birth for the foreign-born population - Yemen (%)
Place of birth for the foreign-born population - Other Western Asia (%)
Place of birth for the foreign-born population - Eritrea (%)
Place of birth for the foreign-born population - Ethiopia (%)
Place of birth for the foreign-born population - Kenya (%)
Place of birth for the foreign-born population - Somalia (%)
Place of birth for the foreign-born population - Uganda (%)
Place of birth for the foreign-born population - Zimbabwe (%)
Place of birth for the foreign-born population - Other Eastern Africa (%)
Place of birth for the foreign-born population - Cameroon (%)
Place of birth for the foreign-born population - Congo (%)
Place of birth for the foreign-born population - Democratic Republic of Congo (Zaire) (%)
Place of birth for the foreign-born population - Other Middle Africa (%)
Place of birth for the foreign-born population - Egypt (%)
Place of birth for the foreign-born population - Morocco (%)
Place of birth for the foreign-born population - Sudan (%)
Place of birth for the foreign-born population - Other Northern Africa (%)
Place of birth for the foreign-born population - South Africa (%)
Place of birth for the foreign-born population - Other Southern Africa (%)
Place of birth for the foreign-born population - Cabo Verde (%)
Place of birth for the foreign-born population - Ghana (%)
Place of birth for the foreign-born population - Liberia (%)
Place of birth for the foreign-born population - Nigeria (%)
Place of birth for the foreign-born population - Senegal (%)
Place of birth for the foreign-born population - Sierra Leone (%)
Place of birth for the foreign-born population - Other Western Africa (%)
Place of birth for the foreign-born population - Australia (%)
Place of birth for the foreign-born population - New Zealand (%)
Place of birth for the foreign-born population - Fiji (%)
Place of birth for the foreign-born population - Micronesia (%)
Place of birth for the foreign-born population - Bahamas (%)
Place of birth for the foreign-born population - Barbados (%)
Place of birth for the foreign-born population - Cuba (%)
Place of birth for the foreign-born population - Dominica (%)
Place of birth for the foreign-born population - Dominican Republic (%)
Place of birth for the foreign-born population - Grenada (%)
Place of birth for the foreign-born population - Haiti (%)
Place of birth for the foreign-born population - Jamaica (%)
Place of birth for the foreign-born population - St. Vincent and the Grenadines (%)
Place of birth for the foreign-born population - Trinidad and Tobago (%)
Place of birth for the foreign-born population - West Indies (%)
Place of birth for the foreign-born population - Other Caribbean (%)
Place of birth for the foreign-born population - Belize (%)
Place of birth for the foreign-born population - Costa Rica (%)
Place of birth for the foreign-born population - El Salvador (%)
Place of birth for the foreign-born population - Guatemala (%)
Place of birth for the foreign-born population - Honduras (%)
Place of birth for the foreign-born population - Mexico (%)
Place of birth for the foreign-born population - Nicaragua (%)
Place of birth for the foreign-born population - Panama (%)
Place of birth for the foreign-born population - Other Central America (%)
Place of birth for the foreign-born population - Argentina (%)
Place of birth for the foreign-born population - Bolivia (%)
Place of birth for the foreign-born population - Brazil (%)
Place of birth for the foreign-born population - Chile (%)
Place of birth for the foreign-born population - Colombia (%)
Place of birth for the foreign-born population - Ecuador (%)
Place of birth for the foreign-born population - Guyana (%)
Place of birth for the foreign-born population - Peru (%)
Place of birth for the foreign-born population - Uruguay (%)
Place of birth for the foreign-born population - Venezuela (%)
Place of birth for the foreign-born population - Other South America (%)
Place of birth for the foreign-born population - Canada (%)
Place of birth for the foreign-born population - Other Northern America (%)
Place of birth for the foreign-born population - Other (%)
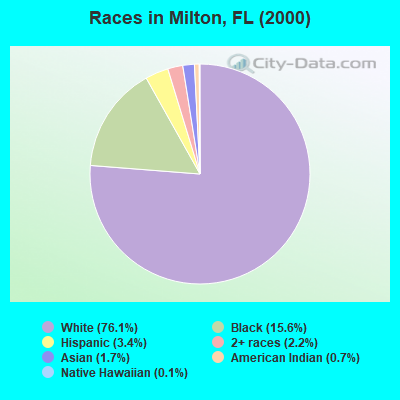
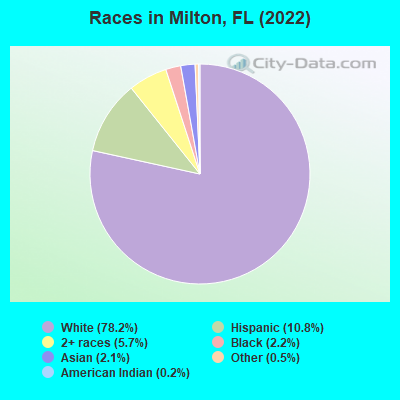
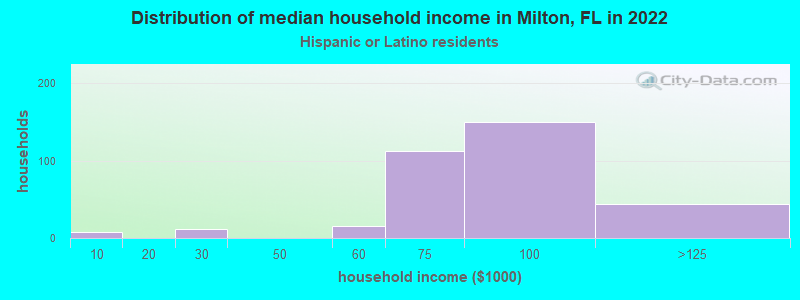
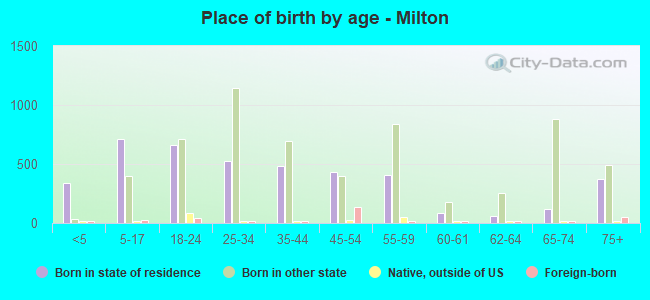
According to 2022 data, the most numerous races in Milton, FL are White alone (8,415 residents), Hispanic (1,167 residents), and Black alone (232 residents). 92.5% of Milton residents speak English at home. 3.5% of Milton, FL residents are foreign-born (1.8% born in Asia, 1.2% born in Latin America), which is 497.6% less than the foreign-born rate of 21.0% across the entire state of Florida.
Race distribution in Milton
2000 2022
10,458,509 65.4% White alone 2,682,715 16.8% Hispanic 2,264,268 14.2% Black alone 261,693 1.6% Asian alone 236,954 1.5% Two or more races 42,358 0.3% American Indian alone 28,994 0.2% Other race alone 6,887 0.04% Native Hawaiian and Other
11,309,403 50.8% White alone 6,025,039 27.1% Hispanic 3,241,015 14.6% Black alone 861,630 3.9% Two or more races 623,692 2.8% Asian alone 152,054 0.7% Other race alone 22,504 0.1% American Indian alone 9,486 0.04% Native Hawaiian and Other
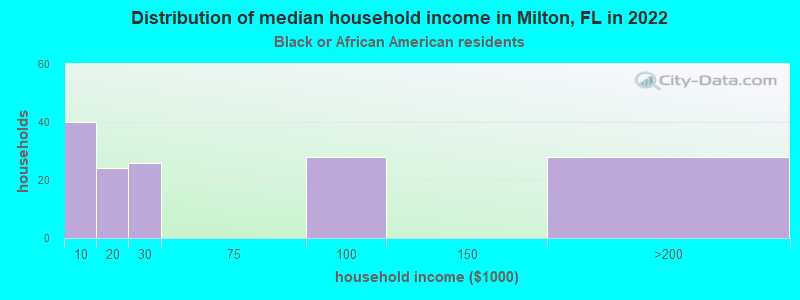
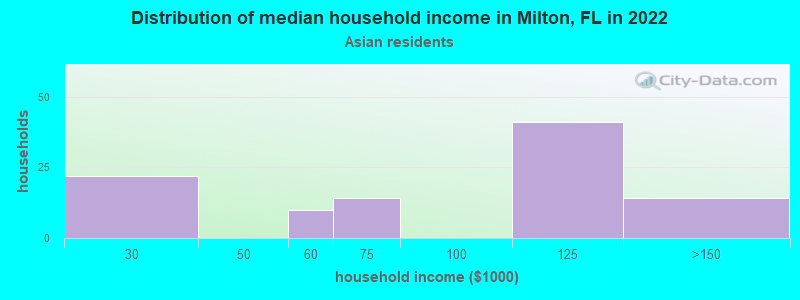
Income and house value in Milton Median household income in 2022 $70,747 White non-Hispanic householders$115,206 Asian householders$52,706 Two or more races householders$66,083 Hispanic or Latino race householdersMedian 2022 house value $202,018 White Non-Hispanic householders$165,637 Black or African American householders$102,931 Two or more races householders$205,567 Hispanic or Latino householders
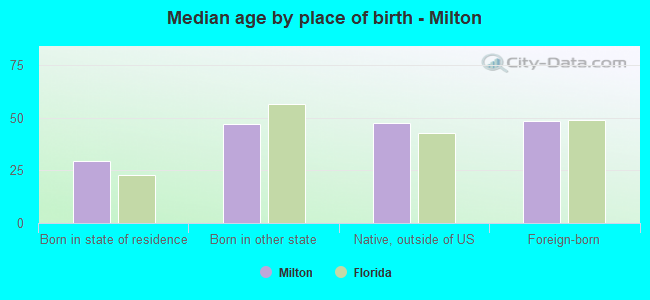
Median age by race in Milton
41.8 Median age for White residents38.6 43.8 45.8 Median age for Black or African American residents44.7 45.0 46.5 Median age for American Indian / Alaska Native residents52.5 -859,386,151.9 23.0 Median age for Asian residents34.4 26.5 -679,849,340.2 Median age for Native Hawaiian / Pacific Islander residents-858,307,848.3 -443,298,968.6 31.5 Median age for Other race residents20.2 31.2 33.8 Median age for Two or more races residents32.6 28.0 42.5 Median age for White alone residents39.3 44.9 29.0 Median age for Hispanic or Latino residents29.1 26.3
Owner/renter occupied households by race in Milton
House owners and renters - White residents 1,910 46.2% Owner occupied2,228 53.8% Renter occupiedHouse owners and renters - Black or African American residents 125 100.0% Owner occupiedHouse owners and renters - American Indian / Alaska Native residents 23 100.0% Renter occupiedHouse owners and renters - Asian residents 109 100.0% Owner occupiedHouse owners and renters - Native Hawaiian / Pacific Islander residents 37 100.0% Owner occupiedHouse owners and renters - Other race residents 165 100.0% Owner occupiedHouse owners and renters - Two or more races residents 68 49.7% Owner occupied69 50.3% Renter occupiedHouse owners and renters - White alone residents 1,912 48.2% Owner occupied2,056 51.8% Renter occupiedHouse owners and renters - Hispanic or Latino residents 167 42.8% Owner occupied224 57.2% Renter occupied
Language usage in Milton
English speakers - Total 92.5% of residents of Milton speak English at home.
3.9% of residents speak Spanish at home 341 83.6% Speak English very well67 16.4% Speak English less than very well2.7% of residents speak other language at home 100 35.1% Speak English very well185 64.9% Speak English less than very well
English speakers - Born in the United States 94.1% of residents of Milton speak English at home.
5.1% of residents speak Spanish at home 285 93.8% Speak English very well19 6.2% Speak English less than very well0.2% of residents speak other language at home 12 100.0% Speak English very well
English speakers - Native, born elsewhere 52.3% of residents of Milton speak English at home.
10.5% of residents speak Spanish at home 16 100.0% Speak English very well39.2% of residents speak other language at home 60 100.0% Speak English very well
English speakers - Foreign-born 27.1% of residents of Milton speak English at home.
23.7% of residents speak Spanish at home 22 28.6% Speak English very well55 71.4% Speak English less than very well60.0% of residents speak other language at home 23 11.8% Speak English very well172 88.2% Speak English less than very well
White (Caucasian) - Speak only English Native:
97.0% (8,190)Foreign-born:
55.3% (33)
White (Caucasian) - Speak another language Native:
2.9% (245)Foreign-born:
45.0% (26)
Asian - Speak only English Native:
91.5% (221)Foreign-born:
20.8% (35)
Asian - Speak another language Native:
9.7% (23)Foreign-born:
79.2% (133)
Other race - Speak only English Native:
18.0% (68)Foreign-born:
17.7% (19)
Other race - Speak another language Native:
81.4% (307)Foreign-born:
82.2% (90)
Two or more races - Speak only English Native:
96.4% (552)Foreign-born:
92.3% (13)
White alone - Speak only English Native:
98.6% (8,096)Foreign-born:
85.5% (35)
White alone - Speak another language Native:
1.3% (107)Foreign-born:
13.8% (6)
Hispanic or Latino - Speak only English Native:
62.1% (589)Foreign-born:
13.9% (16)
Hispanic or Latino - Speak another language Native:
20.5% (195)Foreign-born:
69.3% (79)
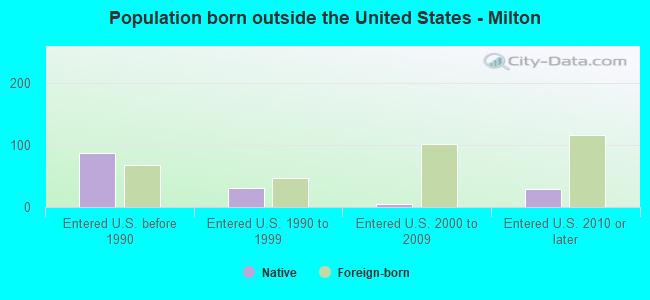
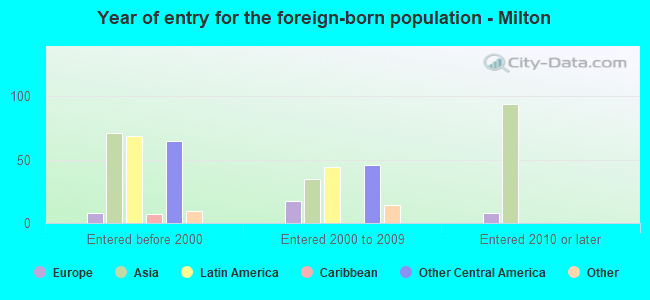
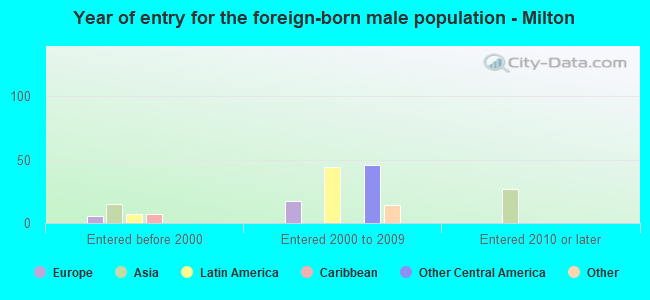
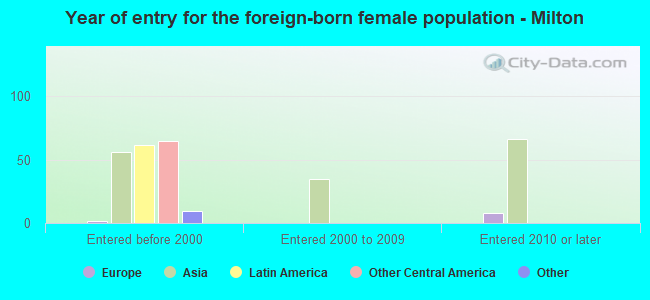
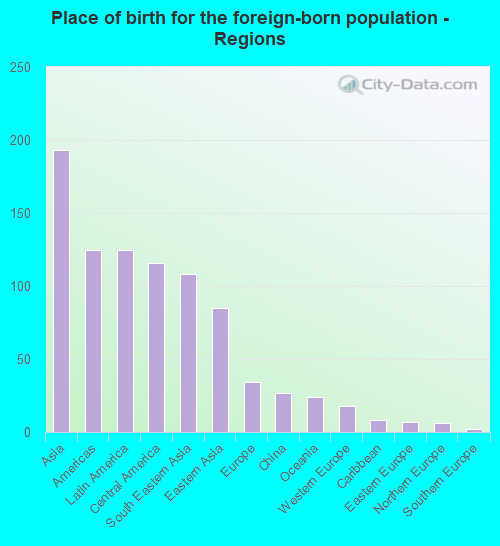
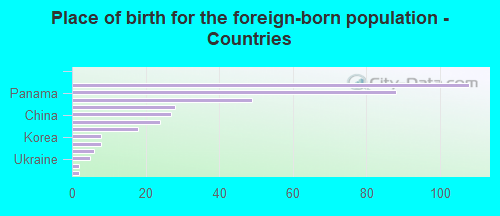
Foreign-born residents in Milton 378 residents are foreign born (1.8% Asia , 1.2% Latin America ).
This city:
3.5%Florida:
21.1%
Marital status for residents in Milton Marital status - White (Caucasian) population 15 years and over
Males 35.1% Never married38.7% Now married1.8% Separated8.7% Widowed15.7% DivorcedFemales 23.5% Never married40.7% Now married1.7% Separated11.1% Widowed23.0% DivorcedWomen who gave birth in the past 12 months Now married:
78.0% (99)Unmarried:
22.0% (28)
Women who did not give birth in the past 12 months Now married:
44.9% (759)Unmarried:
55.1% (933)
Marital status - Black or African American population 15 years and over
Males 33.6% Never married66.4% Now married0.0% Separated0.0% Widowed0.0% DivorcedFemales 4.8% Never married63.9% Now married0.0% Separated0.0% Widowed31.3% DivorcedWomen who gave birth in the past 12 months Now married:
100.0% (13)Unmarried:
0.0% (0)
Women who did not give birth in the past 12 months Now married:
90.9% (40)Unmarried:
9.1% (4)
Marital status - American Indian / Alaska Native population 15 years and over
Males 100.0% Never married0.0% Now married0.0% Separated0.0% Widowed0.0% DivorcedFemales 0.0% Never married37.5% Now married0.0% Separated0.0% Widowed62.5% DivorcedWomen who did not give birth in the past 12 months Now married:
100.0% (15)Unmarried:
0.0% (0)
Marital status - Asian population 15 years and over
Males 43.3% Never married56.7% Now married0.0% Separated0.0% Widowed0.0% DivorcedFemales 38.0% Never married45.0% Now married0.0% Separated9.6% Widowed7.4% DivorcedWomen who did not give birth in the past 12 months Now married:
48.4% (93)Unmarried:
51.6% (99)
Marital status - Other race population 15 years and over
Males 77.3% Never married22.7% Now married0.0% Separated0.0% Widowed0.0% DivorcedFemales 41.1% Never married38.0% Now married20.9% Separated0.0% Widowed0.0% DivorcedWomen who did not give birth in the past 12 months Now married:
42.4% (56)Unmarried:
57.6% (76)
Marital status - Two or more races population 15 years and over
Males 65.0% Never married31.0% Now married0.0% Separated0.0% Widowed3.9% DivorcedFemales 53.6% Never married35.4% Now married0.0% Separated7.8% Widowed3.1% DivorcedWomen who did not give birth in the past 12 months Now married:
35.5% (44)Unmarried:
64.5% (80)
Marital status - White alone, not Hispanic / Latino population 15 years and over
Males 36.2% Never married37.3% Now married1.9% Separated9.1% Widowed15.6% DivorcedFemales 23.8% Never married40.7% Now married1.7% Separated11.5% Widowed22.3% DivorcedWomen who gave birth in the past 12 months Now married:
66.2% (55)Unmarried:
33.8% (28)
Women who did not give birth in the past 12 months Now married:
45.3% (754)Unmarried:
54.7% (912)
Marital status - Hispanic or Latino population 15 years and over
Males 50.1% Never married42.9% Now married0.0% Separated0.0% Widowed7.0% DivorcedFemales 35.7% Never married39.3% Now married8.8% Separated0.0% Widowed16.2% DivorcedWomen who gave birth in the past 12 months Now married:
100.0% (49)Unmarried:
0.0% (0)
Women who did not give birth in the past 12 months Now married:
38.2% (77)Unmarried:
61.8% (124)
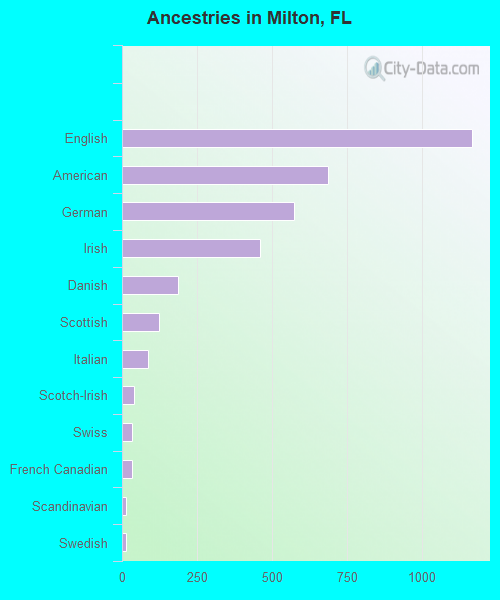
Ancestries in Milton
1,166 23.3% English687 13.7% American573 11.4% German462 9.2% Irish188 3.8% Danish122 2.4% Scottish86 1.7% Italian39 0.8% Scotch-Irish35 0.7% Swiss32 0.6% French Canadian14 0.3% Scandinavian13 0.3% Swedish10 0.2% Polish8 0.2% British8 0.2% Celtic8 0.2% Northern European4 0.08% Russian3 0.06% European3 0.06% French2 0.04% Bulgarian
Children Nativity (place of birth) in Milton
Children under 6 years - Living with two parents Both parents native 328 99.2% Native3 0.8% Foreign-bornOne native, one foreign-born parent 30 76.3% Native9 23.7% Foreign-bornChildren under 6 years - Living with one parent Native parent 147 100.0% NativeChildren 6 to 17 years - Living with two parents Both parents native 671 97.9% Native14 2.1% Foreign-bornChildren 6 to 17 years - Living with one parent Native parent 177 100.0% NativeForeign-born parent 6 50.6% Native6 49.4% Foreign-born
Grandparents responsible for own grandchildren in Milton
Grandparents (30 to 59 years) White / Caucasian 25 78.5% Responsible for grandchildren7 21.5% Not responsible for grandchildrenOther race 38 100.0% Responsible for grandchildrenTwo or more races 17 100.0% Responsible for grandchildrenWhite alone, not Hispanic / Latino 25 78.0% Responsible for grandchildren7 22.0% Not responsible for grandchildrenHispanic or Latino 30 100.0% Responsible for grandchildrenGrandparents (60 years and over) White / Caucasian 35 78.7% Responsible for grandchildren10 21.3% Not responsible for grandchildrenWhite alone, not Hispanic / Latino 36 77.9% Responsible for grandchildren10 22.1% Not responsible for grandchildren