Races in Minnetonka, Minnesota (MN) Detailed Stats
Data:
Races - White alone (%)
Races - White alone (% change since 2000)
Races - Black alone (%)
Races - Black alone (% change since 2000)
Races - American Indian alone (%)
Races - American Indian alone (% change since 2000)
Races - Asian alone (%)
Races - Asian alone (% change since 2000)
Races - Hispanic (%)
Races - Hispanic (% change since 2000)
Races - Native Hawaiian and Other Pacific Islander alone (%)
Races - Native Hawaiian and Other Pacific Islander alone (% change since 2000)
Races - Two or more races(%)
Races - Two or more races(% change since 2000)
Races - Other race alone (%)
Races - Other race alone (% change since 2000)
Racial diversity
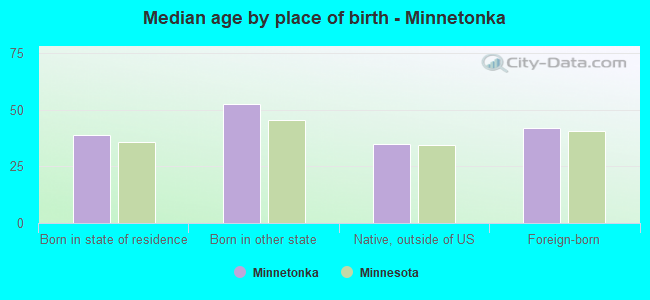
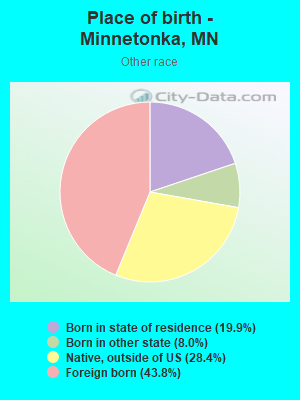
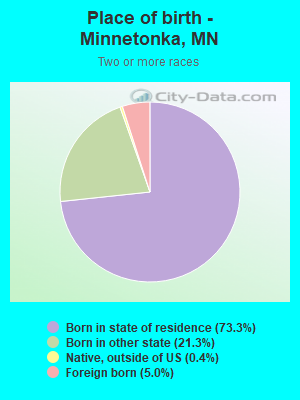
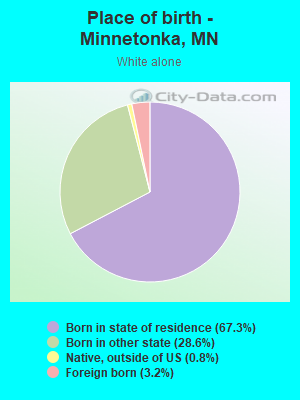
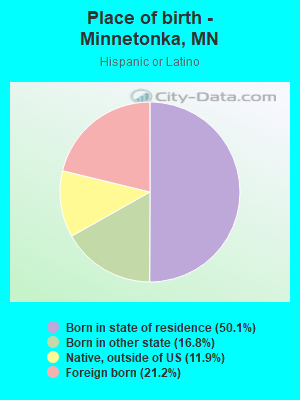
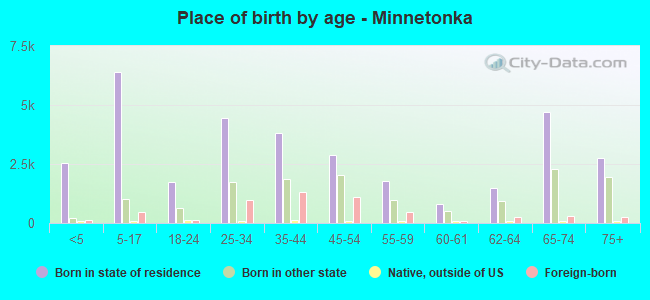
Place of birth - Born in state of residence (%)
Place of birth - Born in state of residence (%) - White
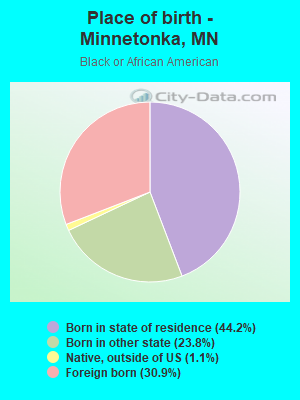
Place of birth - Born in state of residence (%) - Black or African American
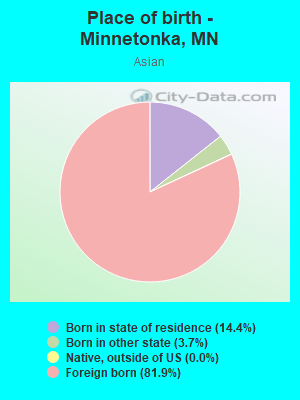
Place of birth - Born in state of residence (%) - Asian
Place of birth - Born in state of residence (%) - Hispanic or Latino
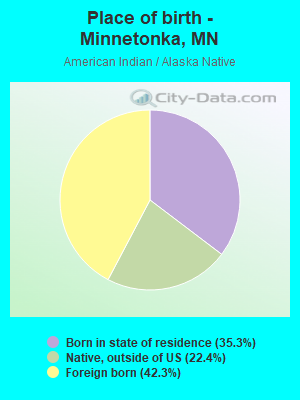
Place of birth - Born in state of residence (%) - American Indian and Alaska Native
Place of birth - Born in state of residence (%) - Multirace
Place of birth - Born in state of residence (%) - Other Race
Place of birth - Born in other state (%)
Place of birth - Born in other state (%) - White
Place of birth - Born in other state (%) - Black or African American
Place of birth - Born in other state (%) - Asian
Place of birth - Born in other state (%) - Hispanic or Latino
Place of birth - Born in other state (%) - American Indian and Alaska Native
Place of birth - Born in other state (%) - Multirace
Place of birth - Born in other state (%) - Other Race
Place of birth - Native, outside of US (%)
Place of birth - Native, outside of US (%) - White
Place of birth - Native, outside of US (%) - Black or African American
Place of birth - Native, outside of US (%) - Asian
Place of birth - Native, outside of US (%) - Hispanic or Latino
Place of birth - Native, outside of US (%) - American Indian and Alaska Native
Place of birth - Native, outside of US (%) - Multirace
Place of birth - Native, outside of US (%) - Other Race
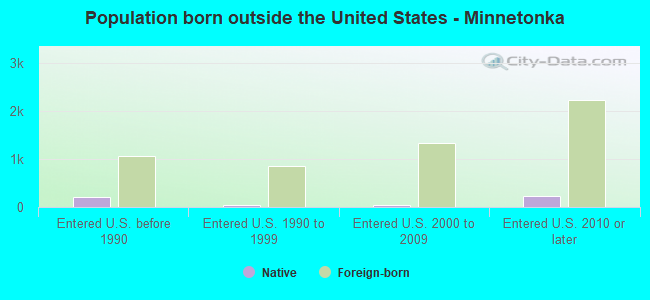
Place of birth - Foreign born (%)
Place of birth - Foreign born (%) - White
Place of birth - Foreign born (%) - Black or African American
Place of birth - Foreign born (%) - Asian
Place of birth - Foreign born (%) - Hispanic or Latino
Place of birth - Foreign born (%) - American Indian and Alaska Native
Place of birth - Foreign born (%) - Multirace
Place of birth - Foreign born (%) - Other Race
Residents speaking English at home (%)
Residents speaking English at home - Born in the United States (%)
Residents speaking English at home - Native, born elsewhere (%)
Residents speaking English at home - Foreign born (%)
Residents speaking Spanish at home (%)
Residents speaking Spanish at home - Born in the United States (%)
Residents speaking Spanish at home - Native, born elsewhere (%)
Residents speaking Spanish at home - Foreign born (%)
Residents speaking other language at home (%)
Residents speaking other language at home - Born in the United States (%)
Residents speaking other language at home - Native, born elsewhere (%)
Residents speaking other language at home - Foreign born (%)
Marital status - Never married (%)
Marital status - Now married (%)
Marital status - Separated (%)
Marital status - Widowed (%)
Marital status - Divorced (%)
Ancestries Reported - Arab (%)
Ancestries Reported - Czech (%)
Ancestries Reported - Danish (%)
Ancestries Reported - Dutch (%)
Ancestries Reported - English (%)
Ancestries Reported - French (%)
Ancestries Reported - French Canadian (%)
Ancestries Reported - German (%)
Ancestries Reported - Greek (%)
Ancestries Reported - Hungarian (%)
Ancestries Reported - Irish (%)
Ancestries Reported - Italian (%)
Ancestries Reported - Lithuanian (%)
Ancestries Reported - Norwegian (%)
Ancestries Reported - Polish (%)
Ancestries Reported - Portuguese (%)
Ancestries Reported - Russian (%)
Ancestries Reported - Scotch-Irish (%)
Ancestries Reported - Scottish (%)
Ancestries Reported - Slovak (%)
Ancestries Reported - Subsaharan African (%)
Ancestries Reported - Swedish (%)
Ancestries Reported - Swiss (%)
Ancestries Reported - Ukrainian (%)
Ancestries Reported - United States (%)
Ancestries Reported - Welsh (%)
Ancestries Reported - West Indian (%)
Ancestries Reported - Other (%)
Geographical mobility - Same house 1 year ago (%)
Geographical mobility - Same house 1 year ago (%) - White
Geographical mobility - Same house 1 year ago (%) - Black or African American
Geographical mobility - Same house 1 year ago (%) - Asian
Geographical mobility - Same house 1 year ago (%) - Hispanic or Latino
Geographical mobility - Same house 1 year ago (%) - American Indian and Alaska Native
Geographical mobility - Same house 1 year ago (%) - Multirace
Geographical mobility - Same house 1 year ago (%) - Other Race
Geographical mobility - Moved within same county (%)
Geographical mobility - Moved within same county (%) - White
Geographical mobility - Moved within same county (%) - Black or African American
Geographical mobility - Moved within same county (%) - Asian
Geographical mobility - Moved within same county (%) - Hispanic or Latino
Geographical mobility - Moved within same county (%) - American Indian and Alaska Native
Geographical mobility - Moved within same county (%) - Multirace
Geographical mobility - Moved within same county (%) - Other Race
Geographical mobility - Moved from different county within same state (%)
Geographical mobility - Moved from different county within same state (%) - White
Geographical mobility - Moved from different county within same state (%) - Black or African American
Geographical mobility - Moved from different county within same state (%) - Asian
Geographical mobility - Moved from different county within same state (%) - Hispanic or Latino
Geographical mobility - Moved from different county within same state (%) - American Indian and Alaska Native
Geographical mobility - Moved from different county within same state (%) - Multirace
Geographical mobility - Moved from different county within same state (%) - Other Race
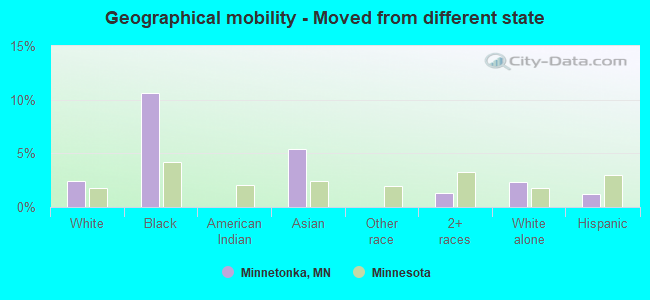
Geographical mobility - Moved from different state (%)
Geographical mobility - Moved from different state (%) - White
Geographical mobility - Moved from different state (%) - Black or African American
Geographical mobility - Moved from different state (%) - Asian
Geographical mobility - Moved from different state (%) - Hispanic or Latino
Geographical mobility - Moved from different state (%) - American Indian and Alaska Native
Geographical mobility - Moved from different state (%) - Multirace
Geographical mobility - Moved from different state (%) - Other Race
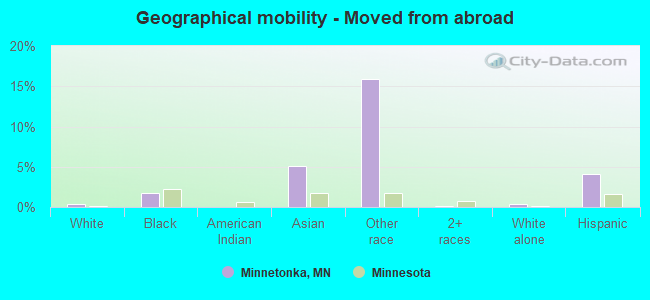
Geographical mobility - Moved from abroad (%)
Geographical mobility - Moved from abroad (%) - White
Geographical mobility - Moved from abroad (%) - Black or African American
Geographical mobility - Moved from abroad (%) - Asian
Geographical mobility - Moved from abroad (%) - Hispanic or Latino
Geographical mobility - Moved from abroad (%) - American Indian and Alaska Native
Geographical mobility - Moved from abroad (%) - Multirace
Geographical mobility - Moved from abroad (%) - Other Race
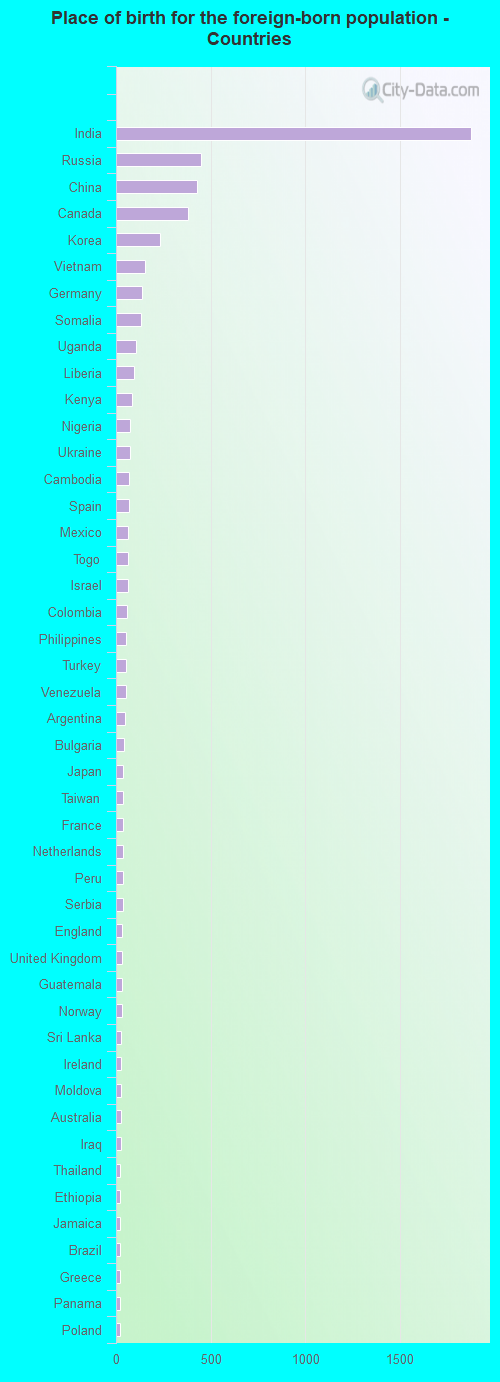
Place of birth for the foreign-born population - Ireland (%)
Place of birth for the foreign-born population - Denmark (%)
Place of birth for the foreign-born population - Norway (%)
Place of birth for the foreign-born population - Sweden (%)
Place of birth for the foreign-born population - United Kingdom (%)
Place of birth for the foreign-born population - England (%)
Place of birth for the foreign-born population - Scotland (%)
Place of birth for the foreign-born population - Other Northern Europe (%)
Place of birth for the foreign-born population - Austria (%)
Place of birth for the foreign-born population - Belgium (%)
Place of birth for the foreign-born population - France (%)
Place of birth for the foreign-born population - Germany (%)
Place of birth for the foreign-born population - Netherlands (%)
Place of birth for the foreign-born population - Switzerland (%)
Place of birth for the foreign-born population - Other Western Europe (%)
Place of birth for the foreign-born population - Greece (%)
Place of birth for the foreign-born population - Italy (%)
Place of birth for the foreign-born population - Portugal (%)
Place of birth for the foreign-born population - Spain (%)
Place of birth for the foreign-born population - Other Southern Europe (%)
Place of birth for the foreign-born population - Albania (%)
Place of birth for the foreign-born population - Belarus (%)
Place of birth for the foreign-born population - Bosnia and Herzegovina (%)
Place of birth for the foreign-born population - Bulgaria (%)
Place of birth for the foreign-born population - Croatia (%)
Place of birth for the foreign-born population - Czechoslovakia (%)
Place of birth for the foreign-born population - Hungary (%)
Place of birth for the foreign-born population - Latvia (%)
Place of birth for the foreign-born population - Lithuania (%)
Place of birth for the foreign-born population - North Macedonia (Macedonia) (%)
Place of birth for the foreign-born population - Moldova (%)
Place of birth for the foreign-born population - Poland (%)
Place of birth for the foreign-born population - Romania (%)
Place of birth for the foreign-born population - Russia (%)
Place of birth for the foreign-born population - Serbia (%)
Place of birth for the foreign-born population - Ukraine (%)
Place of birth for the foreign-born population - Other Eastern Europe (%)
Place of birth for the foreign-born population - China (%)
Place of birth for the foreign-born population - Hong Kong (%)
Place of birth for the foreign-born population - Taiwan (%)
Place of birth for the foreign-born population - Japan (%)
Place of birth for the foreign-born population - Korea (%)
Place of birth for the foreign-born population - Other Eastern Asia (%)
Place of birth for the foreign-born population - Afghanistan (%)
Place of birth for the foreign-born population - Bangladesh (%)
Place of birth for the foreign-born population - India (%)
Place of birth for the foreign-born population - Iran (%)
Place of birth for the foreign-born population - Kazakhstan (%)
Place of birth for the foreign-born population - Nepal (%)
Place of birth for the foreign-born population - Pakistan (%)
Place of birth for the foreign-born population - Sri Lanka (%)
Place of birth for the foreign-born population - Uzbekistan (%)
Place of birth for the foreign-born population - Other South Central Asia (%)
Place of birth for the foreign-born population - Burma (%)
Place of birth for the foreign-born population - Cambodia (%)
Place of birth for the foreign-born population - Indonesia (%)
Place of birth for the foreign-born population - Laos (%)
Place of birth for the foreign-born population - Malaysia (%)
Place of birth for the foreign-born population - Philippines (%)
Place of birth for the foreign-born population - Singapore (%)
Place of birth for the foreign-born population - Thailand (%)
Place of birth for the foreign-born population - Vietnam (%)
Place of birth for the foreign-born population - Other South Eastern Asia (%)
Place of birth for the foreign-born population - Armenia (%)
Place of birth for the foreign-born population - Iraq (%)
Place of birth for the foreign-born population - Israel (%)
Place of birth for the foreign-born population - Jordan (%)
Place of birth for the foreign-born population - Kuwait (%)
Place of birth for the foreign-born population - Lebanon (%)
Place of birth for the foreign-born population - Saudi Arabia (%)
Place of birth for the foreign-born population - Syria (%)
Place of birth for the foreign-born population - Turkey (%)
Place of birth for the foreign-born population - Yemen (%)
Place of birth for the foreign-born population - Other Western Asia (%)
Place of birth for the foreign-born population - Eritrea (%)
Place of birth for the foreign-born population - Ethiopia (%)
Place of birth for the foreign-born population - Kenya (%)
Place of birth for the foreign-born population - Somalia (%)
Place of birth for the foreign-born population - Uganda (%)
Place of birth for the foreign-born population - Zimbabwe (%)
Place of birth for the foreign-born population - Other Eastern Africa (%)
Place of birth for the foreign-born population - Cameroon (%)
Place of birth for the foreign-born population - Congo (%)
Place of birth for the foreign-born population - Democratic Republic of Congo (Zaire) (%)
Place of birth for the foreign-born population - Other Middle Africa (%)
Place of birth for the foreign-born population - Egypt (%)
Place of birth for the foreign-born population - Morocco (%)
Place of birth for the foreign-born population - Sudan (%)
Place of birth for the foreign-born population - Other Northern Africa (%)
Place of birth for the foreign-born population - South Africa (%)
Place of birth for the foreign-born population - Other Southern Africa (%)
Place of birth for the foreign-born population - Cabo Verde (%)
Place of birth for the foreign-born population - Ghana (%)
Place of birth for the foreign-born population - Liberia (%)
Place of birth for the foreign-born population - Nigeria (%)
Place of birth for the foreign-born population - Senegal (%)
Place of birth for the foreign-born population - Sierra Leone (%)
Place of birth for the foreign-born population - Other Western Africa (%)
Place of birth for the foreign-born population - Australia (%)
Place of birth for the foreign-born population - New Zealand (%)
Place of birth for the foreign-born population - Fiji (%)
Place of birth for the foreign-born population - Micronesia (%)
Place of birth for the foreign-born population - Bahamas (%)
Place of birth for the foreign-born population - Barbados (%)
Place of birth for the foreign-born population - Cuba (%)
Place of birth for the foreign-born population - Dominica (%)
Place of birth for the foreign-born population - Dominican Republic (%)
Place of birth for the foreign-born population - Grenada (%)
Place of birth for the foreign-born population - Haiti (%)
Place of birth for the foreign-born population - Jamaica (%)
Place of birth for the foreign-born population - St. Vincent and the Grenadines (%)
Place of birth for the foreign-born population - Trinidad and Tobago (%)
Place of birth for the foreign-born population - West Indies (%)
Place of birth for the foreign-born population - Other Caribbean (%)
Place of birth for the foreign-born population - Belize (%)
Place of birth for the foreign-born population - Costa Rica (%)
Place of birth for the foreign-born population - El Salvador (%)
Place of birth for the foreign-born population - Guatemala (%)
Place of birth for the foreign-born population - Honduras (%)
Place of birth for the foreign-born population - Mexico (%)
Place of birth for the foreign-born population - Nicaragua (%)
Place of birth for the foreign-born population - Panama (%)
Place of birth for the foreign-born population - Other Central America (%)
Place of birth for the foreign-born population - Argentina (%)
Place of birth for the foreign-born population - Bolivia (%)
Place of birth for the foreign-born population - Brazil (%)
Place of birth for the foreign-born population - Chile (%)
Place of birth for the foreign-born population - Colombia (%)
Place of birth for the foreign-born population - Ecuador (%)
Place of birth for the foreign-born population - Guyana (%)
Place of birth for the foreign-born population - Peru (%)
Place of birth for the foreign-born population - Uruguay (%)
Place of birth for the foreign-born population - Venezuela (%)
Place of birth for the foreign-born population - Other South America (%)
Place of birth for the foreign-born population - Canada (%)
Place of birth for the foreign-born population - Other Northern America (%)
Place of birth for the foreign-born population - Other (%)
Latest news about races in Minnetonka, MN collected exclusively by city-data.com from local newspapers, TV, and radio stations
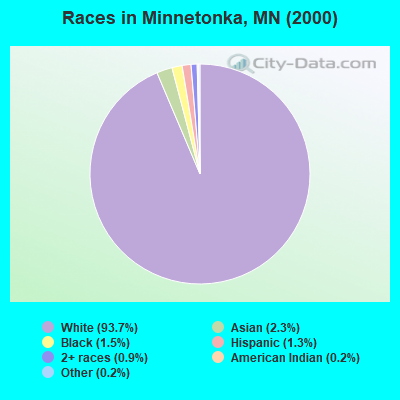
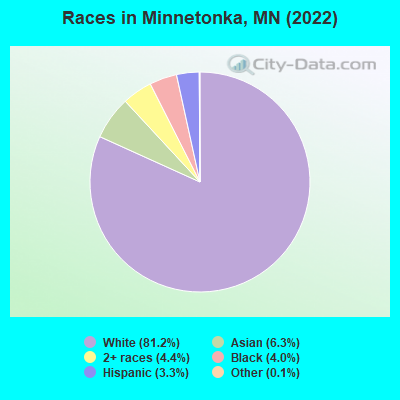
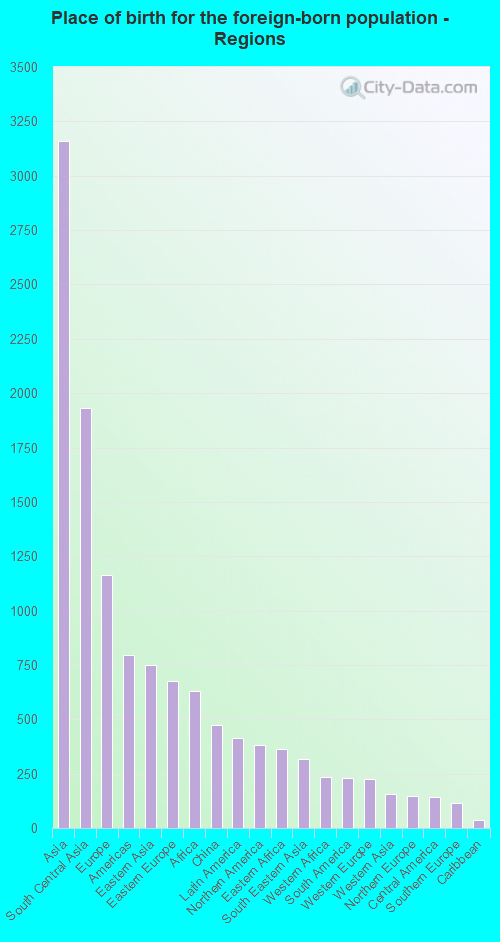
According to 2022 data, the most numerous races in Minnetonka, MN are White alone (43,078 residents), Black alone (2,114 residents), and Hispanic (1,763 residents). 87.8% of Minnetonka residents speak English at home. 10.9% of Minnetonka, MN residents are foreign-born (5.7% born in Asia, 2.1% born in Europe, 1.1% born in Africa), which is 26.5% greater than the foreign-born rate of 8.0% across the entire state of Minnesota.
Race distribution in Minnetonka
2000 2022
4,337,143 88.2% White alone 168,813 3.4% Black alone 143,382 2.9% Hispanic 141,083 2.9% Asian alone 70,304 1.4% Two or more races 52,009 1.1% American Indian alone 5,031 0.1% Other race alone 1,714 0.03% Native Hawaiian and Other
4,356,347 76.2% White alone 395,179 6.9% Black alone 333,830 5.8% Hispanic 294,800 5.2% Asian alone 259,649 4.5% Two or more races 42,125 0.7% American Indian alone 32,976 0.6% Other race alone 2,278 0.04% Native Hawaiian and Other
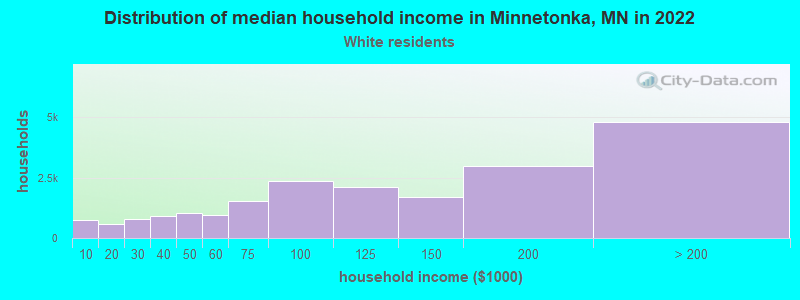
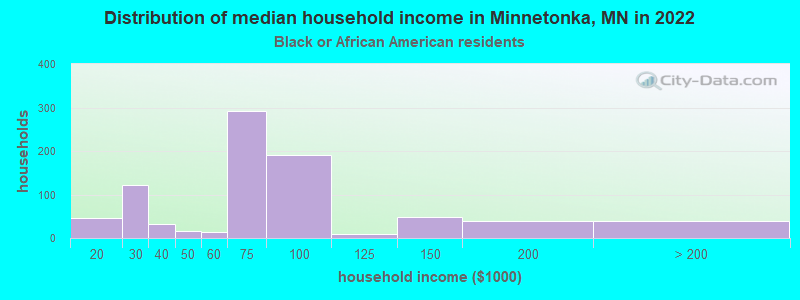
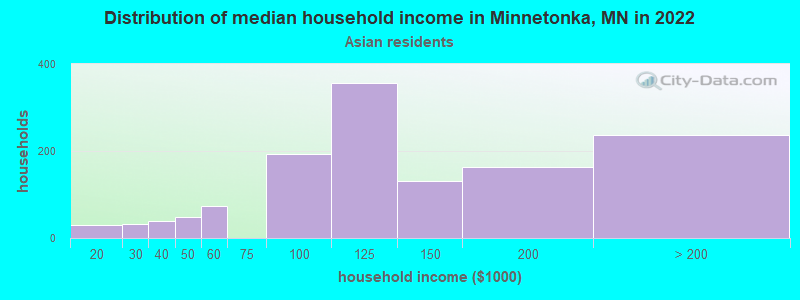
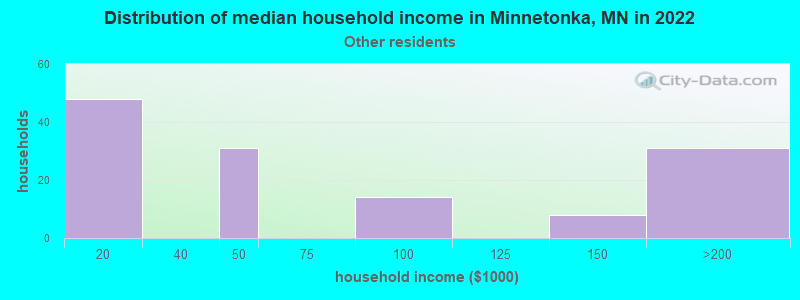
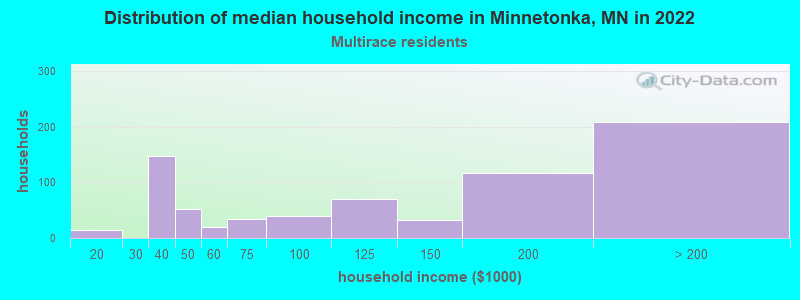
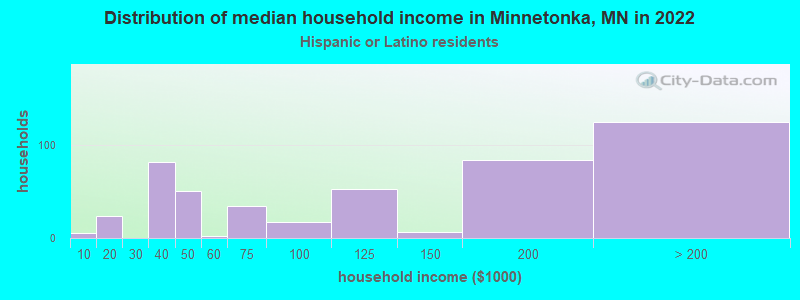
Income and house value in Minnetonka Median household income in 2022 $115,118 White non-Hispanic householders$70,461 Black householders$107,158 Asian householders$120,106 Two or more races householders$106,510 Hispanic or Latino race householdersMedian 2022 house value $473,675 White Non-Hispanic householders$699,449 Black or African American householders$306,335 American Indian or Alaska Native householders $412,259 Asian householders$268,043 Some other race householders$519,924 Two or more races householders$386,897 Hispanic or Latino householders
Median age by race in Minnetonka
48.2 Median age for White residents46.0 49.7 29.8 Median age for Black or African American residents24.3 30.3 28.5 Median age for American Indian / Alaska Native residents27.4 -643,749,999.4 36.7 Median age for Asian residents36.2 38.1 -790,303,029.5 Median age for Native Hawaiian / Pacific Islander residents-856,799,036.4 -365,948,037.2 24.7 Median age for Other race residents24.8 24.5 16.6 Median age for Two or more races residents15.6 18.2 48.1 Median age for White alone residents46.0 49.7 22.4 Median age for Hispanic or Latino residents21.4 28.8
Owner/renter occupied households by race in Minnetonka
House owners and renters - White residents 15,607 75.5% Owner occupied5,055 24.5% Renter occupiedHouse owners and renters - Black or African American residents 180 22.5% Owner occupied622 77.5% Renter occupiedHouse owners and renters - American Indian / Alaska Native residents 11 100.0% Renter occupiedHouse owners and renters - Asian residents 689 53.5% Owner occupied599 46.5% Renter occupiedHouse owners and renters - Other race residents 58 42.3% Owner occupied80 57.7% Renter occupiedHouse owners and renters - Two or more races residents 460 62.5% Owner occupied276 37.5% Renter occupiedHouse owners and renters - White alone residents 15,633 75.5% Owner occupied5,072 24.5% Renter occupiedHouse owners and renters - Hispanic or Latino residents 306 62.7% Owner occupied182 37.3% Renter occupied
Language usage in Minnetonka
English speakers - Total 87.8% of residents of Minnetonka speak English at home.
2.3% of residents speak Spanish at home 822 72.6% Speak English very well310 27.4% Speak English less than very well9.9% of residents speak other language at home 3,343 67.2% Speak English very well1,632 32.8% Speak English less than very well
English speakers - Born in the United States 94.4% of residents of Minnetonka speak English at home.
2.0% of residents speak Spanish at home 269 97.5% Speak English very well7 2.5% Speak English less than very well3.0% of residents speak other language at home 405 96.2% Speak English very well16 3.8% Speak English less than very well
English speakers - Native, born elsewhere 70.7% of residents of Minnetonka speak English at home.
38.5% of residents speak Spanish at home 64 35.6% Speak English very well116 64.4% Speak English less than very well0.9% of residents speak other language at home 4 100.0% Speak English very well
English speakers - Foreign-born 26.3% of residents of Minnetonka speak English at home.
5.6% of residents speak Spanish at home 238 80.7% Speak English very well57 19.3% Speak English less than very well68.5% of residents speak other language at home 2,129 59.1% Speak English very well1,472 40.9% Speak English less than very well
White (Caucasian) - Speak only English Native:
97.1% (38,707)Foreign-born:
52.0% (671)
White (Caucasian) - Speak another language Native:
2.9% (1,152)Foreign-born:
51.1% (660)
Black or African American - Speak only English Native:
92.2% (1,109)Foreign-born:
32.6% (210)
Black or African American - Speak another language Native:
3.2% (38)Foreign-born:
59.8% (385)
American Indian / Alaska Native - Speak only English Native:
81.8% (29)Foreign-born:
100.0% (30)
Asian - Speak only English Native:
39.8% (154)Foreign-born:
16.7% (423)
Asian - Speak another language Native:
59.5% (231)Foreign-born:
83.2% (2,102)
Other race - Speak only English Native:
21.1% (36)Foreign-born:
32.8% (57)
Other race - Speak another language Native:
71.6% (122)Foreign-born:
66.0% (114)
Two or more races - Speak only English Native:
81.6% (2,423)Foreign-born:
12.2% (22)
Two or more races - Speak another language Native:
17.3% (514)Foreign-born:
86.9% (160)
White alone - Speak only English Native:
97.1% (38,714)Foreign-born:
48.7% (675)
White alone - Speak another language Native:
2.8% (1,132)Foreign-born:
51.7% (716)
Hispanic or Latino - Speak only English Native:
66.8% (814)Foreign-born:
16.5% (64)
Hispanic or Latino - Speak another language Native:
35.3% (431)Foreign-born:
84.3% (327)
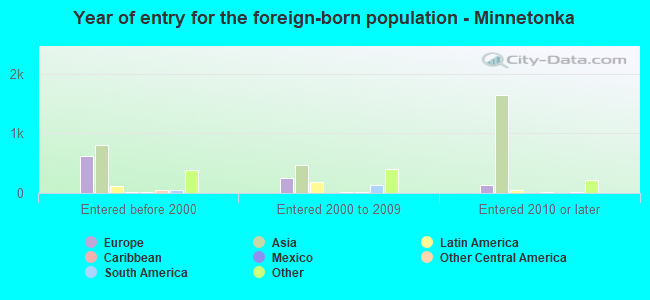
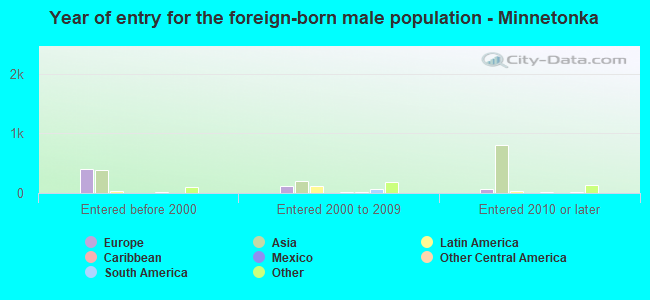
Foreign-born residents in Minnetonka 5,774 residents are foreign born (5.7% Asia , 2.1% Europe , 1.1% Africa ).
This city:
10.9%Minnesota:
8.5%
Marital status for residents in Minnetonka Marital status - White (Caucasian) population 15 years and over
Males 26.5% Never married58.9% Now married1.0% Separated3.0% Widowed10.6% DivorcedFemales 23.2% Never married54.6% Now married0.4% Separated8.2% Widowed13.6% DivorcedWomen who gave birth in the past 12 months Now married:
88.9% (389)Unmarried:
11.1% (49)
Women who did not give birth in the past 12 months Now married:
48.4% (3,784)Unmarried:
51.6% (4,029)
Marital status - Black or African American population 15 years and over
Males 50.2% Never married34.0% Now married0.0% Separated0.0% Widowed15.8% DivorcedFemales 58.5% Never married36.8% Now married0.0% Separated1.7% Widowed2.9% DivorcedWomen who gave birth in the past 12 months Now married:
100.0% (52)Unmarried:
0.0% (0)
Women who did not give birth in the past 12 months Now married:
34.5% (277)Unmarried:
65.5% (526)
Marital status - American Indian / Alaska Native population 15 years and over
Males 100.0% Never married0.0% Now married0.0% Separated0.0% Widowed0.0% DivorcedFemales 100.0% Never married0.0% Now married0.0% Separated0.0% Widowed0.0% DivorcedWomen who did not give birth in the past 12 months Now married:
0.0% (0)Unmarried:
100.0% (10)
Marital status - Asian population 15 years and over
Males 20.3% Never married74.1% Now married0.9% Separated0.0% Widowed4.7% DivorcedFemales 21.5% Never married61.4% Now married0.0% Separated5.7% Widowed11.4% DivorcedWomen who gave birth in the past 12 months Now married:
78.0% (78)Unmarried:
22.0% (22)
Women who did not give birth in the past 12 months Now married:
59.6% (535)Unmarried:
40.4% (362)
Marital status - Other race population 15 years and over
Males 59.0% Never married14.0% Now married0.0% Separated0.0% Widowed27.0% DivorcedFemales 65.0% Never married24.0% Now married2.2% Separated0.0% Widowed8.7% DivorcedWomen who did not give birth in the past 12 months Now married:
22.4% (34)Unmarried:
77.6% (117)
Marital status - Two or more races population 15 years and over
Males 55.3% Never married35.2% Now married0.0% Separated0.0% Widowed9.5% DivorcedFemales 45.9% Never married36.2% Now married0.0% Separated2.9% Widowed15.0% DivorcedWomen who gave birth in the past 12 months Now married:
93.3% (19)Unmarried:
6.7% (1)
Women who did not give birth in the past 12 months Now married:
32.8% (243)Unmarried:
67.2% (498)
Marital status - White alone, not Hispanic / Latino population 15 years and over
Males 26.5% Never married58.7% Now married1.0% Separated3.1% Widowed10.7% DivorcedFemales 23.2% Never married54.6% Now married0.4% Separated8.3% Widowed13.6% DivorcedWomen who gave birth in the past 12 months Now married:
88.9% (396)Unmarried:
11.1% (50)
Women who did not give birth in the past 12 months Now married:
48.2% (3,757)Unmarried:
51.8% (4,038)
Marital status - Hispanic or Latino population 15 years and over
Males 53.6% Never married39.4% Now married0.0% Separated0.0% Widowed7.0% DivorcedFemales 36.7% Never married41.7% Now married1.7% Separated2.2% Widowed17.7% DivorcedWomen who gave birth in the past 12 months Now married:
100.0% (8)Unmarried:
0.0% (0)
Women who did not give birth in the past 12 months Now married:
42.7% (187)Unmarried:
57.3% (251)
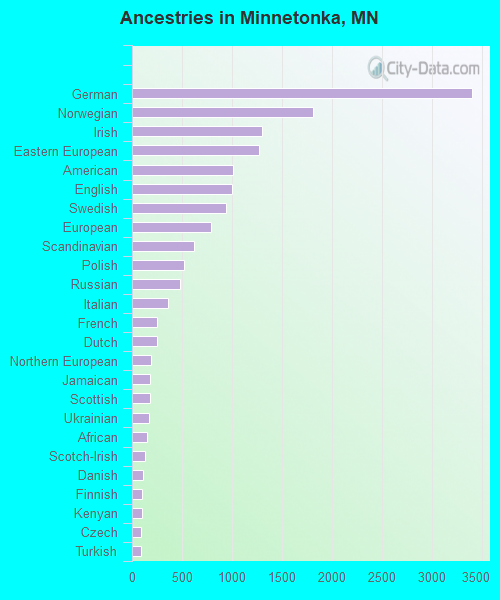
Ancestries in Minnetonka
3,402 16.4% German1,807 8.7% Norwegian1,301 6.3% Irish1,273 6.2% Eastern European1,009 4.9% American1,005 4.9% English936 4.5% Swedish787 3.8% European622 3.0% Scandinavian516 2.5% Polish485 2.3% Russian356 1.7% Italian251 1.2% French246 1.2% Dutch195 0.9% Northern European178 0.9% Jamaican178 0.9% Scottish167 0.8% Ukrainian150 0.7% African127 0.6% Scotch-Irish113 0.5% Danish102 0.5% Finnish97 0.5% Kenyan95 0.5% Czech89 0.4% Turkish76 0.4% Australian70 0.3% Lebanese68 0.3% Nigerian65 0.3% French Canadian58 0.3% Liberian58 0.3% Somali56 0.3% Czechoslovakian49 0.2% Canadian41 0.2% Greek39 0.2% Bulgarian32 0.2% Portuguese31 0.1% Brazilian31 0.1% Israeli29 0.1% Latvian27 0.1% Lithuanian27 0.1% British25 0.1% Estonian25 0.1% Welsh22 0.1% Armenian21 0.1% Iranian21 0.1% Serbian20 0.10% Slovak19 0.09% Luxembourger19 0.09% Yugoslavian18 0.09% Hungarian17 0.08% Croatian16 0.08% Austrian13 0.06% Belgian13 0.06% Swiss13 0.06% Trinidadian and Tobagonian10 0.05% Moroccan9 0.04% Romanian7 0.03% Basque7 0.03% New Zealander6 0.03% Guyanese5 0.02% Albanian4 0.02% Slovene
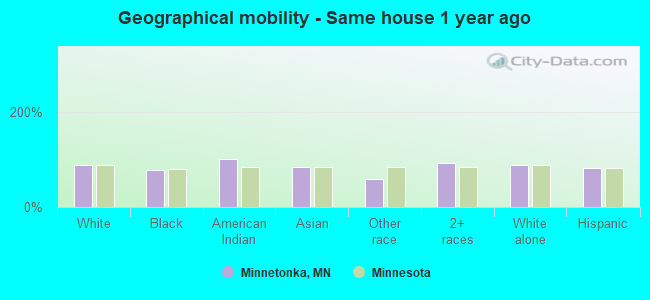
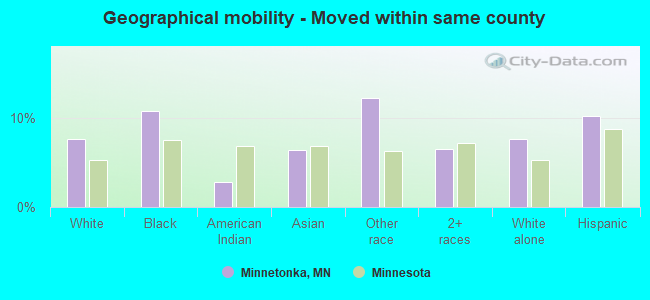
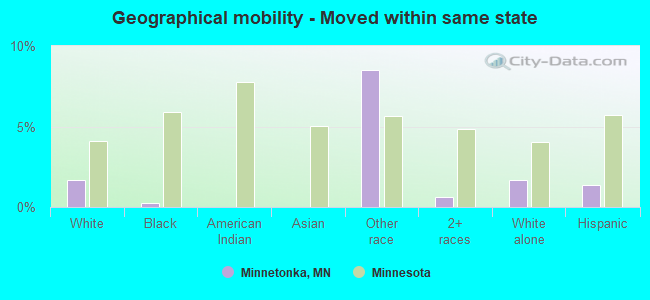
Geographical mobility in Minnetonka Same house 1 year ago 37,396 87.8% White (Caucasian)1,617 78.5% Black or African American61 100.0% American Indian / Alaska Native2,757 83.9% Asian208 59.3% Other race3,354 92.1% Two or more races37,518 87.9% White alone, not Hispanic / Latino1,418 82.3% Hispanic or LatinoMoved within same county 3,257 7.7% White / Caucasian222 10.8% Black or African American2 2.8% American Indian / Alaska Native210 6.4% Asian43 12.1% Other race234 6.4% Two or more races3,263 7.6% White alone, not Hispanic / Latino176 10.2% Hispanic or LatinoMoved within same state 711 1.7% White / Caucasian6 0.3% Black or African American30 8.5% Other race22 0.6% Two or more races727 1.7% White alone, not Hispanic / Latino23 1.3% Hispanic or LatinoMoved from different state 1,038 2.4% White / Caucasian219 10.6% Black or African American177 5.4% Asian49 1.3% Two or more races998 2.3% White alone, not Hispanic / Latino21 1.2% Hispanic or LatinoMoved from abroad 147 0.3% White37 1.8% Black or African American167 5.1% Asian56 16.0% Other race6 0.2% Two or more races159 0.4% White alone, not Hispanic / Latino70 4.1% Hispanic or Latino
Children Nativity (place of birth) in Minnetonka
Children under 6 years - Living with two parents Both parents native 2,219 100.0% NativeBoth parents foreign-born 225 51.5% Native212 48.5% Foreign-bornOne native, one foreign-born parent 392 100.0% NativeChildren under 6 years - Living with one parent Native parent 400 100.0% NativeForeign-born parent 97 100.0% NativeChildren 6 to 17 years - Living with two parents Both parents native 4,421 99.0% Native43 1.0% Foreign-bornBoth parents foreign-born 321 61.0% Native205 39.0% Foreign-bornOne native, one foreign-born parent 820 88.5% Native107 11.5% Foreign-bornChildren 6 to 17 years - Living with one parent Native parent 1,292 100.0% NativeForeign-born parent 58 59.6% Native39 40.4% Foreign-born
Grandparents responsible for own grandchildren in Minnetonka
Grandparents (30 to 59 years) White / Caucasian 4 21.8% Responsible for grandchildren15 78.2% Not responsible for grandchildrenAsian 167 100.0% Not responsible for grandchildrenOther race 12 100.0% Responsible for grandchildrenWhite alone, not Hispanic / Latino 3 14.4% Responsible for grandchildren17 85.6% Not responsible for grandchildrenHispanic or Latino 7 100.0% Responsible for grandchildrenGrandparents (60 years and over) White / Caucasian 25 16.0% Responsible for grandchildren130 84.0% Not responsible for grandchildrenAsian 22 100.0% Not responsible for grandchildrenWhite alone, not Hispanic / Latino 25 15.7% Responsible for grandchildren137 84.3% Not responsible for grandchildren