Races in Mission Bend, Texas (TX) Detailed Stats
Data:
Races - White alone (%)
Races - White alone (% change since 2000)
Races - Black alone (%)
Races - Black alone (% change since 2000)
Races - American Indian alone (%)
Races - American Indian alone (% change since 2000)
Races - Asian alone (%)
Races - Asian alone (% change since 2000)
Races - Hispanic (%)
Races - Hispanic (% change since 2000)
Races - Native Hawaiian and Other Pacific Islander alone (%)
Races - Native Hawaiian and Other Pacific Islander alone (% change since 2000)
Races - Two or more races(%)
Races - Two or more races(% change since 2000)
Races - Other race alone (%)
Races - Other race alone (% change since 2000)
Racial diversity
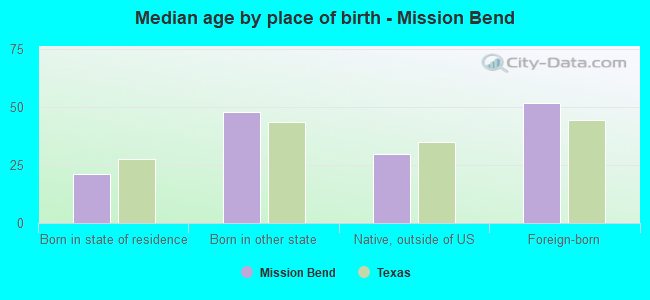
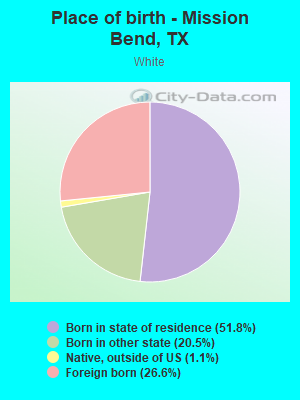
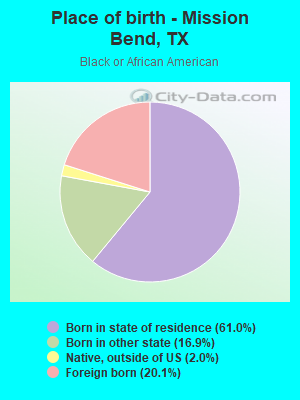
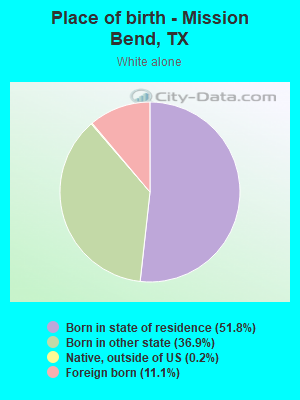
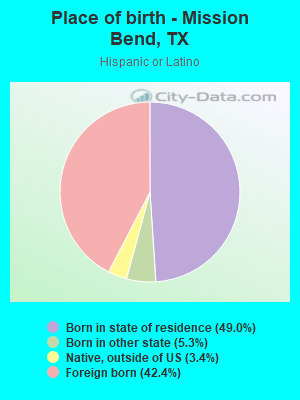
Place of birth - Born in state of residence (%)
Place of birth - Born in state of residence (%) - White
Place of birth - Born in state of residence (%) - Black or African American
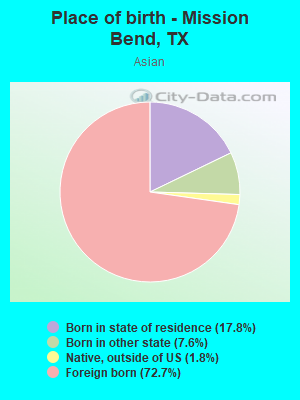
Place of birth - Born in state of residence (%) - Asian
Place of birth - Born in state of residence (%) - Hispanic or Latino
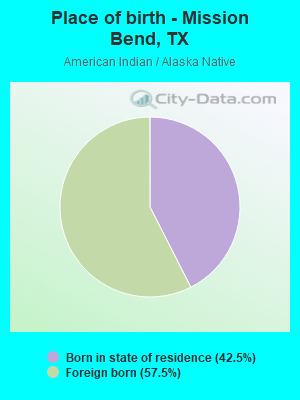
Place of birth - Born in state of residence (%) - American Indian and Alaska Native
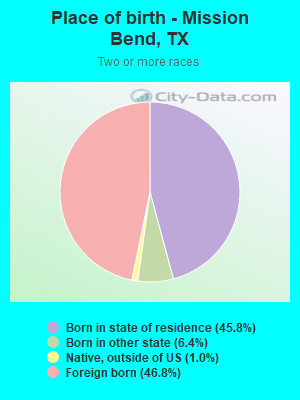
Place of birth - Born in state of residence (%) - Multirace
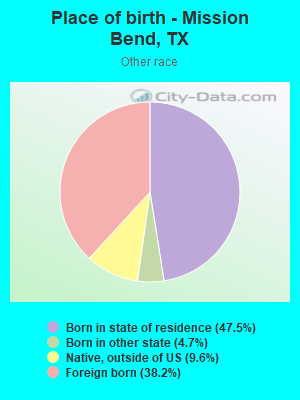
Place of birth - Born in state of residence (%) - Other Race
Place of birth - Born in other state (%)
Place of birth - Born in other state (%) - White
Place of birth - Born in other state (%) - Black or African American
Place of birth - Born in other state (%) - Asian
Place of birth - Born in other state (%) - Hispanic or Latino
Place of birth - Born in other state (%) - American Indian and Alaska Native
Place of birth - Born in other state (%) - Multirace
Place of birth - Born in other state (%) - Other Race
Place of birth - Native, outside of US (%)
Place of birth - Native, outside of US (%) - White
Place of birth - Native, outside of US (%) - Black or African American
Place of birth - Native, outside of US (%) - Asian
Place of birth - Native, outside of US (%) - Hispanic or Latino
Place of birth - Native, outside of US (%) - American Indian and Alaska Native
Place of birth - Native, outside of US (%) - Multirace
Place of birth - Native, outside of US (%) - Other Race
Place of birth - Foreign born (%)
Place of birth - Foreign born (%) - White
Place of birth - Foreign born (%) - Black or African American
Place of birth - Foreign born (%) - Asian
Place of birth - Foreign born (%) - Hispanic or Latino
Place of birth - Foreign born (%) - American Indian and Alaska Native
Place of birth - Foreign born (%) - Multirace
Place of birth - Foreign born (%) - Other Race
Residents speaking English at home (%)
Residents speaking English at home - Born in the United States (%)
Residents speaking English at home - Native, born elsewhere (%)
Residents speaking English at home - Foreign born (%)
Residents speaking Spanish at home (%)
Residents speaking Spanish at home - Born in the United States (%)
Residents speaking Spanish at home - Native, born elsewhere (%)
Residents speaking Spanish at home - Foreign born (%)
Residents speaking other language at home (%)
Residents speaking other language at home - Born in the United States (%)
Residents speaking other language at home - Native, born elsewhere (%)
Residents speaking other language at home - Foreign born (%)
Marital status - Never married (%)
Marital status - Now married (%)
Marital status - Separated (%)
Marital status - Widowed (%)
Marital status - Divorced (%)
Ancestries Reported - Arab (%)
Ancestries Reported - Czech (%)
Ancestries Reported - Danish (%)
Ancestries Reported - Dutch (%)
Ancestries Reported - English (%)
Ancestries Reported - French (%)
Ancestries Reported - French Canadian (%)
Ancestries Reported - German (%)
Ancestries Reported - Greek (%)
Ancestries Reported - Hungarian (%)
Ancestries Reported - Irish (%)
Ancestries Reported - Italian (%)
Ancestries Reported - Lithuanian (%)
Ancestries Reported - Norwegian (%)
Ancestries Reported - Polish (%)
Ancestries Reported - Portuguese (%)
Ancestries Reported - Russian (%)
Ancestries Reported - Scotch-Irish (%)
Ancestries Reported - Scottish (%)
Ancestries Reported - Slovak (%)
Ancestries Reported - Subsaharan African (%)
Ancestries Reported - Swedish (%)
Ancestries Reported - Swiss (%)
Ancestries Reported - Ukrainian (%)
Ancestries Reported - United States (%)
Ancestries Reported - Welsh (%)
Ancestries Reported - West Indian (%)
Ancestries Reported - Other (%)
Geographical mobility - Same house 1 year ago (%)
Geographical mobility - Same house 1 year ago (%) - White
Geographical mobility - Same house 1 year ago (%) - Black or African American
Geographical mobility - Same house 1 year ago (%) - Asian
Geographical mobility - Same house 1 year ago (%) - Hispanic or Latino
Geographical mobility - Same house 1 year ago (%) - American Indian and Alaska Native
Geographical mobility - Same house 1 year ago (%) - Multirace
Geographical mobility - Same house 1 year ago (%) - Other Race
Geographical mobility - Moved within same county (%)
Geographical mobility - Moved within same county (%) - White
Geographical mobility - Moved within same county (%) - Black or African American
Geographical mobility - Moved within same county (%) - Asian
Geographical mobility - Moved within same county (%) - Hispanic or Latino
Geographical mobility - Moved within same county (%) - American Indian and Alaska Native
Geographical mobility - Moved within same county (%) - Multirace
Geographical mobility - Moved within same county (%) - Other Race
Geographical mobility - Moved from different county within same state (%)
Geographical mobility - Moved from different county within same state (%) - White
Geographical mobility - Moved from different county within same state (%) - Black or African American
Geographical mobility - Moved from different county within same state (%) - Asian
Geographical mobility - Moved from different county within same state (%) - Hispanic or Latino
Geographical mobility - Moved from different county within same state (%) - American Indian and Alaska Native
Geographical mobility - Moved from different county within same state (%) - Multirace
Geographical mobility - Moved from different county within same state (%) - Other Race
Geographical mobility - Moved from different state (%)
Geographical mobility - Moved from different state (%) - White
Geographical mobility - Moved from different state (%) - Black or African American
Geographical mobility - Moved from different state (%) - Asian
Geographical mobility - Moved from different state (%) - Hispanic or Latino
Geographical mobility - Moved from different state (%) - American Indian and Alaska Native
Geographical mobility - Moved from different state (%) - Multirace
Geographical mobility - Moved from different state (%) - Other Race
Geographical mobility - Moved from abroad (%)
Geographical mobility - Moved from abroad (%) - White
Geographical mobility - Moved from abroad (%) - Black or African American
Geographical mobility - Moved from abroad (%) - Asian
Geographical mobility - Moved from abroad (%) - Hispanic or Latino
Geographical mobility - Moved from abroad (%) - American Indian and Alaska Native
Geographical mobility - Moved from abroad (%) - Multirace
Geographical mobility - Moved from abroad (%) - Other Race
Place of birth for the foreign-born population - Ireland (%)
Place of birth for the foreign-born population - Denmark (%)
Place of birth for the foreign-born population - Norway (%)
Place of birth for the foreign-born population - Sweden (%)
Place of birth for the foreign-born population - United Kingdom (%)
Place of birth for the foreign-born population - England (%)
Place of birth for the foreign-born population - Scotland (%)
Place of birth for the foreign-born population - Other Northern Europe (%)
Place of birth for the foreign-born population - Austria (%)
Place of birth for the foreign-born population - Belgium (%)
Place of birth for the foreign-born population - France (%)
Place of birth for the foreign-born population - Germany (%)
Place of birth for the foreign-born population - Netherlands (%)
Place of birth for the foreign-born population - Switzerland (%)
Place of birth for the foreign-born population - Other Western Europe (%)
Place of birth for the foreign-born population - Greece (%)
Place of birth for the foreign-born population - Italy (%)
Place of birth for the foreign-born population - Portugal (%)
Place of birth for the foreign-born population - Spain (%)
Place of birth for the foreign-born population - Other Southern Europe (%)
Place of birth for the foreign-born population - Albania (%)
Place of birth for the foreign-born population - Belarus (%)
Place of birth for the foreign-born population - Bosnia and Herzegovina (%)
Place of birth for the foreign-born population - Bulgaria (%)
Place of birth for the foreign-born population - Croatia (%)
Place of birth for the foreign-born population - Czechoslovakia (%)
Place of birth for the foreign-born population - Hungary (%)
Place of birth for the foreign-born population - Latvia (%)
Place of birth for the foreign-born population - Lithuania (%)
Place of birth for the foreign-born population - North Macedonia (Macedonia) (%)
Place of birth for the foreign-born population - Moldova (%)
Place of birth for the foreign-born population - Poland (%)
Place of birth for the foreign-born population - Romania (%)
Place of birth for the foreign-born population - Russia (%)
Place of birth for the foreign-born population - Serbia (%)
Place of birth for the foreign-born population - Ukraine (%)
Place of birth for the foreign-born population - Other Eastern Europe (%)
Place of birth for the foreign-born population - China (%)
Place of birth for the foreign-born population - Hong Kong (%)
Place of birth for the foreign-born population - Taiwan (%)
Place of birth for the foreign-born population - Japan (%)
Place of birth for the foreign-born population - Korea (%)
Place of birth for the foreign-born population - Other Eastern Asia (%)
Place of birth for the foreign-born population - Afghanistan (%)
Place of birth for the foreign-born population - Bangladesh (%)
Place of birth for the foreign-born population - India (%)
Place of birth for the foreign-born population - Iran (%)
Place of birth for the foreign-born population - Kazakhstan (%)
Place of birth for the foreign-born population - Nepal (%)
Place of birth for the foreign-born population - Pakistan (%)
Place of birth for the foreign-born population - Sri Lanka (%)
Place of birth for the foreign-born population - Uzbekistan (%)
Place of birth for the foreign-born population - Other South Central Asia (%)
Place of birth for the foreign-born population - Burma (%)
Place of birth for the foreign-born population - Cambodia (%)
Place of birth for the foreign-born population - Indonesia (%)
Place of birth for the foreign-born population - Laos (%)
Place of birth for the foreign-born population - Malaysia (%)
Place of birth for the foreign-born population - Philippines (%)
Place of birth for the foreign-born population - Singapore (%)
Place of birth for the foreign-born population - Thailand (%)
Place of birth for the foreign-born population - Vietnam (%)
Place of birth for the foreign-born population - Other South Eastern Asia (%)
Place of birth for the foreign-born population - Armenia (%)
Place of birth for the foreign-born population - Iraq (%)
Place of birth for the foreign-born population - Israel (%)
Place of birth for the foreign-born population - Jordan (%)
Place of birth for the foreign-born population - Kuwait (%)
Place of birth for the foreign-born population - Lebanon (%)
Place of birth for the foreign-born population - Saudi Arabia (%)
Place of birth for the foreign-born population - Syria (%)
Place of birth for the foreign-born population - Turkey (%)
Place of birth for the foreign-born population - Yemen (%)
Place of birth for the foreign-born population - Other Western Asia (%)
Place of birth for the foreign-born population - Eritrea (%)
Place of birth for the foreign-born population - Ethiopia (%)
Place of birth for the foreign-born population - Kenya (%)
Place of birth for the foreign-born population - Somalia (%)
Place of birth for the foreign-born population - Uganda (%)
Place of birth for the foreign-born population - Zimbabwe (%)
Place of birth for the foreign-born population - Other Eastern Africa (%)
Place of birth for the foreign-born population - Cameroon (%)
Place of birth for the foreign-born population - Congo (%)
Place of birth for the foreign-born population - Democratic Republic of Congo (Zaire) (%)
Place of birth for the foreign-born population - Other Middle Africa (%)
Place of birth for the foreign-born population - Egypt (%)
Place of birth for the foreign-born population - Morocco (%)
Place of birth for the foreign-born population - Sudan (%)
Place of birth for the foreign-born population - Other Northern Africa (%)
Place of birth for the foreign-born population - South Africa (%)
Place of birth for the foreign-born population - Other Southern Africa (%)
Place of birth for the foreign-born population - Cabo Verde (%)
Place of birth for the foreign-born population - Ghana (%)
Place of birth for the foreign-born population - Liberia (%)
Place of birth for the foreign-born population - Nigeria (%)
Place of birth for the foreign-born population - Senegal (%)
Place of birth for the foreign-born population - Sierra Leone (%)
Place of birth for the foreign-born population - Other Western Africa (%)
Place of birth for the foreign-born population - Australia (%)
Place of birth for the foreign-born population - New Zealand (%)
Place of birth for the foreign-born population - Fiji (%)
Place of birth for the foreign-born population - Micronesia (%)
Place of birth for the foreign-born population - Bahamas (%)
Place of birth for the foreign-born population - Barbados (%)
Place of birth for the foreign-born population - Cuba (%)
Place of birth for the foreign-born population - Dominica (%)
Place of birth for the foreign-born population - Dominican Republic (%)
Place of birth for the foreign-born population - Grenada (%)
Place of birth for the foreign-born population - Haiti (%)
Place of birth for the foreign-born population - Jamaica (%)
Place of birth for the foreign-born population - St. Vincent and the Grenadines (%)
Place of birth for the foreign-born population - Trinidad and Tobago (%)
Place of birth for the foreign-born population - West Indies (%)
Place of birth for the foreign-born population - Other Caribbean (%)
Place of birth for the foreign-born population - Belize (%)
Place of birth for the foreign-born population - Costa Rica (%)
Place of birth for the foreign-born population - El Salvador (%)
Place of birth for the foreign-born population - Guatemala (%)
Place of birth for the foreign-born population - Honduras (%)
Place of birth for the foreign-born population - Mexico (%)
Place of birth for the foreign-born population - Nicaragua (%)
Place of birth for the foreign-born population - Panama (%)
Place of birth for the foreign-born population - Other Central America (%)
Place of birth for the foreign-born population - Argentina (%)
Place of birth for the foreign-born population - Bolivia (%)
Place of birth for the foreign-born population - Brazil (%)
Place of birth for the foreign-born population - Chile (%)
Place of birth for the foreign-born population - Colombia (%)
Place of birth for the foreign-born population - Ecuador (%)
Place of birth for the foreign-born population - Guyana (%)
Place of birth for the foreign-born population - Peru (%)
Place of birth for the foreign-born population - Uruguay (%)
Place of birth for the foreign-born population - Venezuela (%)
Place of birth for the foreign-born population - Other South America (%)
Place of birth for the foreign-born population - Canada (%)
Place of birth for the foreign-born population - Other Northern America (%)
Place of birth for the foreign-born population - Other (%)
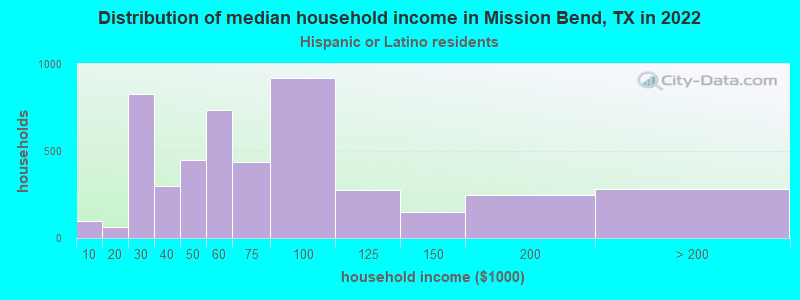
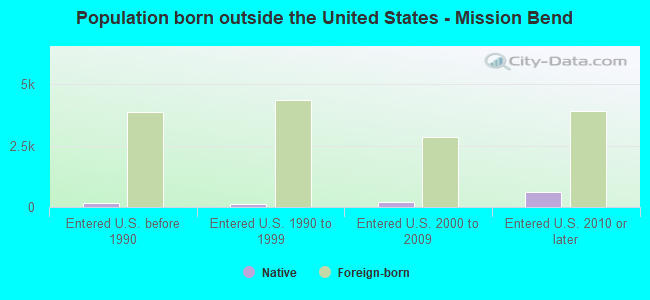
According to 2022 data, the most numerous races in Mission Bend, TX are Hispanic (17,375 residents), White alone (4,018 residents), and Black alone (12,241 residents). 43.8% of Mission Bend residents speak English at home. 36.6% of Mission Bend, TX residents are foreign-born (19.7% born in Latin America, 10.6% born in Asia, 6.6% born in Africa), which is 53.6% greater than the foreign-born rate of 17.0% across the entire state of Texas.
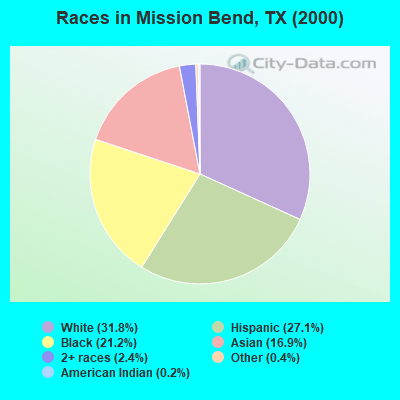
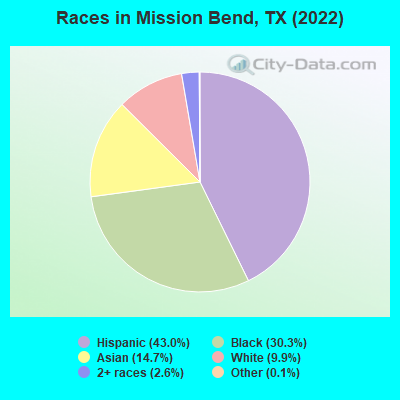
Race distribution in Mission Bend
2000 2022
10,933,313 52.4% White alone 6,669,666 32.0% Hispanic 2,364,255 11.3% Black alone 554,445 2.7% Asian alone 230,567 1.1% Two or more races 68,859 0.3% American Indian alone 19,958 0.10% Other race alone 10,757 0.05% Native Hawaiian and Other
12,070,642 40.2% Hispanic 11,683,430 38.9% White alone 3,508,706 11.7% Black alone 1,608,173 5.4% Asian alone 956,560 3.2% Two or more races 125,763 0.4% Other race alone 47,023 0.2% American Indian alone 29,275 0.10% Native Hawaiian and Other
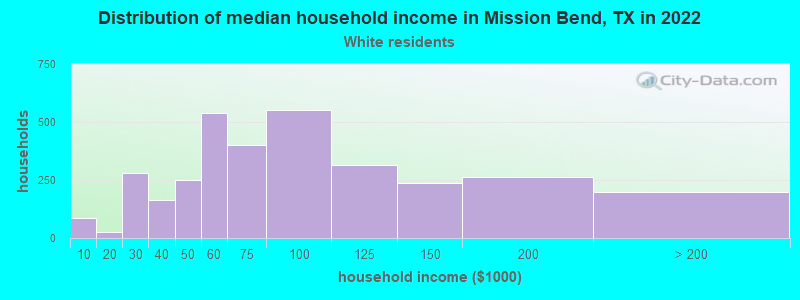
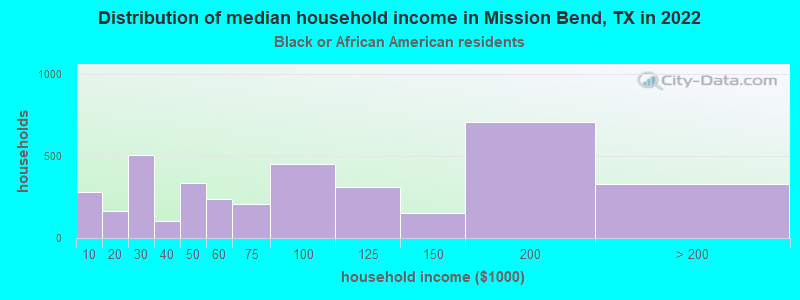
Income and house value in Mission Bend Median household income in 2022 $63,840 White non-Hispanic householders$80,985 Black householders$52,270 Asian householders$52,188 Some other race householders$62,830 Two or more races householders$61,998 Hispanic or Latino race householdersMedian 2022 house value $217,450 White Non-Hispanic householders$214,208 Black or African American householders$189,770 American Indian or Alaska Native householders $230,417 Asian householders$342,883 Native Hawaiian and other Pacific Islander householders$184,034 Some other race householders$187,276 Two or more races householders$188,274 Hispanic or Latino householders
Median age by race in Mission Bend
36.1 Median age for White residents36.0 36.8 35.4 Median age for Black or African American residents28.7 36.8 52.8 Median age for American Indian / Alaska Native residents51.4 54.0 49.7 Median age for Asian residents44.7 53.8 -581,560,283.1 Median age for Native Hawaiian / Pacific Islander residents-612,729,233.5 -577,777,777.2 26.7 Median age for Other race residents31.3 25.5 41.6 Median age for Two or more races residents36.0 45.1 55.8 Median age for White alone residents60.3 54.8 32.0 Median age for Hispanic or Latino residents31.2 32.4
Owner/renter occupied households by race in Mission Bend
House owners and renters - White residents 2,823 85.9% Owner occupied463 14.1% Renter occupiedHouse owners and renters - Black or African American residents 2,612 72.3% Owner occupied998 27.7% Renter occupiedHouse owners and renters - American Indian / Alaska Native residents 57 100.0% Owner occupiedHouse owners and renters - Asian residents 1,717 86.1% Owner occupied276 13.9% Renter occupiedHouse owners and renters - Native Hawaiian / Pacific Islander residents 15 100.0% Owner occupiedHouse owners and renters - Other race residents 779 56.1% Owner occupied608 43.9% Renter occupiedHouse owners and renters - Two or more races residents 2,013 84.8% Owner occupied361 15.2% Renter occupiedHouse owners and renters - White alone residents 1,707 89.9% Owner occupied191 10.1% Renter occupiedHouse owners and renters - Hispanic or Latino residents 3,440 77.8% Owner occupied980 22.2% Renter occupied
Language usage in Mission Bend
English speakers - Total 43.8% of residents of Mission Bend speak English at home.
33.7% of residents speak Spanish at home 7,401 57.4% Speak English very well5,491 42.6% Speak English less than very well22.7% of residents speak other language at home 5,756 66.4% Speak English very well2,919 33.6% Speak English less than very well
English speakers - Born in the United States 75.9% of residents of Mission Bend speak English at home.
17.1% of residents speak Spanish at home 646 75.4% Speak English very well211 24.6% Speak English less than very well8.9% of residents speak other language at home 406 91.2% Speak English very well39 8.8% Speak English less than very well
English speakers - Native, born elsewhere 40.4% of residents of Mission Bend speak English at home.
38.6% of residents speak Spanish at home 63 16.4% Speak English very well320 83.6% Speak English less than very well27.5% of residents speak other language at home 191 70.0% Speak English very well82 30.0% Speak English less than very well
English speakers - Foreign-born 15.3% of residents of Mission Bend speak English at home.
43.1% of residents speak Spanish at home 2,249 34.1% Speak English very well4,346 65.9% Speak English less than very well40.1% of residents speak other language at home 3,355 54.7% Speak English very well2,774 45.3% Speak English less than very well
White (Caucasian) - Speak only English Native:
73.0% (4,489)Foreign-born:
16.9% (412)
White (Caucasian) - Speak another language Native:
18.7% (1,151)Foreign-born:
78.0% (1,907)
Black or African American - Speak only English Native:
83.1% (7,436)Foreign-born:
37.5% (920)
Black or African American - Speak another language Native:
9.3% (833)Foreign-born:
62.4% (1,532)
American Indian / Alaska Native - Speak another language Native:
100.0% (125)Foreign-born:
98.9% (140)
Asian - Speak only English Native:
48.6% (735)Foreign-born:
9.5% (401)
Asian - Speak another language Native:
51.4% (777)Foreign-born:
90.4% (3,838)
Other race - Speak only English Native:
31.9% (1,071)Foreign-born:
7.7% (158)
Other race - Speak another language Native:
68.4% (2,295)Foreign-born:
87.2% (1,797)
Two or more races - Speak only English Native:
28.2% (1,223)Foreign-born:
3.0% (119)
Two or more races - Speak another language Native:
77.9% (3,385)Foreign-born:
91.5% (3,631)
White alone - Speak only English Native:
94.8% (3,289)Foreign-born:
18.8% (77)
White alone - Speak another language Native:
5.2% (179)Foreign-born:
80.3% (330)
Hispanic or Latino - Speak only English Native:
32.6% (2,892)Foreign-born:
13.4% (975)
Hispanic or Latino - Speak another language Native:
69.2% (6,141)Foreign-born:
88.5% (6,458)
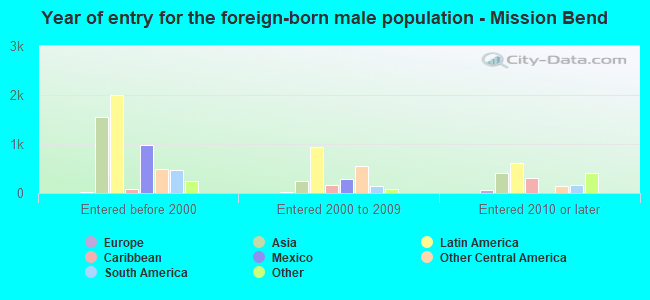
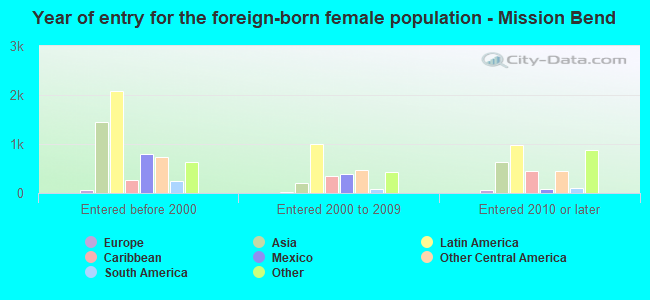
Foreign-born residents in Mission Bend 14,804 residents are foreign born (19.7% Latin America , 10.6% Asia , 6.6% Africa ).
This city:
36.6%Texas:
17.1%
Marital status for residents in Mission Bend Marital status - White (Caucasian) population 15 years and over
Males 32.6% Never married54.8% Now married2.8% Separated1.2% Widowed8.6% DivorcedFemales 29.2% Never married54.1% Now married1.8% Separated7.8% Widowed7.2% DivorcedWomen who gave birth in the past 12 months Now married:
100.0% (142)Unmarried:
0.0% (0)
Women who did not give birth in the past 12 months Now married:
41.4% (792)Unmarried:
58.6% (1,122)
Marital status - Black or African American population 15 years and over
Males 39.6% Never married53.2% Now married1.9% Separated0.3% Widowed5.1% DivorcedFemales 36.7% Never married39.2% Now married6.9% Separated6.3% Widowed10.9% DivorcedWomen who gave birth in the past 12 months Now married:
77.4% (66)Unmarried:
22.6% (19)
Women who did not give birth in the past 12 months Now married:
35.4% (1,179)Unmarried:
64.6% (2,147)
Marital status - American Indian / Alaska Native population 15 years and over
Males 0.0% Never married100.0% Now married0.0% Separated0.0% Widowed0.0% DivorcedFemales 0.0% Never married100.0% Now married0.0% Separated0.0% Widowed0.0% DivorcedWomen who did not give birth in the past 12 months Now married:
100.0% (46)Unmarried:
0.0% (0)
Marital status - Asian population 15 years and over
Males 33.8% Never married60.5% Now married2.2% Separated1.5% Widowed2.1% DivorcedFemales 13.8% Never married64.7% Now married2.3% Separated10.4% Widowed8.8% DivorcedWomen who gave birth in the past 12 months Now married:
100.0% (38)Unmarried:
0.0% (0)
Women who did not give birth in the past 12 months Now married:
57.1% (583)Unmarried:
42.9% (439)
Marital status - Other race population 15 years and over
Males 42.3% Never married45.3% Now married0.0% Separated5.4% Widowed7.1% DivorcedFemales 48.2% Never married39.5% Now married1.3% Separated3.4% Widowed7.5% DivorcedWomen who gave birth in the past 12 months Now married:
0.0% (0)Unmarried:
100.0% (61)
Women who did not give birth in the past 12 months Now married:
36.8% (660)Unmarried:
63.2% (1,132)
Marital status - Two or more races population 15 years and over
Males 39.1% Never married55.1% Now married0.0% Separated0.6% Widowed5.2% DivorcedFemales 28.5% Never married49.8% Now married3.2% Separated8.2% Widowed10.3% DivorcedWomen who gave birth in the past 12 months Now married:
100.0% (83)Unmarried:
0.0% (0)
Women who did not give birth in the past 12 months Now married:
46.2% (866)Unmarried:
53.8% (1,007)
Marital status - White alone, not Hispanic / Latino population 15 years and over
Males 17.3% Never married58.7% Now married5.4% Separated2.1% Widowed16.6% DivorcedFemales 31.0% Never married54.7% Now married0.0% Separated9.9% Widowed4.4% DivorcedWomen who did not give birth in the past 12 months Now married:
37.5% (269)Unmarried:
62.5% (448)
Marital status - Hispanic or Latino population 15 years and over
Males 40.3% Never married52.0% Now married0.6% Separated1.8% Widowed5.3% DivorcedFemales 32.5% Never married49.9% Now married2.7% Separated6.4% Widowed8.5% DivorcedWomen who gave birth in the past 12 months Now married:
78.1% (231)Unmarried:
21.9% (64)
Women who did not give birth in the past 12 months Now married:
43.0% (1,785)Unmarried:
57.0% (2,362)
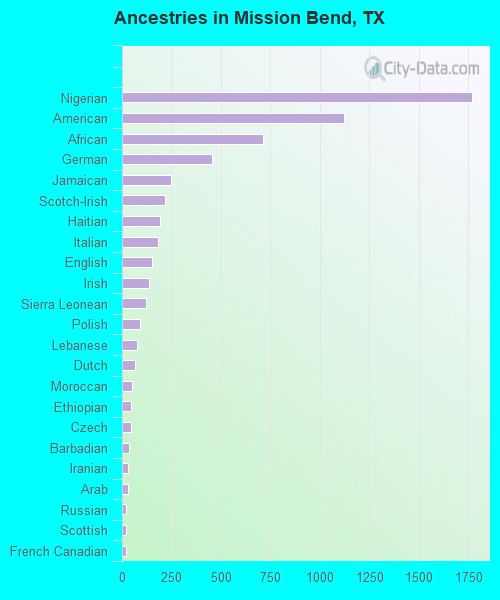
Ancestries in Mission Bend
1,767 6.9% Nigerian1,122 4.4% American713 2.8% African457 1.8% German247 1.0% Jamaican215 0.8% Scotch-Irish191 0.7% Haitian181 0.7% Italian152 0.6% English135 0.5% Irish119 0.5% Sierra Leonean91 0.4% Polish76 0.3% Lebanese66 0.3% Dutch52 0.2% Moroccan45 0.2% Ethiopian44 0.2% Czech33 0.1% Barbadian30 0.1% Iranian28 0.1% Arab22 0.09% Russian22 0.09% Scottish18 0.07% French Canadian10 0.04% Liberian7 0.03% Lithuanian6 0.02% Trinidadian and Tobagonian5 0.02% European5 0.02% Guyanese
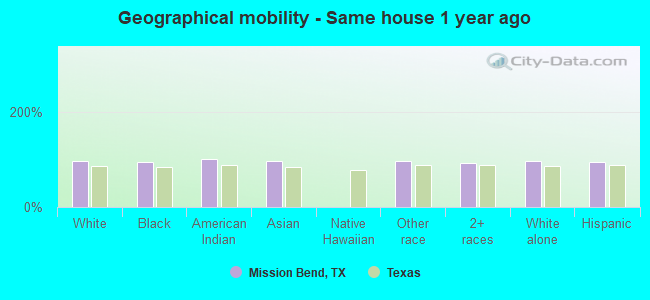
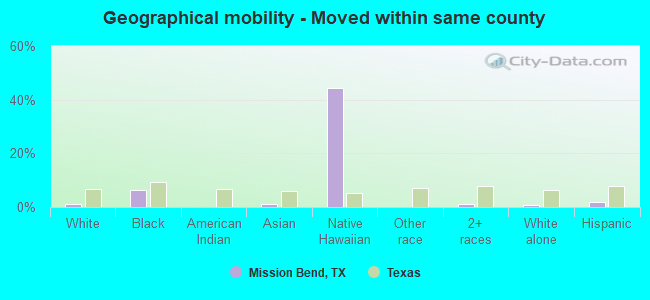
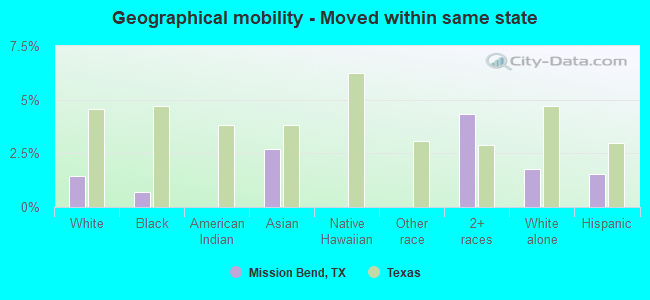
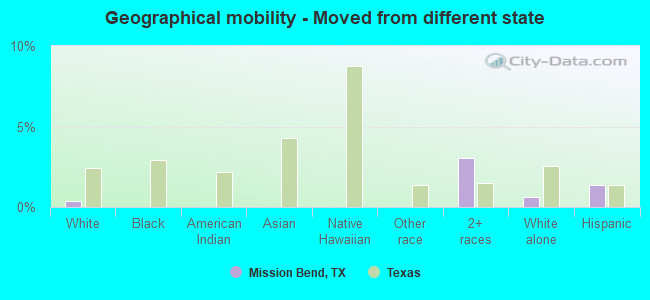
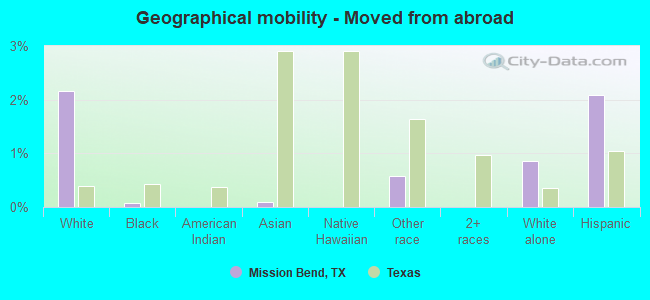
Geographical mobility in Mission Bend Same house 1 year ago 9,120 95.6% White (Caucasian)11,857 94.9% Black or African American255 100.0% American Indian / Alaska Native5,745 97.3% Asian5,269 97.1% Other race7,597 91.8% Two or more races3,843 96.3% White alone, not Hispanic / Latino16,247 94.2% Hispanic or LatinoMoved within same county 96 1.0% White / Caucasian796 6.4% Black or African American64 1.1% Asian6 44.4% Native Hawaiian / Pacific Islander5 0.1% Other race97 1.2% Two or more races33 0.8% White alone, not Hispanic / Latino313 1.8% Hispanic or LatinoMoved within same state 140 1.5% White / Caucasian86 0.7% Black or African American160 2.7% Asian358 4.3% Two or more races72 1.8% White alone, not Hispanic / Latino269 1.6% Hispanic or LatinoMoved from different state 34 0.4% White / Caucasian252 3.0% Two or more races25 0.6% White alone, not Hispanic / Latino237 1.4% Hispanic or LatinoMoved from abroad 207 2.2% White9 0.1% Black or African American6 0.1% Asian31 0.6% Other race34 0.9% White alone, not Hispanic / Latino359 2.1% Hispanic or Latino
Children Nativity (place of birth) in Mission Bend
Children under 6 years - Living with two parents Both parents native 465 100.0% NativeBoth parents foreign-born 384 100.0% NativeOne native, one foreign-born parent 372 100.0% NativeChildren under 6 years - Living with one parent Native parent 377 100.0% NativeForeign-born parent 1,044 87.9% Native144 12.1% Foreign-bornChildren 6 to 17 years - Living with two parents Both parents native 1,238 99.9% Native1 0.1% Foreign-bornBoth parents foreign-born 1,482 70.6% Native616 29.4% Foreign-bornOne native, one foreign-born parent 705 95.1% Native37 4.9% Foreign-bornChildren 6 to 17 years - Living with one parent Native parent 876 100.0% NativeForeign-born parent 1,470 53.0% Native1,305 47.0% Foreign-born
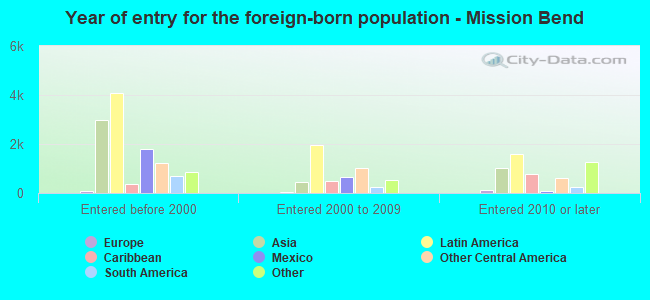
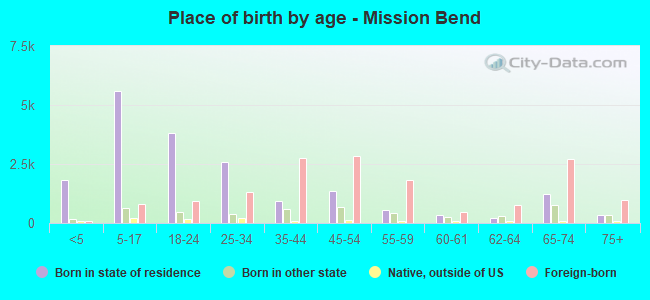
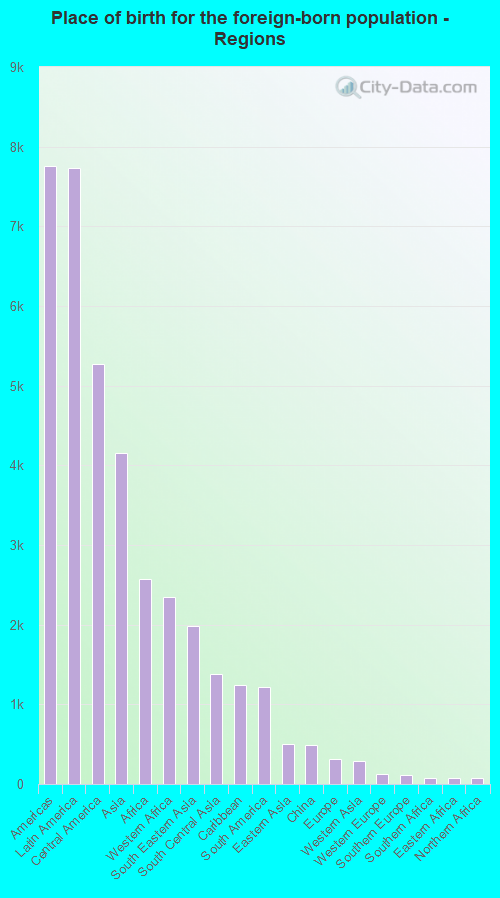
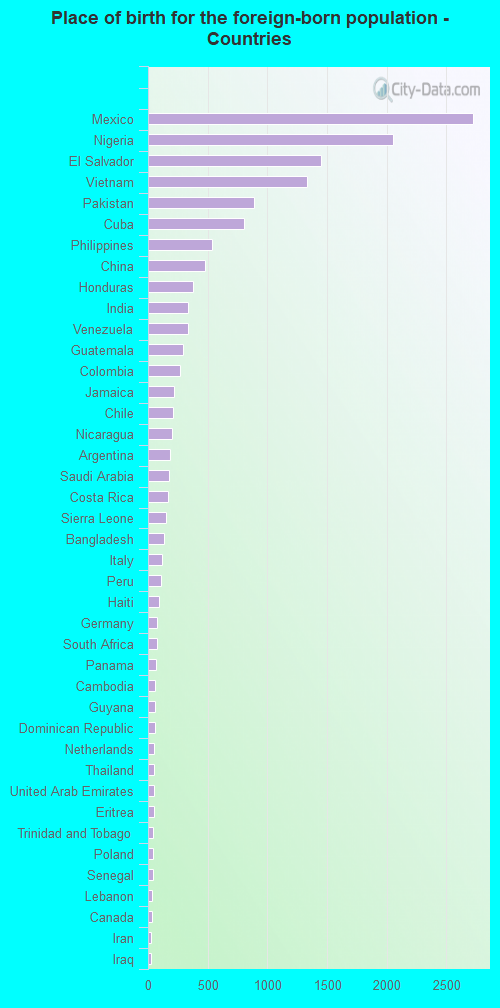
Place of birth for residents in Mission Bend 7,759 Americas7,728 Latin America5,272 Central America4,157 Asia2,570 Africa2,344 Western Africa1,978 South Eastern Asia1,386 South Central Asia1,240 Caribbean1,214 South America505 Eastern Asia492 China317 Europe287 Western Asia131 Western Europe117 Southern Europe79 Southern Africa73 Eastern Africa72 Northern Africa44 Eastern Europe31 Northern America23 Northern Europe2,720 Mexico2,051 Nigeria1,450 El Salvador1,331 Vietnam886 Pakistan807 Cuba536 Philippines480 China373 Honduras334 India331 Venezuela291 Guatemala271 Colombia220 Jamaica206 Chile202 Nicaragua184 Argentina178 Saudi Arabia166 Costa Rica152 Sierra Leone136 Bangladesh117 Italy108 Peru92 Haiti79 Germany79 South Africa68 Panama60 Cambodia59 Guyana55 Dominican Republic51 Netherlands49 Thailand48 United Arab Emirates48 Eritrea44 Trinidad and Tobago44 Poland44 Senegal32 Lebanon31 Canada29 Iran27 Iraq24 Kenya16 United Kingdom13 Korea12 Liberia11 Hong Kong9 Uruguay7 Scotland6 Brazil
Grandparents responsible for own grandchildren in Mission Bend
Grandparents (30 to 59 years) White / Caucasian 87 100.0% Not responsible for grandchildrenBlack or African American 102 93.4% Responsible for grandchildren7 6.6% Not responsible for grandchildrenAsian 9 15.6% Responsible for grandchildren49 84.4% Not responsible for grandchildrenOther race 66 100.0% Not responsible for grandchildrenTwo or more races 20 14.7% Responsible for grandchildren114 85.3% Not responsible for grandchildrenWhite alone, not Hispanic / Latino 15 100.0% Not responsible for grandchildrenHispanic or Latino 325 100.0% Not responsible for grandchildrenGrandparents (60 years and over) White / Caucasian 52 38.6% Responsible for grandchildren83 61.4% Not responsible for grandchildrenBlack or African American 27 7.3% Responsible for grandchildren343 92.7% Not responsible for grandchildrenAsian 119 50.4% Responsible for grandchildren118 49.6% Not responsible for grandchildrenOther race 151 100.0% Not responsible for grandchildrenTwo or more races 42 23.3% Responsible for grandchildren140 76.7% Not responsible for grandchildrenWhite alone, not Hispanic / Latino 46 100.0% Responsible for grandchildrenHispanic or Latino 39 9.0% Responsible for grandchildren393 91.0% Not responsible for grandchildren