Races in Mission, Kansas (KS) Detailed Stats
Data:
Races - White alone (%)
Races - White alone (% change since 2000)
Races - Black alone (%)
Races - Black alone (% change since 2000)
Races - American Indian alone (%)
Races - American Indian alone (% change since 2000)
Races - Asian alone (%)
Races - Asian alone (% change since 2000)
Races - Hispanic (%)
Races - Hispanic (% change since 2000)
Races - Native Hawaiian and Other Pacific Islander alone (%)
Races - Native Hawaiian and Other Pacific Islander alone (% change since 2000)
Races - Two or more races(%)
Races - Two or more races(% change since 2000)
Races - Other race alone (%)
Races - Other race alone (% change since 2000)
Racial diversity
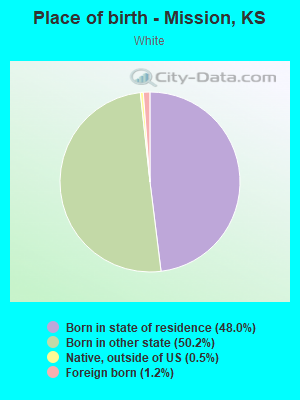
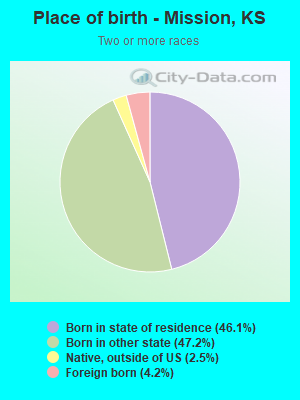
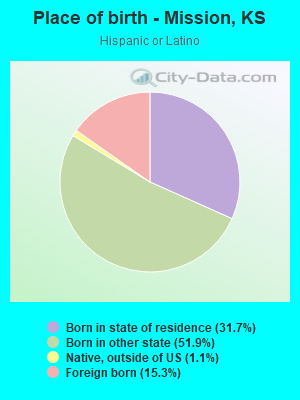
Place of birth - Born in state of residence (%)
Place of birth - Born in state of residence (%) - White
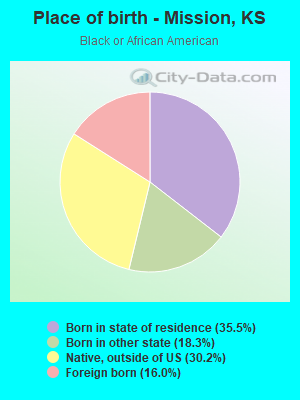
Place of birth - Born in state of residence (%) - Black or African American
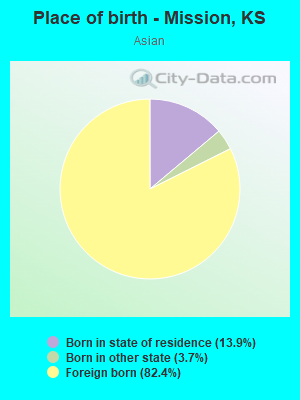
Place of birth - Born in state of residence (%) - Asian
Place of birth - Born in state of residence (%) - Hispanic or Latino
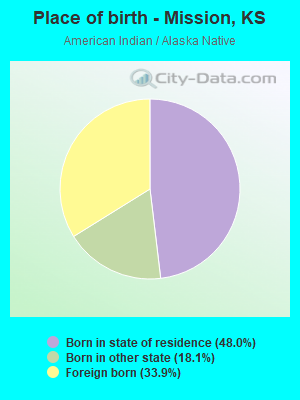
Place of birth - Born in state of residence (%) - American Indian and Alaska Native
Place of birth - Born in state of residence (%) - Multirace
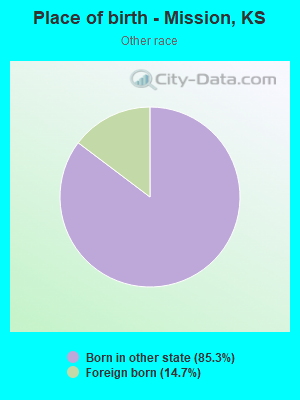
Place of birth - Born in state of residence (%) - Other Race
Place of birth - Born in other state (%)
Place of birth - Born in other state (%) - White
Place of birth - Born in other state (%) - Black or African American
Place of birth - Born in other state (%) - Asian
Place of birth - Born in other state (%) - Hispanic or Latino
Place of birth - Born in other state (%) - American Indian and Alaska Native
Place of birth - Born in other state (%) - Multirace
Place of birth - Born in other state (%) - Other Race
Place of birth - Native, outside of US (%)
Place of birth - Native, outside of US (%) - White
Place of birth - Native, outside of US (%) - Black or African American
Place of birth - Native, outside of US (%) - Asian
Place of birth - Native, outside of US (%) - Hispanic or Latino
Place of birth - Native, outside of US (%) - American Indian and Alaska Native
Place of birth - Native, outside of US (%) - Multirace
Place of birth - Native, outside of US (%) - Other Race
Place of birth - Foreign born (%)
Place of birth - Foreign born (%) - White
Place of birth - Foreign born (%) - Black or African American
Place of birth - Foreign born (%) - Asian
Place of birth - Foreign born (%) - Hispanic or Latino
Place of birth - Foreign born (%) - American Indian and Alaska Native
Place of birth - Foreign born (%) - Multirace
Place of birth - Foreign born (%) - Other Race
Residents speaking English at home (%)
Residents speaking English at home - Born in the United States (%)
Residents speaking English at home - Native, born elsewhere (%)
Residents speaking English at home - Foreign born (%)
Residents speaking Spanish at home (%)
Residents speaking Spanish at home - Born in the United States (%)
Residents speaking Spanish at home - Native, born elsewhere (%)
Residents speaking Spanish at home - Foreign born (%)
Residents speaking other language at home (%)
Residents speaking other language at home - Born in the United States (%)
Residents speaking other language at home - Native, born elsewhere (%)
Residents speaking other language at home - Foreign born (%)
Marital status - Never married (%)
Marital status - Now married (%)
Marital status - Separated (%)
Marital status - Widowed (%)
Marital status - Divorced (%)
Ancestries Reported - Arab (%)
Ancestries Reported - Czech (%)
Ancestries Reported - Danish (%)
Ancestries Reported - Dutch (%)
Ancestries Reported - English (%)
Ancestries Reported - French (%)
Ancestries Reported - French Canadian (%)
Ancestries Reported - German (%)
Ancestries Reported - Greek (%)
Ancestries Reported - Hungarian (%)
Ancestries Reported - Irish (%)
Ancestries Reported - Italian (%)
Ancestries Reported - Lithuanian (%)
Ancestries Reported - Norwegian (%)
Ancestries Reported - Polish (%)
Ancestries Reported - Portuguese (%)
Ancestries Reported - Russian (%)
Ancestries Reported - Scotch-Irish (%)
Ancestries Reported - Scottish (%)
Ancestries Reported - Slovak (%)
Ancestries Reported - Subsaharan African (%)
Ancestries Reported - Swedish (%)
Ancestries Reported - Swiss (%)
Ancestries Reported - Ukrainian (%)
Ancestries Reported - United States (%)
Ancestries Reported - Welsh (%)
Ancestries Reported - West Indian (%)
Ancestries Reported - Other (%)
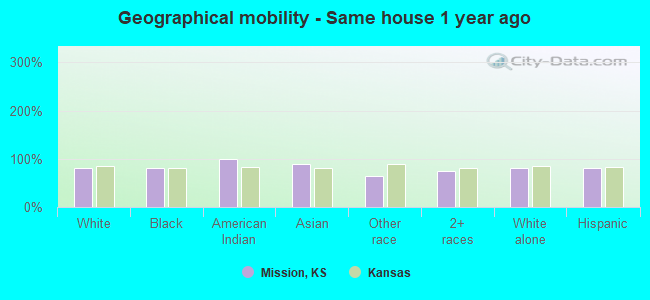
Geographical mobility - Same house 1 year ago (%)
Geographical mobility - Same house 1 year ago (%) - White
Geographical mobility - Same house 1 year ago (%) - Black or African American
Geographical mobility - Same house 1 year ago (%) - Asian
Geographical mobility - Same house 1 year ago (%) - Hispanic or Latino
Geographical mobility - Same house 1 year ago (%) - American Indian and Alaska Native
Geographical mobility - Same house 1 year ago (%) - Multirace
Geographical mobility - Same house 1 year ago (%) - Other Race
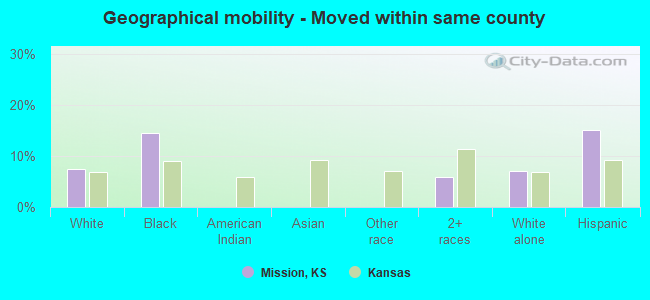
Geographical mobility - Moved within same county (%)
Geographical mobility - Moved within same county (%) - White
Geographical mobility - Moved within same county (%) - Black or African American
Geographical mobility - Moved within same county (%) - Asian
Geographical mobility - Moved within same county (%) - Hispanic or Latino
Geographical mobility - Moved within same county (%) - American Indian and Alaska Native
Geographical mobility - Moved within same county (%) - Multirace
Geographical mobility - Moved within same county (%) - Other Race
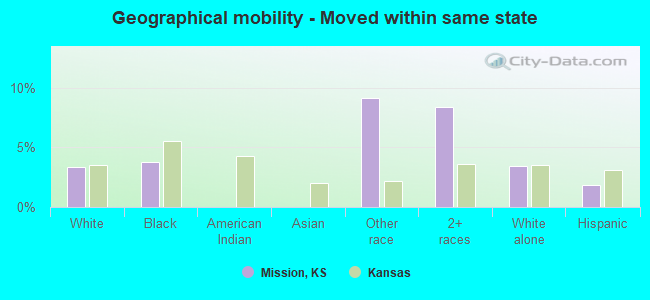
Geographical mobility - Moved from different county within same state (%)
Geographical mobility - Moved from different county within same state (%) - White
Geographical mobility - Moved from different county within same state (%) - Black or African American
Geographical mobility - Moved from different county within same state (%) - Asian
Geographical mobility - Moved from different county within same state (%) - Hispanic or Latino
Geographical mobility - Moved from different county within same state (%) - American Indian and Alaska Native
Geographical mobility - Moved from different county within same state (%) - Multirace
Geographical mobility - Moved from different county within same state (%) - Other Race
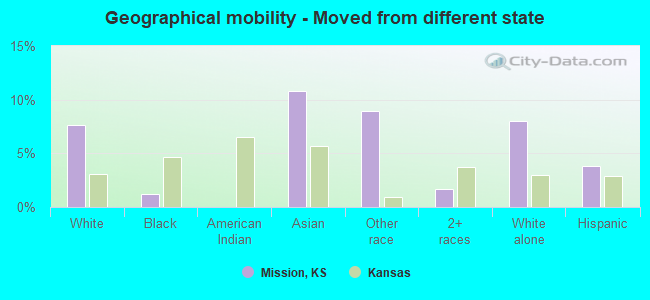
Geographical mobility - Moved from different state (%)
Geographical mobility - Moved from different state (%) - White
Geographical mobility - Moved from different state (%) - Black or African American
Geographical mobility - Moved from different state (%) - Asian
Geographical mobility - Moved from different state (%) - Hispanic or Latino
Geographical mobility - Moved from different state (%) - American Indian and Alaska Native
Geographical mobility - Moved from different state (%) - Multirace
Geographical mobility - Moved from different state (%) - Other Race
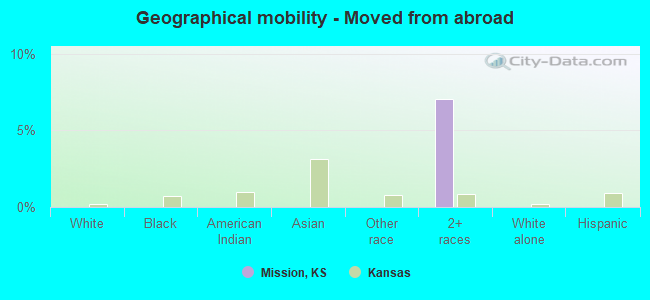
Geographical mobility - Moved from abroad (%)
Geographical mobility - Moved from abroad (%) - White
Geographical mobility - Moved from abroad (%) - Black or African American
Geographical mobility - Moved from abroad (%) - Asian
Geographical mobility - Moved from abroad (%) - Hispanic or Latino
Geographical mobility - Moved from abroad (%) - American Indian and Alaska Native
Geographical mobility - Moved from abroad (%) - Multirace
Geographical mobility - Moved from abroad (%) - Other Race
Place of birth for the foreign-born population - Ireland (%)
Place of birth for the foreign-born population - Denmark (%)
Place of birth for the foreign-born population - Norway (%)
Place of birth for the foreign-born population - Sweden (%)
Place of birth for the foreign-born population - United Kingdom (%)
Place of birth for the foreign-born population - England (%)
Place of birth for the foreign-born population - Scotland (%)
Place of birth for the foreign-born population - Other Northern Europe (%)
Place of birth for the foreign-born population - Austria (%)
Place of birth for the foreign-born population - Belgium (%)
Place of birth for the foreign-born population - France (%)
Place of birth for the foreign-born population - Germany (%)
Place of birth for the foreign-born population - Netherlands (%)
Place of birth for the foreign-born population - Switzerland (%)
Place of birth for the foreign-born population - Other Western Europe (%)
Place of birth for the foreign-born population - Greece (%)
Place of birth for the foreign-born population - Italy (%)
Place of birth for the foreign-born population - Portugal (%)
Place of birth for the foreign-born population - Spain (%)
Place of birth for the foreign-born population - Other Southern Europe (%)
Place of birth for the foreign-born population - Albania (%)
Place of birth for the foreign-born population - Belarus (%)
Place of birth for the foreign-born population - Bosnia and Herzegovina (%)
Place of birth for the foreign-born population - Bulgaria (%)
Place of birth for the foreign-born population - Croatia (%)
Place of birth for the foreign-born population - Czechoslovakia (%)
Place of birth for the foreign-born population - Hungary (%)
Place of birth for the foreign-born population - Latvia (%)
Place of birth for the foreign-born population - Lithuania (%)
Place of birth for the foreign-born population - North Macedonia (Macedonia) (%)
Place of birth for the foreign-born population - Moldova (%)
Place of birth for the foreign-born population - Poland (%)
Place of birth for the foreign-born population - Romania (%)
Place of birth for the foreign-born population - Russia (%)
Place of birth for the foreign-born population - Serbia (%)
Place of birth for the foreign-born population - Ukraine (%)
Place of birth for the foreign-born population - Other Eastern Europe (%)
Place of birth for the foreign-born population - China (%)
Place of birth for the foreign-born population - Hong Kong (%)
Place of birth for the foreign-born population - Taiwan (%)
Place of birth for the foreign-born population - Japan (%)
Place of birth for the foreign-born population - Korea (%)
Place of birth for the foreign-born population - Other Eastern Asia (%)
Place of birth for the foreign-born population - Afghanistan (%)
Place of birth for the foreign-born population - Bangladesh (%)
Place of birth for the foreign-born population - India (%)
Place of birth for the foreign-born population - Iran (%)
Place of birth for the foreign-born population - Kazakhstan (%)
Place of birth for the foreign-born population - Nepal (%)
Place of birth for the foreign-born population - Pakistan (%)
Place of birth for the foreign-born population - Sri Lanka (%)
Place of birth for the foreign-born population - Uzbekistan (%)
Place of birth for the foreign-born population - Other South Central Asia (%)
Place of birth for the foreign-born population - Burma (%)
Place of birth for the foreign-born population - Cambodia (%)
Place of birth for the foreign-born population - Indonesia (%)
Place of birth for the foreign-born population - Laos (%)
Place of birth for the foreign-born population - Malaysia (%)
Place of birth for the foreign-born population - Philippines (%)
Place of birth for the foreign-born population - Singapore (%)
Place of birth for the foreign-born population - Thailand (%)
Place of birth for the foreign-born population - Vietnam (%)
Place of birth for the foreign-born population - Other South Eastern Asia (%)
Place of birth for the foreign-born population - Armenia (%)
Place of birth for the foreign-born population - Iraq (%)
Place of birth for the foreign-born population - Israel (%)
Place of birth for the foreign-born population - Jordan (%)
Place of birth for the foreign-born population - Kuwait (%)
Place of birth for the foreign-born population - Lebanon (%)
Place of birth for the foreign-born population - Saudi Arabia (%)
Place of birth for the foreign-born population - Syria (%)
Place of birth for the foreign-born population - Turkey (%)
Place of birth for the foreign-born population - Yemen (%)
Place of birth for the foreign-born population - Other Western Asia (%)
Place of birth for the foreign-born population - Eritrea (%)
Place of birth for the foreign-born population - Ethiopia (%)
Place of birth for the foreign-born population - Kenya (%)
Place of birth for the foreign-born population - Somalia (%)
Place of birth for the foreign-born population - Uganda (%)
Place of birth for the foreign-born population - Zimbabwe (%)
Place of birth for the foreign-born population - Other Eastern Africa (%)
Place of birth for the foreign-born population - Cameroon (%)
Place of birth for the foreign-born population - Congo (%)
Place of birth for the foreign-born population - Democratic Republic of Congo (Zaire) (%)
Place of birth for the foreign-born population - Other Middle Africa (%)
Place of birth for the foreign-born population - Egypt (%)
Place of birth for the foreign-born population - Morocco (%)
Place of birth for the foreign-born population - Sudan (%)
Place of birth for the foreign-born population - Other Northern Africa (%)
Place of birth for the foreign-born population - South Africa (%)
Place of birth for the foreign-born population - Other Southern Africa (%)
Place of birth for the foreign-born population - Cabo Verde (%)
Place of birth for the foreign-born population - Ghana (%)
Place of birth for the foreign-born population - Liberia (%)
Place of birth for the foreign-born population - Nigeria (%)
Place of birth for the foreign-born population - Senegal (%)
Place of birth for the foreign-born population - Sierra Leone (%)
Place of birth for the foreign-born population - Other Western Africa (%)
Place of birth for the foreign-born population - Australia (%)
Place of birth for the foreign-born population - New Zealand (%)
Place of birth for the foreign-born population - Fiji (%)
Place of birth for the foreign-born population - Micronesia (%)
Place of birth for the foreign-born population - Bahamas (%)
Place of birth for the foreign-born population - Barbados (%)
Place of birth for the foreign-born population - Cuba (%)
Place of birth for the foreign-born population - Dominica (%)
Place of birth for the foreign-born population - Dominican Republic (%)
Place of birth for the foreign-born population - Grenada (%)
Place of birth for the foreign-born population - Haiti (%)
Place of birth for the foreign-born population - Jamaica (%)
Place of birth for the foreign-born population - St. Vincent and the Grenadines (%)
Place of birth for the foreign-born population - Trinidad and Tobago (%)
Place of birth for the foreign-born population - West Indies (%)
Place of birth for the foreign-born population - Other Caribbean (%)
Place of birth for the foreign-born population - Belize (%)
Place of birth for the foreign-born population - Costa Rica (%)
Place of birth for the foreign-born population - El Salvador (%)
Place of birth for the foreign-born population - Guatemala (%)
Place of birth for the foreign-born population - Honduras (%)
Place of birth for the foreign-born population - Mexico (%)
Place of birth for the foreign-born population - Nicaragua (%)
Place of birth for the foreign-born population - Panama (%)
Place of birth for the foreign-born population - Other Central America (%)
Place of birth for the foreign-born population - Argentina (%)
Place of birth for the foreign-born population - Bolivia (%)
Place of birth for the foreign-born population - Brazil (%)
Place of birth for the foreign-born population - Chile (%)
Place of birth for the foreign-born population - Colombia (%)
Place of birth for the foreign-born population - Ecuador (%)
Place of birth for the foreign-born population - Guyana (%)
Place of birth for the foreign-born population - Peru (%)
Place of birth for the foreign-born population - Uruguay (%)
Place of birth for the foreign-born population - Venezuela (%)
Place of birth for the foreign-born population - Other South America (%)
Place of birth for the foreign-born population - Canada (%)
Place of birth for the foreign-born population - Other Northern America (%)
Place of birth for the foreign-born population - Other (%)
Latest news about races in Mission, KS collected exclusively by city-data.com from local newspapers, TV, and radio stations
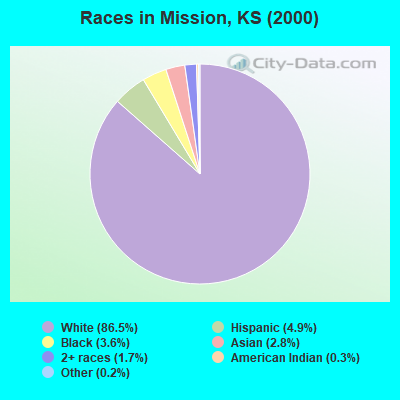
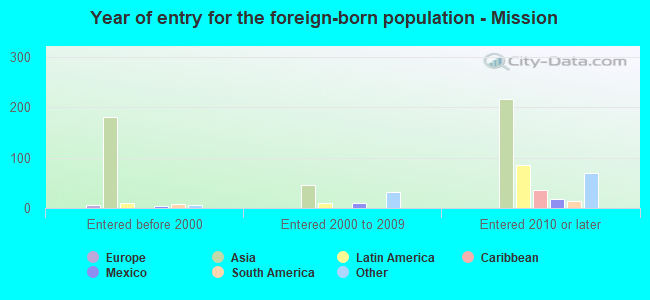
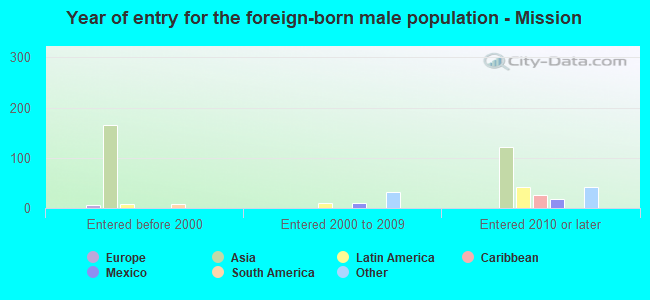
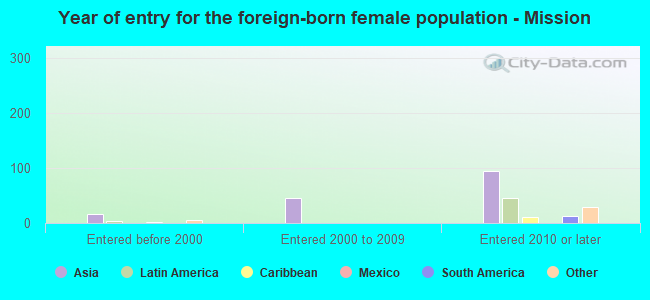
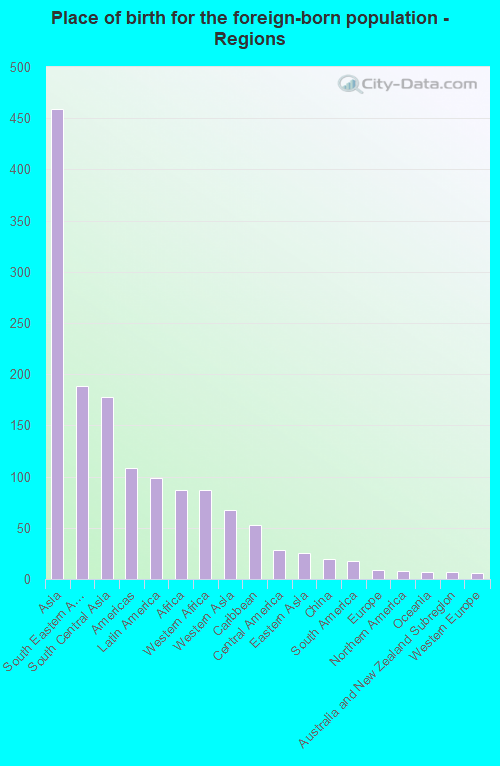
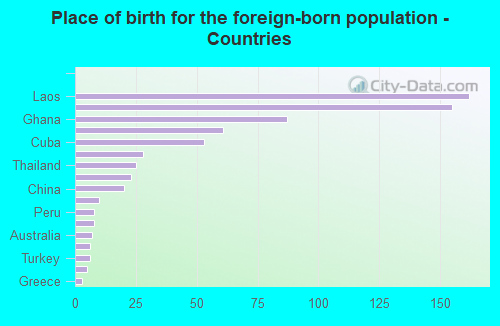
According to 2022 data, the most numerous races in Mission, KS are White alone (7,983 residents), Hispanic (654 residents), and Black alone (467 residents). 91.0% of Mission residents speak English at home. 6.7% of Mission, KS residents are foreign-born (4.6% born in Asia, 1.0% born in Latin America, 0.9% born in Africa), which is 4.5% less than the foreign-born rate of 7.0% across the entire state of Kansas.
Race distribution in Mission
2000 2022
2,233,997 83.1% White alone 188,252 7.0% Hispanic 151,407 5.6% Black alone 46,301 1.7% Asian alone 42,508 1.6% Two or more races 22,322 0.8% American Indian alone 2,477 0.09% Other race alone 1,154 0.04% Native Hawaiian and Other
2,147,943 73.1% White alone 381,746 13.0% Hispanic 147,666 5.0% Black alone 145,362 4.9% Two or more races 85,085 2.9% Asian alone 13,263 0.5% Other race alone 12,065 0.4% American Indian alone 4,020 0.1% Native Hawaiian and Other
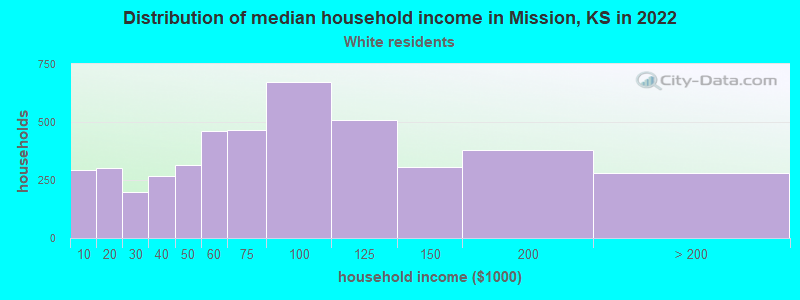
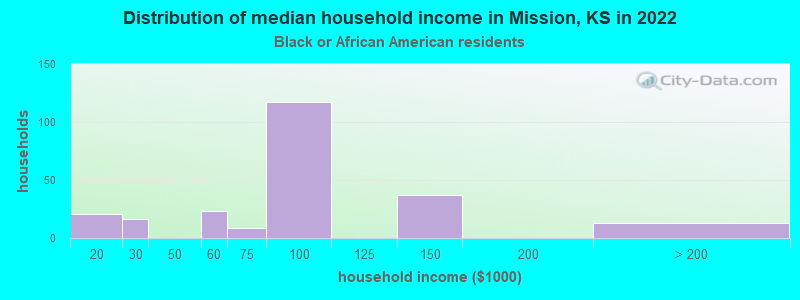
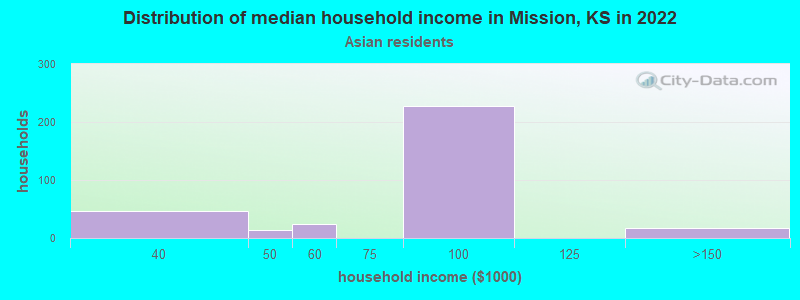
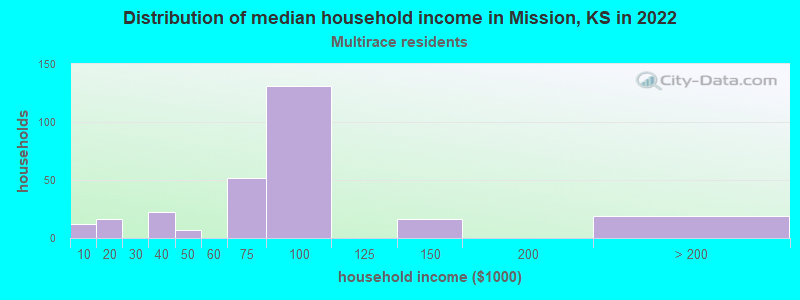
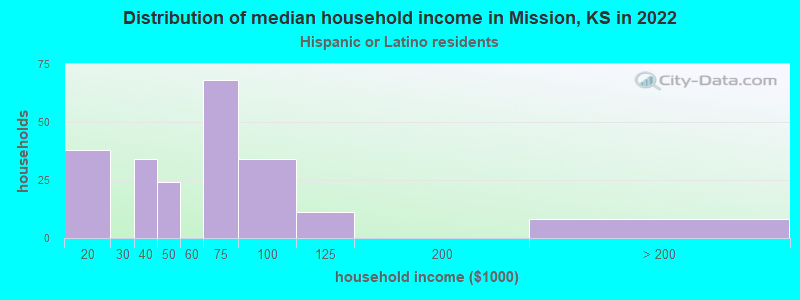
Income and house value in Mission Median household income in 2022 $75,016 White non-Hispanic householders$76,732 Black householders$92,521 Asian householders$78,764 Two or more races householders$41,702 Hispanic or Latino race householdersMedian 2022 house value $270,415 White Non-Hispanic householders$270,901 Black or African American householders$133,628 Native Hawaiian and other Pacific Islander householders$224,010 Some other race householders$253,165 Two or more races householders$240,288 Hispanic or Latino householders
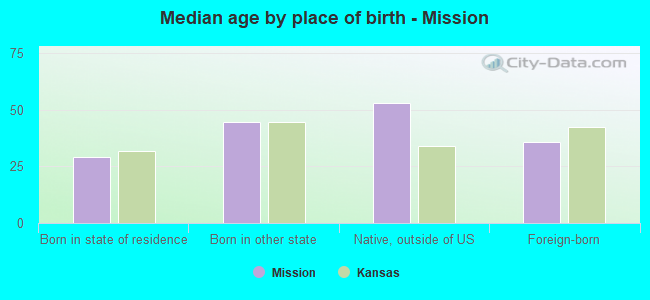
Median age by race in Mission
35.8 Median age for White residents35.7 36.9 29.2 Median age for Black or African American residents35.2 28.5 26.0 Median age for American Indian / Alaska Native residents26.5 14.1 42.1 Median age for Asian residents70.1 28.8 -1,068,376,067.3 Median age for Native Hawaiian / Pacific Islander residents-669,240,668.6 -641,269,840.6 47.6 Median age for Other race residents48.3 -670,588,234.6 29.6 Median age for Two or more races residents29.7 36.1 35.5 Median age for White alone residents35.4 37.7 31.4 Median age for Hispanic or Latino residents31.1 37.2
Owner/renter occupied households by race in Mission
House owners and renters - White residents 2,154 49.0% Owner occupied2,241 51.0% Renter occupiedHouse owners and renters - Black or African American residents 24 11.5% Owner occupied184 88.5% Renter occupiedHouse owners and renters - American Indian / Alaska Native residents 9 100.0% Renter occupiedHouse owners and renters - Asian residents 190 55.5% Owner occupied152 44.5% Renter occupiedHouse owners and renters - Other race residents 25 100.0% Renter occupiedHouse owners and renters - Two or more races residents 94 31.4% Owner occupied204 68.6% Renter occupiedHouse owners and renters - White alone residents 2,160 49.8% Owner occupied2,180 50.2% Renter occupiedHouse owners and renters - Hispanic or Latino residents 52 21.5% Owner occupied190 78.5% Renter occupied
Language usage in Mission
English speakers - Total 91.0% of residents of Mission speak English at home.
2.5% of residents speak Spanish at home 190 81.2% Speak English very well44 18.8% Speak English less than very well7.0% of residents speak other language at home 342 52.5% Speak English very well309 47.5% Speak English less than very well
English speakers - Born in the United States 96.7% of residents of Mission speak English at home.
2.9% of residents speak Spanish at home 125 95.4% Speak English very well6 4.6% Speak English less than very well0.4% of residents speak other language at home 18 100.0% Speak English very well
English speakers - Native, born elsewhere 13.4% of residents of Mission speak English at home.
86.6% of residents speak other language at home 115 89.1% Speak English very well14 10.9% Speak English less than very well
English speakers - Foreign-born 14.1% of residents of Mission speak English at home.
15.8% of residents speak Spanish at home 64 64.6% Speak English very well35 35.4% Speak English less than very well74.1% of residents speak other language at home 173 37.3% Speak English very well291 62.7% Speak English less than very well
White (Caucasian) - Speak only English Native:
99.0% (7,527)Foreign-born:
16.2% (13)
White (Caucasian) - Speak another language Native:
1.3% (99)Foreign-born:
77.0% (63)
Black or African American - Speak another language Native:
41.3% (132)Foreign-born:
100.0% (81)
Asian - Speak only English Native:
93.7% (79)Foreign-born:
16.0% (59)
Asian - Speak another language Native:
17.3% (15)Foreign-born:
83.7% (310)
Other race - Speak another language Native:
20.6% (30)Foreign-born:
86.9% (24)
Two or more races - Speak only English Native:
85.6% (383)Foreign-born:
67.2% (16)
Two or more races - Speak another language Native:
14.7% (66)Foreign-born:
25.3% (6)
White alone - Speak only English Native:
98.3% (7,298)Foreign-born:
21.7% (14)
White alone - Speak another language Native:
1.7% (123)Foreign-born:
77.8% (48)
Hispanic or Latino - Speak only English Native:
91.1% (431)Foreign-born:
12.4% (13)
Hispanic or Latino - Speak another language Native:
14.5% (69)Foreign-born:
88.8% (91)
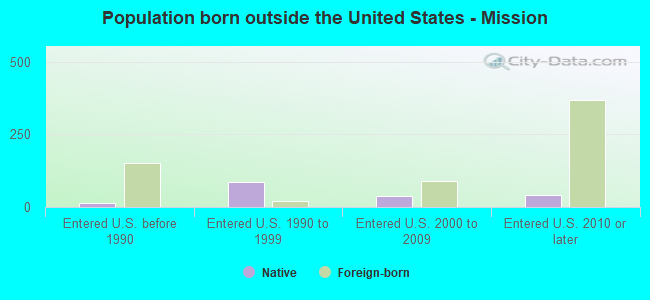
Foreign-born residents in Mission 672 residents are foreign born (4.6% Asia , 1.0% Latin America , 0.9% Africa ).
This city:
6.7%Kansas:
7.1%
Marital status for residents in Mission Marital status - White (Caucasian) population 15 years and over
Males 43.3% Never married45.5% Now married0.3% Separated4.0% Widowed6.8% DivorcedFemales 40.2% Never married41.8% Now married2.8% Separated5.2% Widowed9.9% DivorcedWomen who gave birth in the past 12 months Now married:
100.0% (139)Unmarried:
0.0% (0)
Women who did not give birth in the past 12 months Now married:
33.8% (731)Unmarried:
66.2% (1,435)
Marital status - Black or African American population 15 years and over
Males 27.7% Never married37.8% Now married0.0% Separated0.4% Widowed34.0% DivorcedFemales 21.5% Never married54.8% Now married0.0% Separated11.9% Widowed11.9% DivorcedWomen who did not give birth in the past 12 months Now married:
68.8% (70)Unmarried:
31.2% (32)
Marital status - American Indian / Alaska Native population 15 years and over
Males 54.5% Never married45.5% Now married0.0% Separated0.0% Widowed0.0% DivorcedFemales 88.9% Never married11.1% Now married0.0% Separated0.0% Widowed0.0% DivorcedWomen who did not give birth in the past 12 months Now married:
0.0% (0)Unmarried:
100.0% (9)
Marital status - Asian population 15 years and over
Males 13.8% Never married28.2% Now married0.0% Separated0.0% Widowed58.0% DivorcedFemales 47.9% Never married34.5% Now married0.0% Separated0.0% Widowed17.6% DivorcedWomen who did not give birth in the past 12 months Now married:
41.5% (50)Unmarried:
58.5% (70)
Marital status - Other race population 15 years and over
Males 44.3% Never married55.7% Now married0.0% Separated0.0% Widowed0.0% DivorcedFemales 0.0% Never married100.0% Now married0.0% Separated0.0% Widowed0.0% DivorcedWomen who did not give birth in the past 12 months Now married:
100.0% (12)Unmarried:
0.0% (0)
Marital status - Two or more races population 15 years and over
Males 38.7% Never married46.6% Now married10.4% Separated4.3% Widowed0.0% DivorcedFemales 42.1% Never married51.6% Now married0.0% Separated0.0% Widowed6.3% DivorcedWomen who did not give birth in the past 12 months Now married:
40.0% (63)Unmarried:
60.0% (94)
Marital status - White alone, not Hispanic / Latino population 15 years and over
Males 42.8% Never married46.1% Now married0.3% Separated3.8% Widowed7.1% DivorcedFemales 40.3% Never married43.0% Now married1.0% Separated5.4% Widowed10.3% DivorcedWomen who gave birth in the past 12 months Now married:
100.0% (142)Unmarried:
0.0% (0)
Women who did not give birth in the past 12 months Now married:
32.1% (667)Unmarried:
67.9% (1,412)
Marital status - Hispanic or Latino population 15 years and over
Males 50.5% Never married45.3% Now married0.0% Separated4.2% Widowed0.0% DivorcedFemales 30.0% Never married34.8% Now married33.8% Separated0.0% Widowed1.4% DivorcedWomen who did not give birth in the past 12 months Now married:
62.0% (109)Unmarried:
38.0% (67)
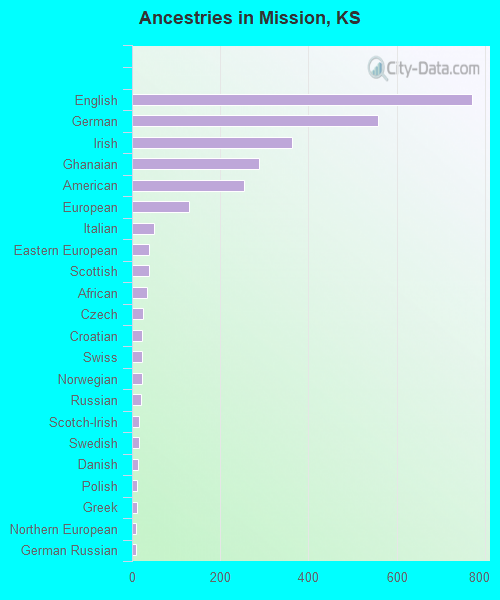
Ancestries in Mission
771 19.5% English558 14.1% German363 9.2% Irish289 7.3% Ghanaian253 6.4% American130 3.3% European50 1.3% Italian39 1.0% Eastern European39 1.0% Scottish35 0.9% African26 0.7% Czech23 0.6% Croatian23 0.6% Swiss22 0.6% Norwegian21 0.5% Russian16 0.4% Scotch-Irish15 0.4% Swedish14 0.4% Danish12 0.3% Polish11 0.3% Greek9 0.2% Northern European8 0.2% German Russian6 0.2% Austrian5 0.1% Slovene4 0.1% Turkish
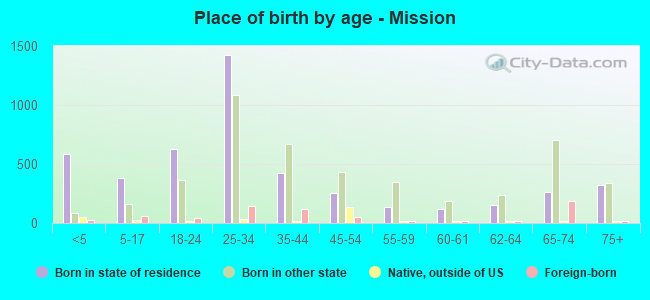
Children Nativity (place of birth) in Mission
Children under 6 years - Living with two parents Both parents native 620 99.4% Native4 0.6% Foreign-bornBoth parents foreign-born 31 50.6% Native30 49.4% Foreign-bornChildren under 6 years - Living with one parent Native parent 87 100.0% NativeChildren 6 to 17 years - Living with two parents Both parents native 353 98.2% Native6 1.8% Foreign-bornBoth parents foreign-born 39 39.6% Native60 60.4% Foreign-bornChildren 6 to 17 years - Living with one parent Native parent 106 100.0% Native