Races in Missoula, Montana (MT) Detailed Stats
Data:
Races - White alone (%)
Races - White alone (% change since 2000)
Races - Black alone (%)
Races - Black alone (% change since 2000)
Races - American Indian alone (%)
Races - American Indian alone (% change since 2000)
Races - Asian alone (%)
Races - Asian alone (% change since 2000)
Races - Hispanic (%)
Races - Hispanic (% change since 2000)
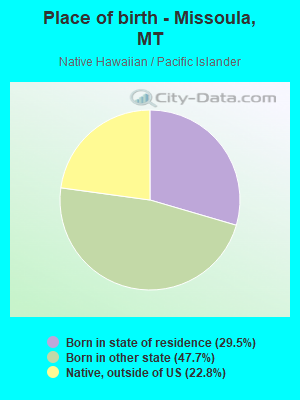
Races - Native Hawaiian and Other Pacific Islander alone (%)
Races - Native Hawaiian and Other Pacific Islander alone (% change since 2000)
Races - Two or more races(%)
Races - Two or more races(% change since 2000)
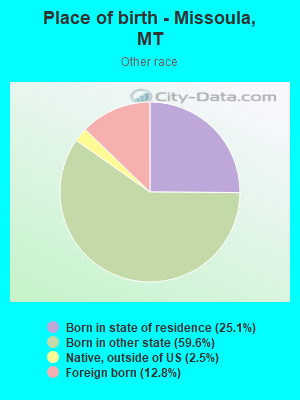
Races - Other race alone (%)
Races - Other race alone (% change since 2000)
Racial diversity
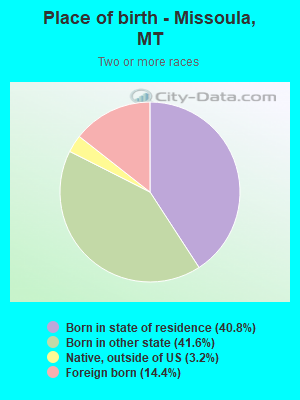
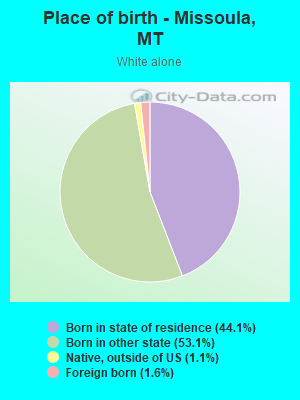
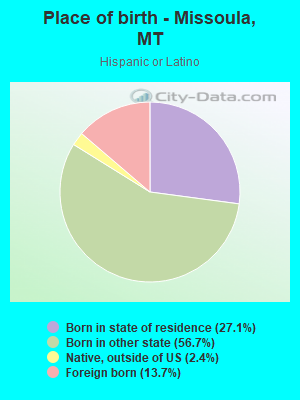
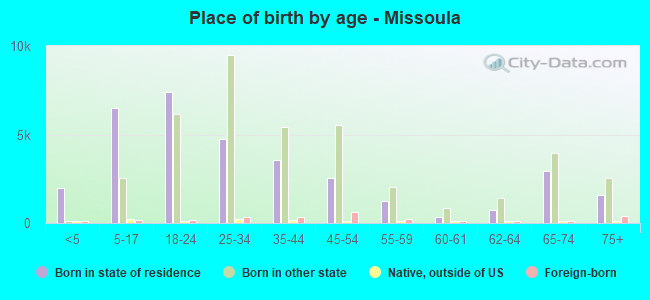
Place of birth - Born in state of residence (%)
Place of birth - Born in state of residence (%) - White
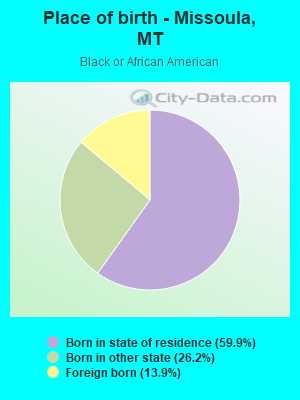
Place of birth - Born in state of residence (%) - Black or African American
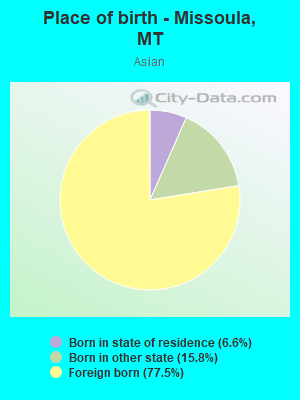
Place of birth - Born in state of residence (%) - Asian
Place of birth - Born in state of residence (%) - Hispanic or Latino
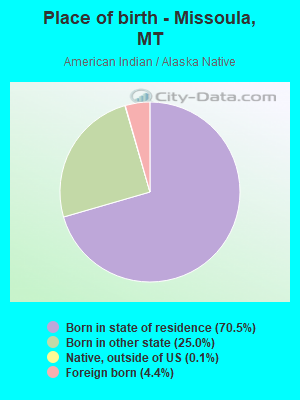
Place of birth - Born in state of residence (%) - American Indian and Alaska Native
Place of birth - Born in state of residence (%) - Multirace
Place of birth - Born in state of residence (%) - Other Race
Place of birth - Born in other state (%)
Place of birth - Born in other state (%) - White
Place of birth - Born in other state (%) - Black or African American
Place of birth - Born in other state (%) - Asian
Place of birth - Born in other state (%) - Hispanic or Latino
Place of birth - Born in other state (%) - American Indian and Alaska Native
Place of birth - Born in other state (%) - Multirace
Place of birth - Born in other state (%) - Other Race
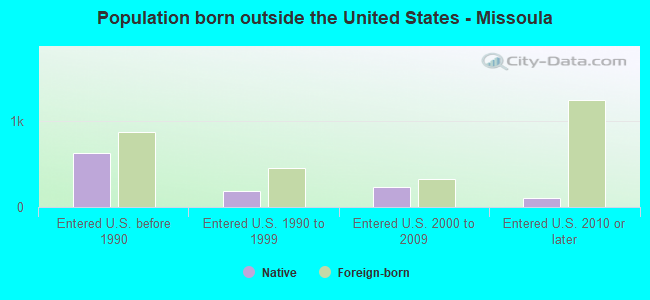
Place of birth - Native, outside of US (%)
Place of birth - Native, outside of US (%) - White
Place of birth - Native, outside of US (%) - Black or African American
Place of birth - Native, outside of US (%) - Asian
Place of birth - Native, outside of US (%) - Hispanic or Latino
Place of birth - Native, outside of US (%) - American Indian and Alaska Native
Place of birth - Native, outside of US (%) - Multirace
Place of birth - Native, outside of US (%) - Other Race
Place of birth - Foreign born (%)
Place of birth - Foreign born (%) - White
Place of birth - Foreign born (%) - Black or African American
Place of birth - Foreign born (%) - Asian
Place of birth - Foreign born (%) - Hispanic or Latino
Place of birth - Foreign born (%) - American Indian and Alaska Native
Place of birth - Foreign born (%) - Multirace
Place of birth - Foreign born (%) - Other Race
Residents speaking English at home (%)
Residents speaking English at home - Born in the United States (%)
Residents speaking English at home - Native, born elsewhere (%)
Residents speaking English at home - Foreign born (%)
Residents speaking Spanish at home (%)
Residents speaking Spanish at home - Born in the United States (%)
Residents speaking Spanish at home - Native, born elsewhere (%)
Residents speaking Spanish at home - Foreign born (%)
Residents speaking other language at home (%)
Residents speaking other language at home - Born in the United States (%)
Residents speaking other language at home - Native, born elsewhere (%)
Residents speaking other language at home - Foreign born (%)
Marital status - Never married (%)
Marital status - Now married (%)
Marital status - Separated (%)
Marital status - Widowed (%)
Marital status - Divorced (%)
Ancestries Reported - Arab (%)
Ancestries Reported - Czech (%)
Ancestries Reported - Danish (%)
Ancestries Reported - Dutch (%)
Ancestries Reported - English (%)
Ancestries Reported - French (%)
Ancestries Reported - French Canadian (%)
Ancestries Reported - German (%)
Ancestries Reported - Greek (%)
Ancestries Reported - Hungarian (%)
Ancestries Reported - Irish (%)
Ancestries Reported - Italian (%)
Ancestries Reported - Lithuanian (%)
Ancestries Reported - Norwegian (%)
Ancestries Reported - Polish (%)
Ancestries Reported - Portuguese (%)
Ancestries Reported - Russian (%)
Ancestries Reported - Scotch-Irish (%)
Ancestries Reported - Scottish (%)
Ancestries Reported - Slovak (%)
Ancestries Reported - Subsaharan African (%)
Ancestries Reported - Swedish (%)
Ancestries Reported - Swiss (%)
Ancestries Reported - Ukrainian (%)
Ancestries Reported - United States (%)
Ancestries Reported - Welsh (%)
Ancestries Reported - West Indian (%)
Ancestries Reported - Other (%)
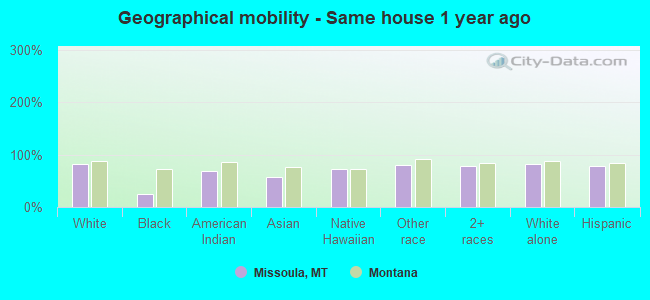
Geographical mobility - Same house 1 year ago (%)
Geographical mobility - Same house 1 year ago (%) - White
Geographical mobility - Same house 1 year ago (%) - Black or African American
Geographical mobility - Same house 1 year ago (%) - Asian
Geographical mobility - Same house 1 year ago (%) - Hispanic or Latino
Geographical mobility - Same house 1 year ago (%) - American Indian and Alaska Native
Geographical mobility - Same house 1 year ago (%) - Multirace
Geographical mobility - Same house 1 year ago (%) - Other Race
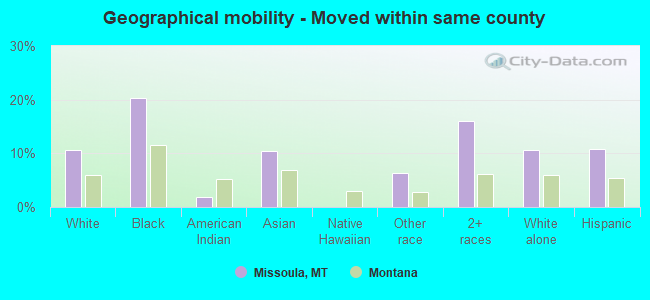
Geographical mobility - Moved within same county (%)
Geographical mobility - Moved within same county (%) - White
Geographical mobility - Moved within same county (%) - Black or African American
Geographical mobility - Moved within same county (%) - Asian
Geographical mobility - Moved within same county (%) - Hispanic or Latino
Geographical mobility - Moved within same county (%) - American Indian and Alaska Native
Geographical mobility - Moved within same county (%) - Multirace
Geographical mobility - Moved within same county (%) - Other Race
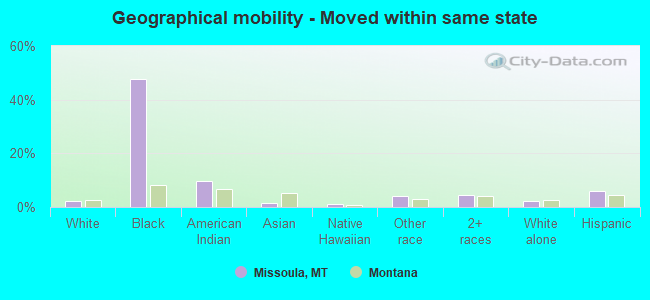
Geographical mobility - Moved from different county within same state (%)
Geographical mobility - Moved from different county within same state (%) - White
Geographical mobility - Moved from different county within same state (%) - Black or African American
Geographical mobility - Moved from different county within same state (%) - Asian
Geographical mobility - Moved from different county within same state (%) - Hispanic or Latino
Geographical mobility - Moved from different county within same state (%) - American Indian and Alaska Native
Geographical mobility - Moved from different county within same state (%) - Multirace
Geographical mobility - Moved from different county within same state (%) - Other Race
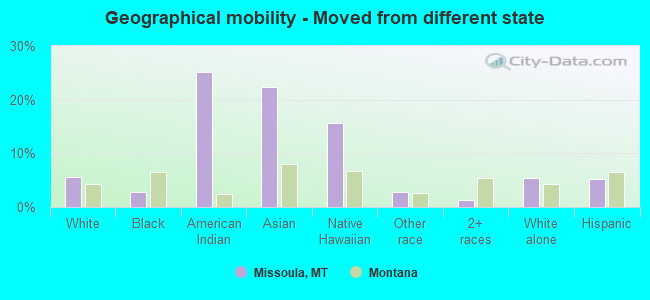
Geographical mobility - Moved from different state (%)
Geographical mobility - Moved from different state (%) - White
Geographical mobility - Moved from different state (%) - Black or African American
Geographical mobility - Moved from different state (%) - Asian
Geographical mobility - Moved from different state (%) - Hispanic or Latino
Geographical mobility - Moved from different state (%) - American Indian and Alaska Native
Geographical mobility - Moved from different state (%) - Multirace
Geographical mobility - Moved from different state (%) - Other Race
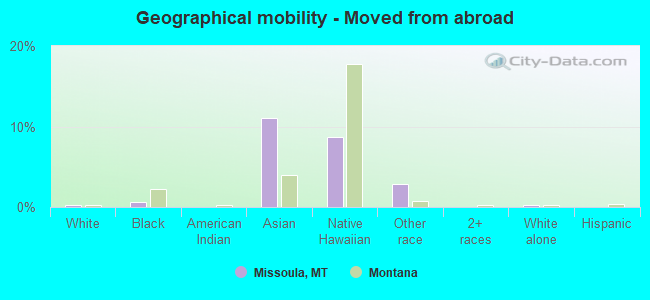
Geographical mobility - Moved from abroad (%)
Geographical mobility - Moved from abroad (%) - White
Geographical mobility - Moved from abroad (%) - Black or African American
Geographical mobility - Moved from abroad (%) - Asian
Geographical mobility - Moved from abroad (%) - Hispanic or Latino
Geographical mobility - Moved from abroad (%) - American Indian and Alaska Native
Geographical mobility - Moved from abroad (%) - Multirace
Geographical mobility - Moved from abroad (%) - Other Race
Place of birth for the foreign-born population - Ireland (%)
Place of birth for the foreign-born population - Denmark (%)
Place of birth for the foreign-born population - Norway (%)
Place of birth for the foreign-born population - Sweden (%)
Place of birth for the foreign-born population - United Kingdom (%)
Place of birth for the foreign-born population - England (%)
Place of birth for the foreign-born population - Scotland (%)
Place of birth for the foreign-born population - Other Northern Europe (%)
Place of birth for the foreign-born population - Austria (%)
Place of birth for the foreign-born population - Belgium (%)
Place of birth for the foreign-born population - France (%)
Place of birth for the foreign-born population - Germany (%)
Place of birth for the foreign-born population - Netherlands (%)
Place of birth for the foreign-born population - Switzerland (%)
Place of birth for the foreign-born population - Other Western Europe (%)
Place of birth for the foreign-born population - Greece (%)
Place of birth for the foreign-born population - Italy (%)
Place of birth for the foreign-born population - Portugal (%)
Place of birth for the foreign-born population - Spain (%)
Place of birth for the foreign-born population - Other Southern Europe (%)
Place of birth for the foreign-born population - Albania (%)
Place of birth for the foreign-born population - Belarus (%)
Place of birth for the foreign-born population - Bosnia and Herzegovina (%)
Place of birth for the foreign-born population - Bulgaria (%)
Place of birth for the foreign-born population - Croatia (%)
Place of birth for the foreign-born population - Czechoslovakia (%)
Place of birth for the foreign-born population - Hungary (%)
Place of birth for the foreign-born population - Latvia (%)
Place of birth for the foreign-born population - Lithuania (%)
Place of birth for the foreign-born population - North Macedonia (Macedonia) (%)
Place of birth for the foreign-born population - Moldova (%)
Place of birth for the foreign-born population - Poland (%)
Place of birth for the foreign-born population - Romania (%)
Place of birth for the foreign-born population - Russia (%)
Place of birth for the foreign-born population - Serbia (%)
Place of birth for the foreign-born population - Ukraine (%)
Place of birth for the foreign-born population - Other Eastern Europe (%)
Place of birth for the foreign-born population - China (%)
Place of birth for the foreign-born population - Hong Kong (%)
Place of birth for the foreign-born population - Taiwan (%)
Place of birth for the foreign-born population - Japan (%)
Place of birth for the foreign-born population - Korea (%)
Place of birth for the foreign-born population - Other Eastern Asia (%)
Place of birth for the foreign-born population - Afghanistan (%)
Place of birth for the foreign-born population - Bangladesh (%)
Place of birth for the foreign-born population - India (%)
Place of birth for the foreign-born population - Iran (%)
Place of birth for the foreign-born population - Kazakhstan (%)
Place of birth for the foreign-born population - Nepal (%)
Place of birth for the foreign-born population - Pakistan (%)
Place of birth for the foreign-born population - Sri Lanka (%)
Place of birth for the foreign-born population - Uzbekistan (%)
Place of birth for the foreign-born population - Other South Central Asia (%)
Place of birth for the foreign-born population - Burma (%)
Place of birth for the foreign-born population - Cambodia (%)
Place of birth for the foreign-born population - Indonesia (%)
Place of birth for the foreign-born population - Laos (%)
Place of birth for the foreign-born population - Malaysia (%)
Place of birth for the foreign-born population - Philippines (%)
Place of birth for the foreign-born population - Singapore (%)
Place of birth for the foreign-born population - Thailand (%)
Place of birth for the foreign-born population - Vietnam (%)
Place of birth for the foreign-born population - Other South Eastern Asia (%)
Place of birth for the foreign-born population - Armenia (%)
Place of birth for the foreign-born population - Iraq (%)
Place of birth for the foreign-born population - Israel (%)
Place of birth for the foreign-born population - Jordan (%)
Place of birth for the foreign-born population - Kuwait (%)
Place of birth for the foreign-born population - Lebanon (%)
Place of birth for the foreign-born population - Saudi Arabia (%)
Place of birth for the foreign-born population - Syria (%)
Place of birth for the foreign-born population - Turkey (%)
Place of birth for the foreign-born population - Yemen (%)
Place of birth for the foreign-born population - Other Western Asia (%)
Place of birth for the foreign-born population - Eritrea (%)
Place of birth for the foreign-born population - Ethiopia (%)
Place of birth for the foreign-born population - Kenya (%)
Place of birth for the foreign-born population - Somalia (%)
Place of birth for the foreign-born population - Uganda (%)
Place of birth for the foreign-born population - Zimbabwe (%)
Place of birth for the foreign-born population - Other Eastern Africa (%)
Place of birth for the foreign-born population - Cameroon (%)
Place of birth for the foreign-born population - Congo (%)
Place of birth for the foreign-born population - Democratic Republic of Congo (Zaire) (%)
Place of birth for the foreign-born population - Other Middle Africa (%)
Place of birth for the foreign-born population - Egypt (%)
Place of birth for the foreign-born population - Morocco (%)
Place of birth for the foreign-born population - Sudan (%)
Place of birth for the foreign-born population - Other Northern Africa (%)
Place of birth for the foreign-born population - South Africa (%)
Place of birth for the foreign-born population - Other Southern Africa (%)
Place of birth for the foreign-born population - Cabo Verde (%)
Place of birth for the foreign-born population - Ghana (%)
Place of birth for the foreign-born population - Liberia (%)
Place of birth for the foreign-born population - Nigeria (%)
Place of birth for the foreign-born population - Senegal (%)
Place of birth for the foreign-born population - Sierra Leone (%)
Place of birth for the foreign-born population - Other Western Africa (%)
Place of birth for the foreign-born population - Australia (%)
Place of birth for the foreign-born population - New Zealand (%)
Place of birth for the foreign-born population - Fiji (%)
Place of birth for the foreign-born population - Micronesia (%)
Place of birth for the foreign-born population - Bahamas (%)
Place of birth for the foreign-born population - Barbados (%)
Place of birth for the foreign-born population - Cuba (%)
Place of birth for the foreign-born population - Dominica (%)
Place of birth for the foreign-born population - Dominican Republic (%)
Place of birth for the foreign-born population - Grenada (%)
Place of birth for the foreign-born population - Haiti (%)
Place of birth for the foreign-born population - Jamaica (%)
Place of birth for the foreign-born population - St. Vincent and the Grenadines (%)
Place of birth for the foreign-born population - Trinidad and Tobago (%)
Place of birth for the foreign-born population - West Indies (%)
Place of birth for the foreign-born population - Other Caribbean (%)
Place of birth for the foreign-born population - Belize (%)
Place of birth for the foreign-born population - Costa Rica (%)
Place of birth for the foreign-born population - El Salvador (%)
Place of birth for the foreign-born population - Guatemala (%)
Place of birth for the foreign-born population - Honduras (%)
Place of birth for the foreign-born population - Mexico (%)
Place of birth for the foreign-born population - Nicaragua (%)
Place of birth for the foreign-born population - Panama (%)
Place of birth for the foreign-born population - Other Central America (%)
Place of birth for the foreign-born population - Argentina (%)
Place of birth for the foreign-born population - Bolivia (%)
Place of birth for the foreign-born population - Brazil (%)
Place of birth for the foreign-born population - Chile (%)
Place of birth for the foreign-born population - Colombia (%)
Place of birth for the foreign-born population - Ecuador (%)
Place of birth for the foreign-born population - Guyana (%)
Place of birth for the foreign-born population - Peru (%)
Place of birth for the foreign-born population - Uruguay (%)
Place of birth for the foreign-born population - Venezuela (%)
Place of birth for the foreign-born population - Other South America (%)
Place of birth for the foreign-born population - Canada (%)
Place of birth for the foreign-born population - Other Northern America (%)
Place of birth for the foreign-born population - Other (%)
Latest news about races in Missoula, MT collected exclusively by city-data.com from local newspapers, TV, and radio stations
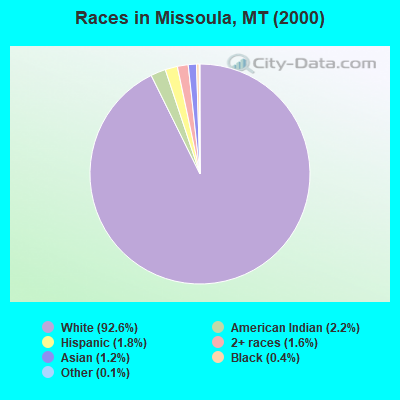
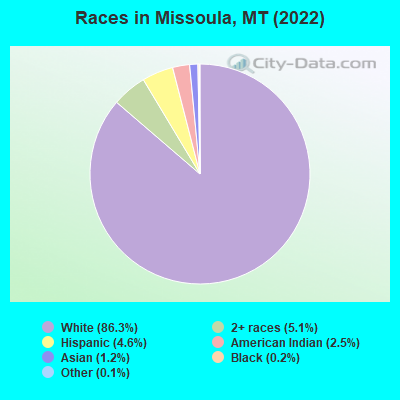
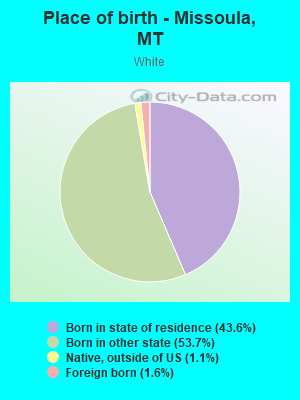
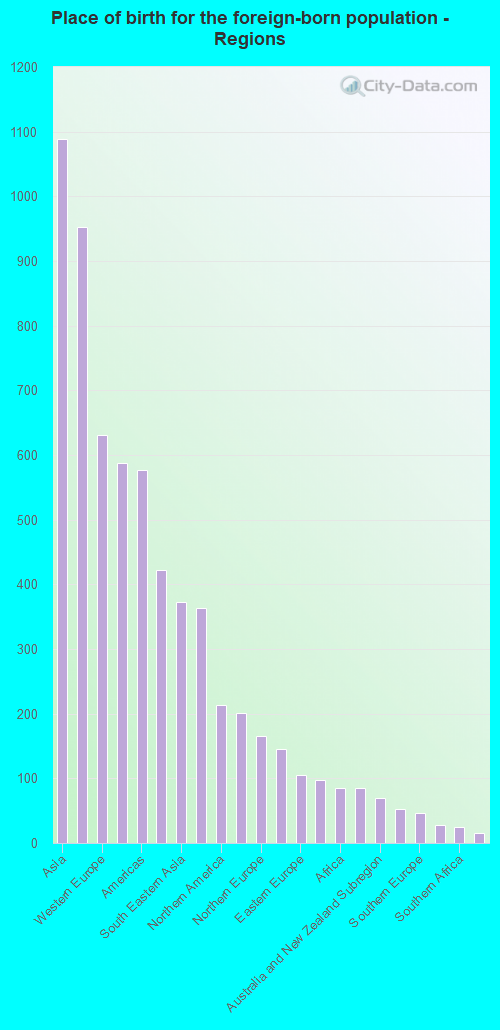
According to 2022 data, the most numerous races in Missoula, MT are White alone (66,405 residents), American Indian alone (1,898 residents), and Two or more races (3,930 residents). 94.1% of Missoula residents speak English at home. 3.7% of Missoula, MT residents are foreign-born (1.4% born in Asia, 1.3% born in Europe, 0.5% born in Latin America), which is 45.4% greater than the foreign-born rate of 2.0% across the entire state of Montana.
Race distribution in Missoula
2000 2022
807,823 89.5% White alone 54,426 6.0% American Indian alone 18,081 2.0% Hispanic 13,768 1.5% Two or more races 4,569 0.5% Asian alone 2,534 0.3% Black alone 569 0.06% Other race alone 425 0.05% Native Hawaiian and Other
937,365 83.5% White alone 58,748 5.2% American Indian alone 55,172 4.9% Two or more races 49,830 4.4% Hispanic 9,012 0.8% Other race alone 7,700 0.7% Asian alone 3,428 0.3% Black alone 1,612 0.1% Native Hawaiian and Other
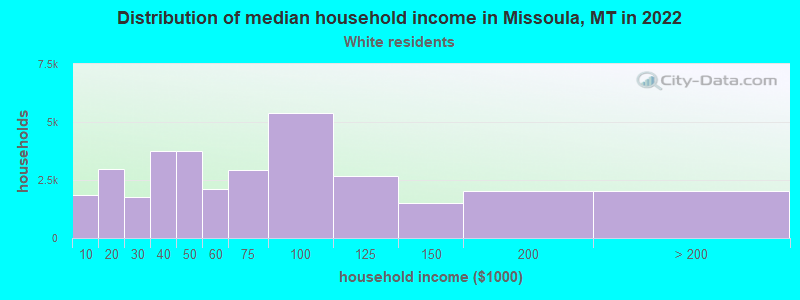
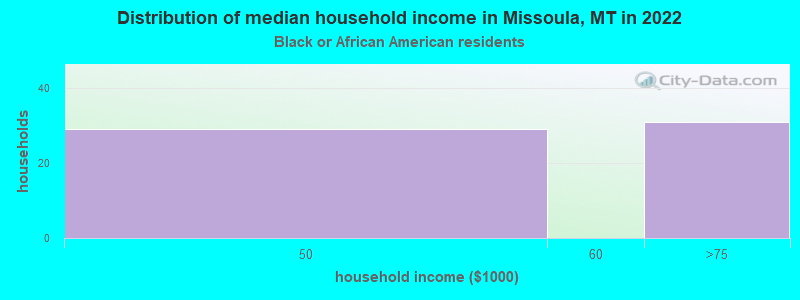
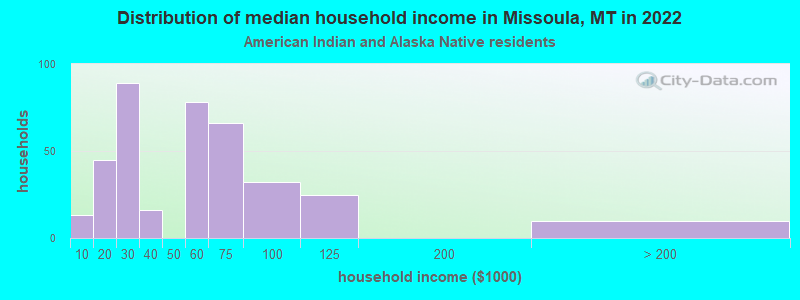
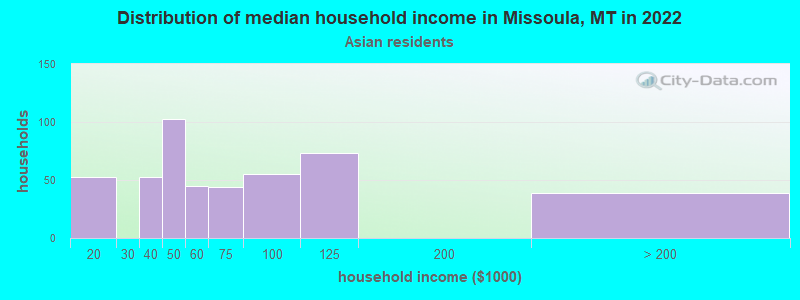
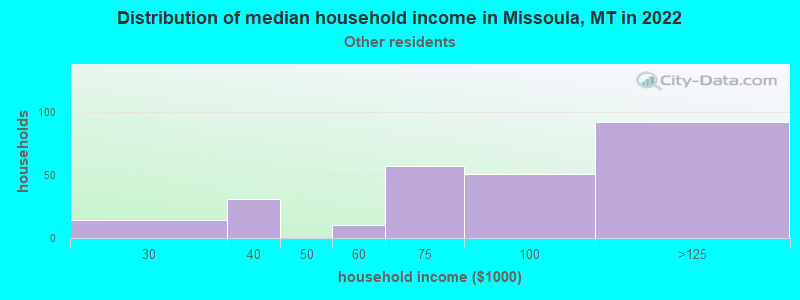
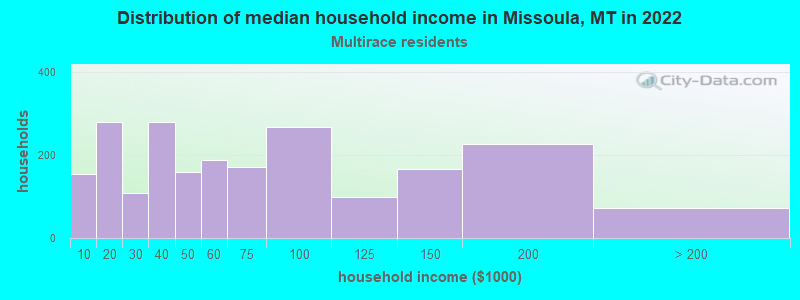
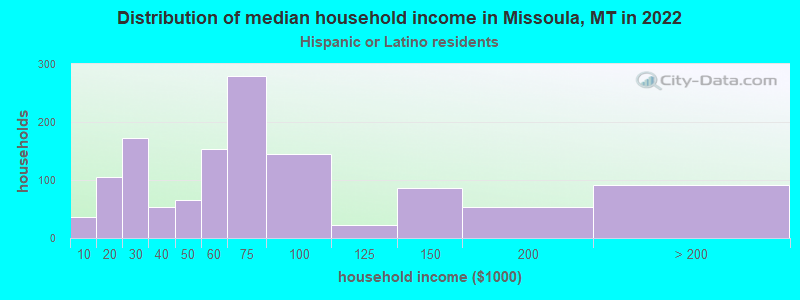
Income and house value in Missoula Median household income in 2022 $62,723 White non-Hispanic householders$58,045 American Indian and Alaska Native householders$83,101 Asian householders$48,538 Two or more races householders$54,204 Hispanic or Latino race householdersMedian 2022 house value $477,007 White Non-Hispanic householders$674,501 Black or African American householders$209,005 American Indian or Alaska Native householders $574,855 Asian householders$644,643 Some other race householders$397,146 Two or more races householders$397,506 Hispanic or Latino householders
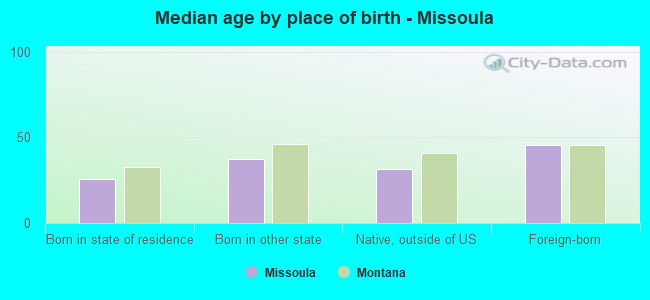
Median age by race in Missoula
34.4 Median age for White residents34.1 34.6 -666,666,666.0 Median age for Black or African American residents-666,666,666.0 -666,666,666.0 22.0 Median age for American Indian / Alaska Native residents21.9 26.0 46.7 Median age for Asian residents45.6 43.9 -666,666,666.0 Median age for Native Hawaiian / Pacific Islander residents-666,666,666.0 -666,666,666.0 20.9 Median age for Other race residents20.8 50.1 34.6 Median age for Two or more races residents33.8 35.0 34.8 Median age for White alone residents35.0 34.8 21.0 Median age for Hispanic or Latino residents20.6 22.7
Owner/renter occupied households by race in Missoula
House owners and renters - White residents 15,716 48.1% Owner occupied16,986 51.9% Renter occupiedHouse owners and renters - Black or African American residents 9 16.5% Owner occupied44 83.5% Renter occupiedHouse owners and renters - American Indian / Alaska Native residents 52 12.1% Owner occupied380 87.9% Renter occupiedHouse owners and renters - Asian residents 251 56.9% Owner occupied190 43.1% Renter occupiedHouse owners and renters - Native Hawaiian / Pacific Islander residents 20 100.0% Renter occupiedHouse owners and renters - Other race residents 139 56.5% Owner occupied107 43.5% Renter occupiedHouse owners and renters - Two or more races residents 705 33.5% Owner occupied1,397 66.5% Renter occupiedHouse owners and renters - White alone residents 15,716 48.6% Owner occupied16,635 51.4% Renter occupiedHouse owners and renters - Hispanic or Latino residents 286 32.4% Owner occupied598 67.6% Renter occupied
Language usage in Missoula
English speakers - Total 94.1% of residents of Missoula speak English at home.
1.6% of residents speak Spanish at home 1,009 86.5% Speak English very well157 13.5% Speak English less than very well4.6% of residents speak other language at home 2,109 61.9% Speak English very well1,297 38.1% Speak English less than very well
English speakers - Born in the United States 96.9% of residents of Missoula speak English at home.
1.2% of residents speak Spanish at home 406 85.7% Speak English very well68 14.3% Speak English less than very well1.5% of residents speak other language at home 481 84.4% Speak English very well89 15.6% Speak English less than very well
English speakers - Native, born elsewhere 88.5% of residents of Missoula speak English at home.
7.8% of residents speak Spanish at home 27 39.7% Speak English very well41 60.3% Speak English less than very well1.0% of residents speak other language at home 2 22.2% Speak English very well7 77.8% Speak English less than very well
English speakers - Foreign-born 38.4% of residents of Missoula speak English at home.
9.8% of residents speak Spanish at home 222 78.2% Speak English very well62 21.8% Speak English less than very well49.7% of residents speak other language at home 701 48.6% Speak English very well741 51.4% Speak English less than very well
White (Caucasian) - Speak only English Native:
97.6% (63,175)Foreign-born:
48.4% (530)
White (Caucasian) - Speak another language Native:
2.4% (1,545)Foreign-born:
51.6% (565)
Black or African American - Speak only English Native:
94.6% (431)Foreign-born:
34.8% (25)
Black or African American - Speak another language Native:
5.4% (24)Foreign-born:
65.5% (46)
American Indian / Alaska Native - Speak only English Native:
83.5% (1,077)Foreign-born:
100.0% (66)
Asian - Speak only English Native:
100.0% (230)Foreign-born:
21.6% (169)
Asian - Speak another language Native:
4.2% (10)Foreign-born:
78.9% (617)
Other race - Speak another language Native:
13.0% (130)Foreign-born:
94.9% (152)
Two or more races - Speak only English Native:
90.9% (5,173)Foreign-born:
15.6% (69)
Two or more races - Speak another language Native:
9.2% (526)Foreign-born:
87.3% (385)
White alone - Speak only English Native:
97.6% (62,121)Foreign-born:
48.4% (530)
White alone - Speak another language Native:
2.4% (1,521)Foreign-born:
51.6% (565)
Hispanic or Latino - Speak only English Native:
89.3% (2,730)Foreign-born:
3.1% (8)
Hispanic or Latino - Speak another language Native:
11.0% (338)Foreign-born:
100.0% (271)
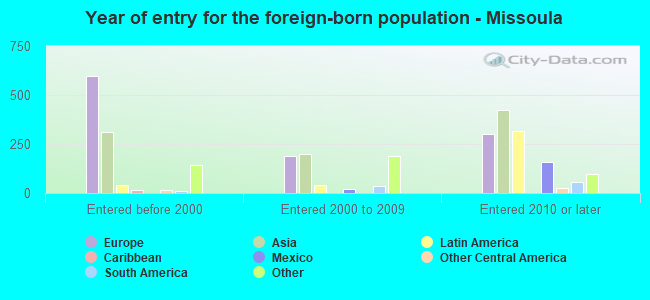
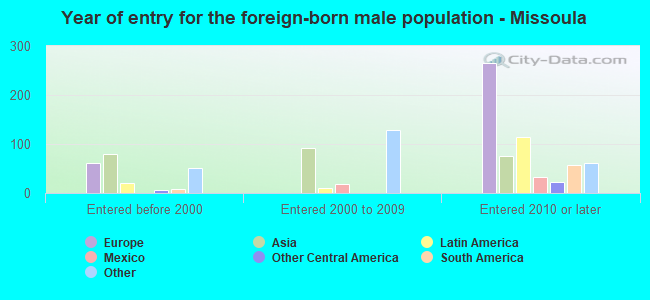
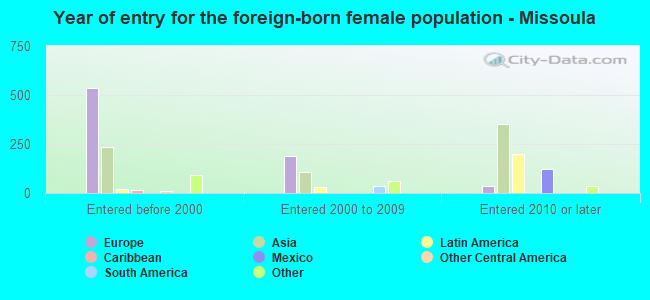
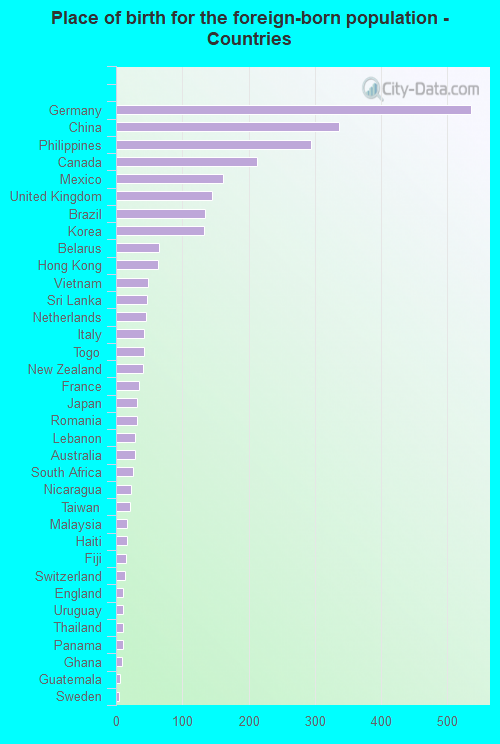
Foreign-born residents in Missoula 2,790 residents are foreign born (1.4% Asia , 1.3% Europe , 0.5% Latin America ).
This city:
3.7%Montana:
2.3%
Marital status for residents in Missoula Marital status - White (Caucasian) population 15 years and over
Males 49.5% Never married35.3% Now married0.2% Separated3.4% Widowed11.6% DivorcedFemales 45.2% Never married34.3% Now married0.6% Separated6.2% Widowed13.7% DivorcedWomen who gave birth in the past 12 months Now married:
77.5% (386)Unmarried:
22.5% (112)
Women who did not give birth in the past 12 months Now married:
26.1% (4,822)Unmarried:
73.9% (13,656)
Marital status - Black or African American population 15 years and over
Males 49.3% Never married36.2% Now married8.6% Separated0.0% Widowed5.9% DivorcedFemales 61.9% Never married38.1% Now married0.0% Separated0.0% Widowed0.0% DivorcedWomen who did not give birth in the past 12 months Now married:
37.2% (53)Unmarried:
62.8% (89)
Marital status - American Indian / Alaska Native population 15 years and over
Males 71.8% Never married11.0% Now married0.0% Separated5.5% Widowed11.7% DivorcedFemales 59.3% Never married18.6% Now married0.7% Separated0.0% Widowed21.4% DivorcedWomen who gave birth in the past 12 months Now married:
100.0% (26)Unmarried:
0.0% (0)
Women who did not give birth in the past 12 months Now married:
16.0% (55)Unmarried:
84.0% (290)
Marital status - Asian population 15 years and over
Males 58.9% Never married32.4% Now married0.0% Separated6.9% Widowed1.9% DivorcedFemales 32.2% Never married46.9% Now married0.0% Separated1.4% Widowed19.5% DivorcedWomen who gave birth in the past 12 months Now married:
100.0% (17)Unmarried:
0.0% (0)
Women who did not give birth in the past 12 months Now married:
43.7% (261)Unmarried:
56.3% (336)
Marital status - Native Hawaiian / Pacific Islander population 15 years and over
Males 78.9% Never married21.1% Now married0.0% Separated0.0% Widowed0.0% DivorcedFemales 0.0% Never married61.1% Now married0.0% Separated38.9% Widowed0.0% DivorcedWomen who did not give birth in the past 12 months Now married:
100.0% (12)Unmarried:
0.0% (0)
Marital status - Other race population 15 years and over
Males 53.5% Never married42.1% Now married0.0% Separated2.5% Widowed1.9% DivorcedFemales 19.7% Never married30.8% Now married0.0% Separated0.0% Widowed49.4% DivorcedWomen who did not give birth in the past 12 months Now married:
29.6% (130)Unmarried:
70.4% (308)
Marital status - Two or more races population 15 years and over
Males 57.3% Never married37.9% Now married0.0% Separated0.7% Widowed4.1% DivorcedFemales 45.7% Never married29.0% Now married1.3% Separated6.2% Widowed17.8% DivorcedWomen who gave birth in the past 12 months Now married:
100.0% (39)Unmarried:
0.0% (0)
Women who did not give birth in the past 12 months Now married:
31.2% (692)Unmarried:
68.8% (1,526)
Marital status - White alone, not Hispanic / Latino population 15 years and over
Males 49.1% Never married35.6% Now married0.2% Separated3.4% Widowed11.7% DivorcedFemales 44.8% Never married34.8% Now married0.6% Separated6.3% Widowed13.4% DivorcedWomen who gave birth in the past 12 months Now married:
77.5% (386)Unmarried:
22.5% (112)
Women who did not give birth in the past 12 months Now married:
26.7% (4,822)Unmarried:
73.3% (13,265)
Marital status - Hispanic or Latino population 15 years and over
Males 57.9% Never married26.8% Now married0.0% Separated0.7% Widowed14.6% DivorcedFemales 40.0% Never married33.7% Now married3.3% Separated2.3% Widowed20.6% DivorcedWomen who did not give birth in the past 12 months Now married:
34.0% (424)Unmarried:
66.0% (825)
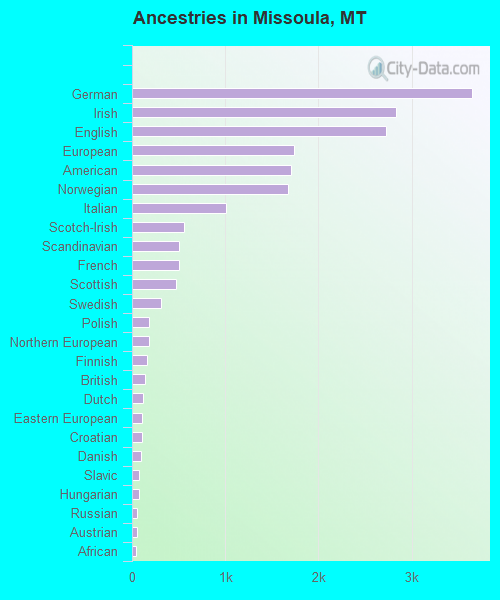
Ancestries in Missoula
3,647 15.0% German2,830 11.6% Irish2,723 11.2% English1,740 7.1% European1,710 7.0% American1,678 6.9% Norwegian1,010 4.1% Italian563 2.3% Scotch-Irish507 2.1% Scandinavian505 2.1% French472 1.9% Scottish307 1.3% Swedish177 0.7% Polish177 0.7% Northern European156 0.6% Finnish139 0.6% British117 0.5% Dutch109 0.4% Eastern European106 0.4% Croatian101 0.4% Danish80 0.3% Slavic75 0.3% Hungarian56 0.2% Russian52 0.2% Austrian46 0.2% African43 0.2% Czech43 0.2% French Canadian42 0.2% Lebanese37 0.2% Serbian33 0.1% Swiss31 0.1% Romanian24 0.10% Basque24 0.10% Ukrainian22 0.09% Welsh20 0.08% Czechoslovakian19 0.08% Slovak18 0.07% Icelander17 0.07% Greek17 0.07% Portuguese17 0.07% Haitian13 0.05% Cajun7 0.03% South African6 0.02% Iranian5 0.02% New Zealander4 0.02% Pennsylvania German3 0.01% Ethiopian
Geographical mobility in Missoula Same house 1 year ago 54,837 81.5% White (Caucasian)130 24.7% Black or African American1,047 68.6% American Indian / Alaska Native705 56.3% Asian68 71.5% Native Hawaiian / Pacific Islander975 79.5% Other race4,280 78.1% Two or more races53,889 81.5% White alone, not Hispanic / Latino2,773 78.0% Hispanic or LatinoMoved within same county 7,192 10.7% White / Caucasian107 20.4% Black or African American27 1.8% American Indian / Alaska Native130 10.4% Asian77 6.3% Other race879 16.0% Two or more races7,082 10.7% White alone, not Hispanic / Latino387 10.9% Hispanic or LatinoMoved within same state 1,438 2.1% White / Caucasian251 47.8% Black or African American146 9.6% American Indian / Alaska Native21 1.7% Asian1 1.2% Native Hawaiian / Pacific Islander50 4.0% Other race252 4.6% Two or more races1,438 2.2% White alone, not Hispanic / Latino211 5.9% Hispanic or LatinoMoved from different state 3,702 5.5% White / Caucasian15 2.8% Black or African American384 25.1% American Indian / Alaska Native279 22.3% Asian15 15.6% Native Hawaiian / Pacific Islander34 2.8% Other race72 1.3% Two or more races3,566 5.4% White alone, not Hispanic / Latino183 5.1% Hispanic or LatinoMoved from abroad 137 0.2% White3 0.7% Black or African American139 11.1% Asian8 8.7% Native Hawaiian / Pacific Islander35 2.9% Other race137 0.2% White alone, not Hispanic / Latino
Children Nativity (place of birth) in Missoula
Children under 6 years - Living with two parents Both parents native 2,678 100.0% NativeOne native, one foreign-born parent 103 100.0% NativeChildren under 6 years - Living with one parent Native parent 694 100.0% NativeForeign-born parent 57 100.0% NativeChildren 6 to 17 years - Living with two parents Both parents native 5,155 100.0% NativeBoth parents foreign-born 22 100.0% NativeOne native, one foreign-born parent 197 87.4% Native29 12.6% Foreign-bornChildren 6 to 17 years - Living with one parent Native parent 3,217 100.0% NativeForeign-born parent 69 48.8% Native73 51.2% Foreign-born
Grandparents responsible for own grandchildren in Missoula
Grandparents (30 to 59 years) White / Caucasian 25 14.4% Responsible for grandchildren150 85.6% Not responsible for grandchildrenWhite alone, not Hispanic / Latino 27 15.0% Responsible for grandchildren152 85.0% Not responsible for grandchildrenGrandparents (60 years and over) White / Caucasian 173 49.2% Responsible for grandchildren179 50.8% Not responsible for grandchildrenWhite alone, not Hispanic / Latino 173 49.2% Responsible for grandchildren179 50.8% Not responsible for grandchildren