Races in Monroe, New Hampshire (NH) Detailed Stats
Ancestries, Foreign-born residents, place of birth

Recent posts about races in Monroe, New Hampshire on our local forum with over 2,400,000 registered users:
 | Yet Another Guy Looking to Relocate to Southern NH (27 replies) |
| Let it snow (113 replies) |
| Is it hard to make friends in the White Mtn area? (18 replies) |
| Info needed - Looking at properties in these towns (18 replies) |
| Life in Littleton (44 replies) |
| Littleton NH-Relocating (27 replies) |
1.1% of Monroe, NH residents are foreign-born , which is 374.4% less than the foreign-born rate of 5.0% across the entire state of New Hampshire.
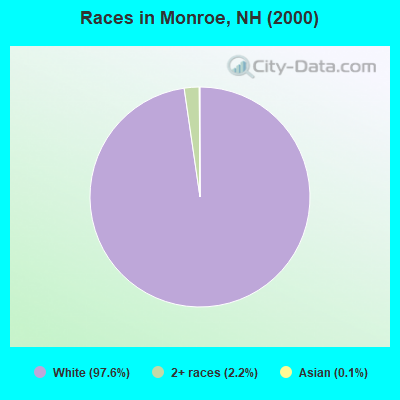
Race distribution in Monroe

- 74197.6%White alone
- 172.2%Two or more races
- 10.1%Asian alone
2000
2022
-
- 1,175,25295.1%White alone
- 20,4891.7%Hispanic
- 15,8031.3%Asian alone
- 11,6060.9%Two or more races
- 8,3540.7%Black alone
- 2,6980.2%American Indian alone
- 1,2540.1%Other race alone
- 3300.03%Native Hawaiian and Other
Pacific Islander alone

-
- 1,208,10186.6%White alone
- 63,4794.5%Hispanic
- 60,7244.4%Two or more races
- 36,5192.6%Asian alone
- 17,9311.3%Black alone
- 6,6150.5%Other race alone
- 1,0140.07%American Indian alone
- 8480.06%Native Hawaiian and Other
Pacific Islander alone

Income and house value in Monroe
- Median household income in 2022
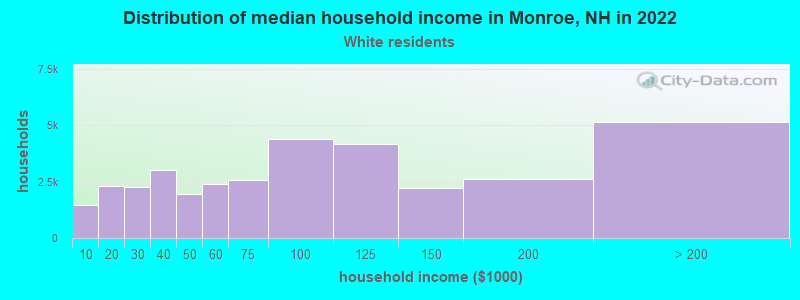
- $81,809White non-Hispanic householders
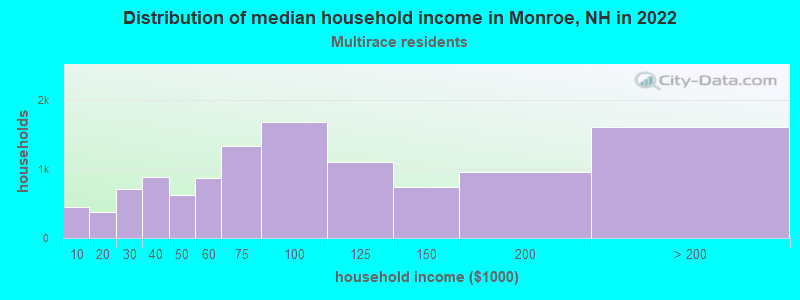
- $99,070Two or more races householders
- Median 2022 house value
- $315,467White Non-Hispanic householders
Household income for White non-Hispanic householders
Household income for Two or more races householders
Foreign-born residents in Monroe
8 residents are foreign born
| This city: | 1.1% |
| New Hampshire: | 4.4% |
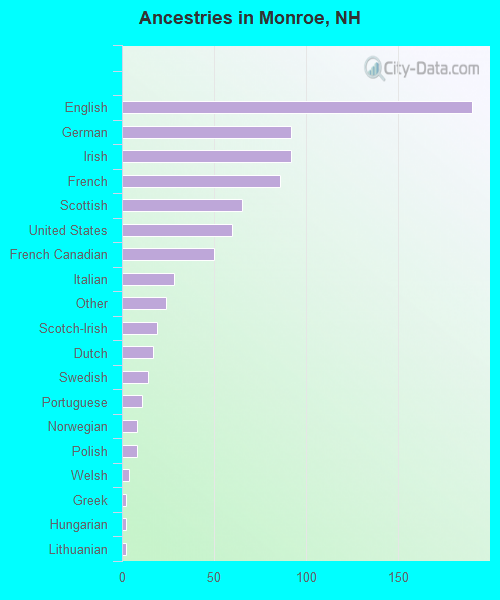
Ancestries in Monroe

- 19024.5%English
- 9211.9%German
- 9211.9%Irish
- 8611.1%French
- 658.4%Scottish
- 607.8%United States
- 506.5%French Canadian
- 283.6%Italian
- 243.1%Other
- 192.5%Scotch-Irish
- 172.2%Dutch
- 141.8%Swedish
- 111.4%Portuguese
- 81.0%Norwegian
- 81.0%Polish
- 40.5%Welsh
- 20.3%Greek
- 20.3%Hungarian
- 20.3%Lithuanian
Zip codes: 03771.