Races in Monroeville, Pennsylvania (PA) Detailed Stats
Data:
Races - White alone (%)
Races - White alone (% change since 2000)
Races - Black alone (%)
Races - Black alone (% change since 2000)
Races - American Indian alone (%)
Races - American Indian alone (% change since 2000)
Races - Asian alone (%)
Races - Asian alone (% change since 2000)
Races - Hispanic (%)
Races - Hispanic (% change since 2000)
Races - Native Hawaiian and Other Pacific Islander alone (%)
Races - Native Hawaiian and Other Pacific Islander alone (% change since 2000)
Races - Two or more races(%)
Races - Two or more races(% change since 2000)
Races - Other race alone (%)
Races - Other race alone (% change since 2000)
Racial diversity
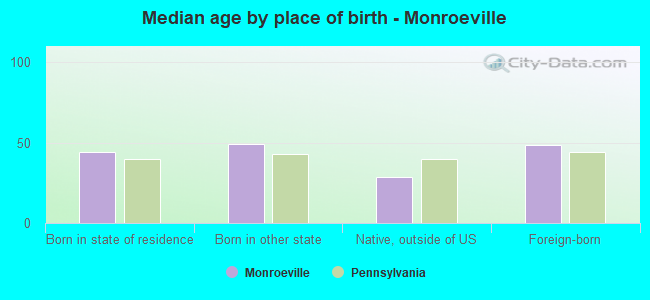
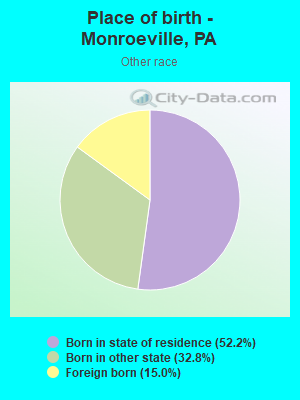
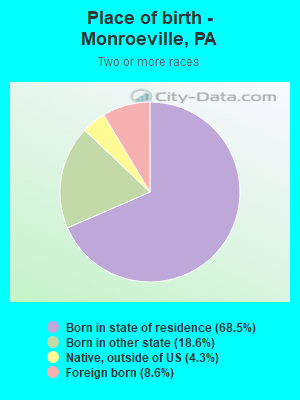
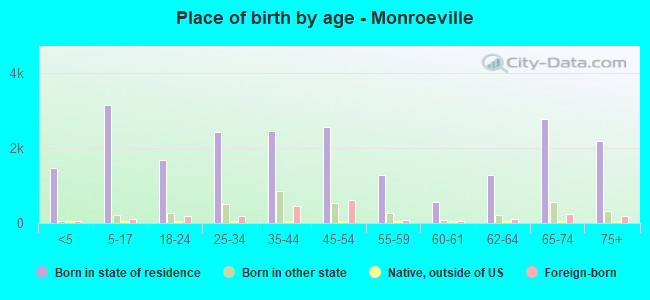
Place of birth - Born in state of residence (%)
Place of birth - Born in state of residence (%) - White
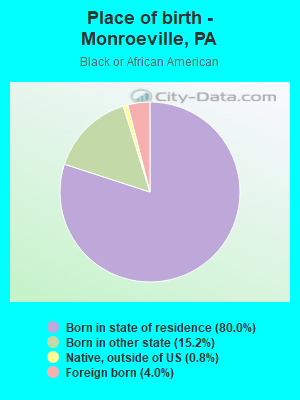
Place of birth - Born in state of residence (%) - Black or African American
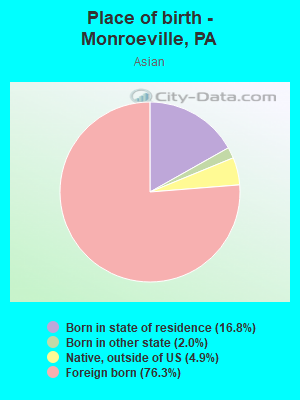
Place of birth - Born in state of residence (%) - Asian
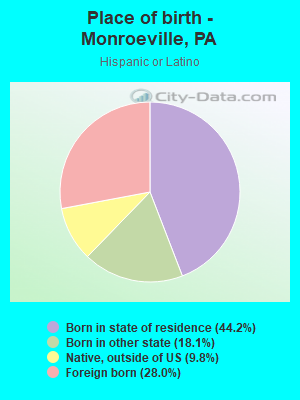
Place of birth - Born in state of residence (%) - Hispanic or Latino
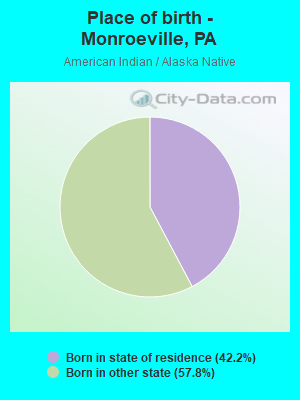
Place of birth - Born in state of residence (%) - American Indian and Alaska Native
Place of birth - Born in state of residence (%) - Multirace
Place of birth - Born in state of residence (%) - Other Race
Place of birth - Born in other state (%)
Place of birth - Born in other state (%) - White
Place of birth - Born in other state (%) - Black or African American
Place of birth - Born in other state (%) - Asian
Place of birth - Born in other state (%) - Hispanic or Latino
Place of birth - Born in other state (%) - American Indian and Alaska Native
Place of birth - Born in other state (%) - Multirace
Place of birth - Born in other state (%) - Other Race
Place of birth - Native, outside of US (%)
Place of birth - Native, outside of US (%) - White
Place of birth - Native, outside of US (%) - Black or African American
Place of birth - Native, outside of US (%) - Asian
Place of birth - Native, outside of US (%) - Hispanic or Latino
Place of birth - Native, outside of US (%) - American Indian and Alaska Native
Place of birth - Native, outside of US (%) - Multirace
Place of birth - Native, outside of US (%) - Other Race
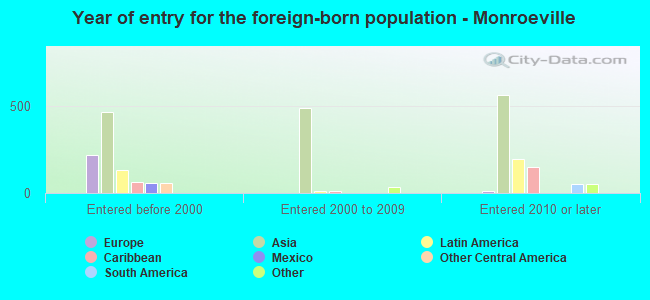
Place of birth - Foreign born (%)
Place of birth - Foreign born (%) - White
Place of birth - Foreign born (%) - Black or African American
Place of birth - Foreign born (%) - Asian
Place of birth - Foreign born (%) - Hispanic or Latino
Place of birth - Foreign born (%) - American Indian and Alaska Native
Place of birth - Foreign born (%) - Multirace
Place of birth - Foreign born (%) - Other Race
Residents speaking English at home (%)
Residents speaking English at home - Born in the United States (%)
Residents speaking English at home - Native, born elsewhere (%)
Residents speaking English at home - Foreign born (%)
Residents speaking Spanish at home (%)
Residents speaking Spanish at home - Born in the United States (%)
Residents speaking Spanish at home - Native, born elsewhere (%)
Residents speaking Spanish at home - Foreign born (%)
Residents speaking other language at home (%)
Residents speaking other language at home - Born in the United States (%)
Residents speaking other language at home - Native, born elsewhere (%)
Residents speaking other language at home - Foreign born (%)
Marital status - Never married (%)
Marital status - Now married (%)
Marital status - Separated (%)
Marital status - Widowed (%)
Marital status - Divorced (%)
Ancestries Reported - Arab (%)
Ancestries Reported - Czech (%)
Ancestries Reported - Danish (%)
Ancestries Reported - Dutch (%)
Ancestries Reported - English (%)
Ancestries Reported - French (%)
Ancestries Reported - French Canadian (%)
Ancestries Reported - German (%)
Ancestries Reported - Greek (%)
Ancestries Reported - Hungarian (%)
Ancestries Reported - Irish (%)
Ancestries Reported - Italian (%)
Ancestries Reported - Lithuanian (%)
Ancestries Reported - Norwegian (%)
Ancestries Reported - Polish (%)
Ancestries Reported - Portuguese (%)
Ancestries Reported - Russian (%)
Ancestries Reported - Scotch-Irish (%)
Ancestries Reported - Scottish (%)
Ancestries Reported - Slovak (%)
Ancestries Reported - Subsaharan African (%)
Ancestries Reported - Swedish (%)
Ancestries Reported - Swiss (%)
Ancestries Reported - Ukrainian (%)
Ancestries Reported - United States (%)
Ancestries Reported - Welsh (%)
Ancestries Reported - West Indian (%)
Ancestries Reported - Other (%)
Geographical mobility - Same house 1 year ago (%)
Geographical mobility - Same house 1 year ago (%) - White
Geographical mobility - Same house 1 year ago (%) - Black or African American
Geographical mobility - Same house 1 year ago (%) - Asian
Geographical mobility - Same house 1 year ago (%) - Hispanic or Latino
Geographical mobility - Same house 1 year ago (%) - American Indian and Alaska Native
Geographical mobility - Same house 1 year ago (%) - Multirace
Geographical mobility - Same house 1 year ago (%) - Other Race
Geographical mobility - Moved within same county (%)
Geographical mobility - Moved within same county (%) - White
Geographical mobility - Moved within same county (%) - Black or African American
Geographical mobility - Moved within same county (%) - Asian
Geographical mobility - Moved within same county (%) - Hispanic or Latino
Geographical mobility - Moved within same county (%) - American Indian and Alaska Native
Geographical mobility - Moved within same county (%) - Multirace
Geographical mobility - Moved within same county (%) - Other Race
Geographical mobility - Moved from different county within same state (%)
Geographical mobility - Moved from different county within same state (%) - White
Geographical mobility - Moved from different county within same state (%) - Black or African American
Geographical mobility - Moved from different county within same state (%) - Asian
Geographical mobility - Moved from different county within same state (%) - Hispanic or Latino
Geographical mobility - Moved from different county within same state (%) - American Indian and Alaska Native
Geographical mobility - Moved from different county within same state (%) - Multirace
Geographical mobility - Moved from different county within same state (%) - Other Race
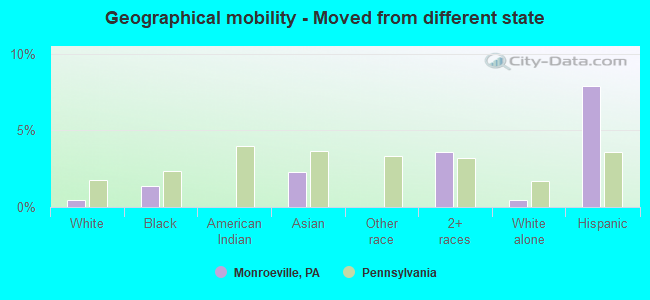
Geographical mobility - Moved from different state (%)
Geographical mobility - Moved from different state (%) - White
Geographical mobility - Moved from different state (%) - Black or African American
Geographical mobility - Moved from different state (%) - Asian
Geographical mobility - Moved from different state (%) - Hispanic or Latino
Geographical mobility - Moved from different state (%) - American Indian and Alaska Native
Geographical mobility - Moved from different state (%) - Multirace
Geographical mobility - Moved from different state (%) - Other Race
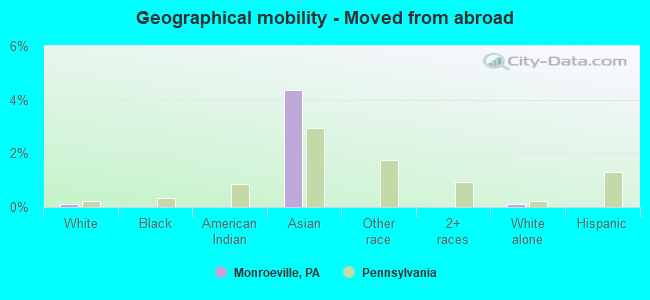
Geographical mobility - Moved from abroad (%)
Geographical mobility - Moved from abroad (%) - White
Geographical mobility - Moved from abroad (%) - Black or African American
Geographical mobility - Moved from abroad (%) - Asian
Geographical mobility - Moved from abroad (%) - Hispanic or Latino
Geographical mobility - Moved from abroad (%) - American Indian and Alaska Native
Geographical mobility - Moved from abroad (%) - Multirace
Geographical mobility - Moved from abroad (%) - Other Race
Place of birth for the foreign-born population - Ireland (%)
Place of birth for the foreign-born population - Denmark (%)
Place of birth for the foreign-born population - Norway (%)
Place of birth for the foreign-born population - Sweden (%)
Place of birth for the foreign-born population - United Kingdom (%)
Place of birth for the foreign-born population - England (%)
Place of birth for the foreign-born population - Scotland (%)
Place of birth for the foreign-born population - Other Northern Europe (%)
Place of birth for the foreign-born population - Austria (%)
Place of birth for the foreign-born population - Belgium (%)
Place of birth for the foreign-born population - France (%)
Place of birth for the foreign-born population - Germany (%)
Place of birth for the foreign-born population - Netherlands (%)
Place of birth for the foreign-born population - Switzerland (%)
Place of birth for the foreign-born population - Other Western Europe (%)
Place of birth for the foreign-born population - Greece (%)
Place of birth for the foreign-born population - Italy (%)
Place of birth for the foreign-born population - Portugal (%)
Place of birth for the foreign-born population - Spain (%)
Place of birth for the foreign-born population - Other Southern Europe (%)
Place of birth for the foreign-born population - Albania (%)
Place of birth for the foreign-born population - Belarus (%)
Place of birth for the foreign-born population - Bosnia and Herzegovina (%)
Place of birth for the foreign-born population - Bulgaria (%)
Place of birth for the foreign-born population - Croatia (%)
Place of birth for the foreign-born population - Czechoslovakia (%)
Place of birth for the foreign-born population - Hungary (%)
Place of birth for the foreign-born population - Latvia (%)
Place of birth for the foreign-born population - Lithuania (%)
Place of birth for the foreign-born population - North Macedonia (Macedonia) (%)
Place of birth for the foreign-born population - Moldova (%)
Place of birth for the foreign-born population - Poland (%)
Place of birth for the foreign-born population - Romania (%)
Place of birth for the foreign-born population - Russia (%)
Place of birth for the foreign-born population - Serbia (%)
Place of birth for the foreign-born population - Ukraine (%)
Place of birth for the foreign-born population - Other Eastern Europe (%)
Place of birth for the foreign-born population - China (%)
Place of birth for the foreign-born population - Hong Kong (%)
Place of birth for the foreign-born population - Taiwan (%)
Place of birth for the foreign-born population - Japan (%)
Place of birth for the foreign-born population - Korea (%)
Place of birth for the foreign-born population - Other Eastern Asia (%)
Place of birth for the foreign-born population - Afghanistan (%)
Place of birth for the foreign-born population - Bangladesh (%)
Place of birth for the foreign-born population - India (%)
Place of birth for the foreign-born population - Iran (%)
Place of birth for the foreign-born population - Kazakhstan (%)
Place of birth for the foreign-born population - Nepal (%)
Place of birth for the foreign-born population - Pakistan (%)
Place of birth for the foreign-born population - Sri Lanka (%)
Place of birth for the foreign-born population - Uzbekistan (%)
Place of birth for the foreign-born population - Other South Central Asia (%)
Place of birth for the foreign-born population - Burma (%)
Place of birth for the foreign-born population - Cambodia (%)
Place of birth for the foreign-born population - Indonesia (%)
Place of birth for the foreign-born population - Laos (%)
Place of birth for the foreign-born population - Malaysia (%)
Place of birth for the foreign-born population - Philippines (%)
Place of birth for the foreign-born population - Singapore (%)
Place of birth for the foreign-born population - Thailand (%)
Place of birth for the foreign-born population - Vietnam (%)
Place of birth for the foreign-born population - Other South Eastern Asia (%)
Place of birth for the foreign-born population - Armenia (%)
Place of birth for the foreign-born population - Iraq (%)
Place of birth for the foreign-born population - Israel (%)
Place of birth for the foreign-born population - Jordan (%)
Place of birth for the foreign-born population - Kuwait (%)
Place of birth for the foreign-born population - Lebanon (%)
Place of birth for the foreign-born population - Saudi Arabia (%)
Place of birth for the foreign-born population - Syria (%)
Place of birth for the foreign-born population - Turkey (%)
Place of birth for the foreign-born population - Yemen (%)
Place of birth for the foreign-born population - Other Western Asia (%)
Place of birth for the foreign-born population - Eritrea (%)
Place of birth for the foreign-born population - Ethiopia (%)
Place of birth for the foreign-born population - Kenya (%)
Place of birth for the foreign-born population - Somalia (%)
Place of birth for the foreign-born population - Uganda (%)
Place of birth for the foreign-born population - Zimbabwe (%)
Place of birth for the foreign-born population - Other Eastern Africa (%)
Place of birth for the foreign-born population - Cameroon (%)
Place of birth for the foreign-born population - Congo (%)
Place of birth for the foreign-born population - Democratic Republic of Congo (Zaire) (%)
Place of birth for the foreign-born population - Other Middle Africa (%)
Place of birth for the foreign-born population - Egypt (%)
Place of birth for the foreign-born population - Morocco (%)
Place of birth for the foreign-born population - Sudan (%)
Place of birth for the foreign-born population - Other Northern Africa (%)
Place of birth for the foreign-born population - South Africa (%)
Place of birth for the foreign-born population - Other Southern Africa (%)
Place of birth for the foreign-born population - Cabo Verde (%)
Place of birth for the foreign-born population - Ghana (%)
Place of birth for the foreign-born population - Liberia (%)
Place of birth for the foreign-born population - Nigeria (%)
Place of birth for the foreign-born population - Senegal (%)
Place of birth for the foreign-born population - Sierra Leone (%)
Place of birth for the foreign-born population - Other Western Africa (%)
Place of birth for the foreign-born population - Australia (%)
Place of birth for the foreign-born population - New Zealand (%)
Place of birth for the foreign-born population - Fiji (%)
Place of birth for the foreign-born population - Micronesia (%)
Place of birth for the foreign-born population - Bahamas (%)
Place of birth for the foreign-born population - Barbados (%)
Place of birth for the foreign-born population - Cuba (%)
Place of birth for the foreign-born population - Dominica (%)
Place of birth for the foreign-born population - Dominican Republic (%)
Place of birth for the foreign-born population - Grenada (%)
Place of birth for the foreign-born population - Haiti (%)
Place of birth for the foreign-born population - Jamaica (%)
Place of birth for the foreign-born population - St. Vincent and the Grenadines (%)
Place of birth for the foreign-born population - Trinidad and Tobago (%)
Place of birth for the foreign-born population - West Indies (%)
Place of birth for the foreign-born population - Other Caribbean (%)
Place of birth for the foreign-born population - Belize (%)
Place of birth for the foreign-born population - Costa Rica (%)
Place of birth for the foreign-born population - El Salvador (%)
Place of birth for the foreign-born population - Guatemala (%)
Place of birth for the foreign-born population - Honduras (%)
Place of birth for the foreign-born population - Mexico (%)
Place of birth for the foreign-born population - Nicaragua (%)
Place of birth for the foreign-born population - Panama (%)
Place of birth for the foreign-born population - Other Central America (%)
Place of birth for the foreign-born population - Argentina (%)
Place of birth for the foreign-born population - Bolivia (%)
Place of birth for the foreign-born population - Brazil (%)
Place of birth for the foreign-born population - Chile (%)
Place of birth for the foreign-born population - Colombia (%)
Place of birth for the foreign-born population - Ecuador (%)
Place of birth for the foreign-born population - Guyana (%)
Place of birth for the foreign-born population - Peru (%)
Place of birth for the foreign-born population - Uruguay (%)
Place of birth for the foreign-born population - Venezuela (%)
Place of birth for the foreign-born population - Other South America (%)
Place of birth for the foreign-born population - Canada (%)
Place of birth for the foreign-born population - Other Northern America (%)
Place of birth for the foreign-born population - Other (%)
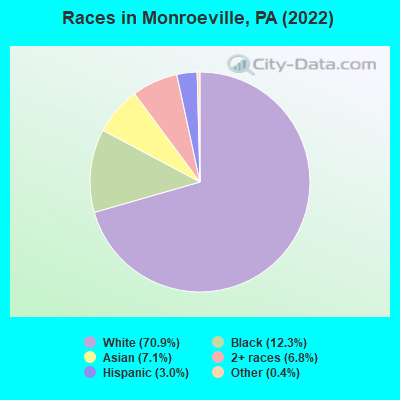
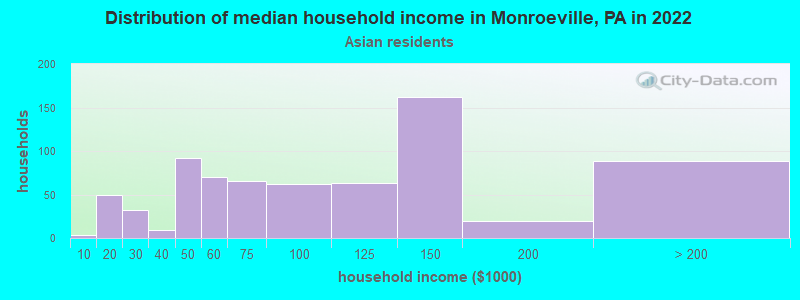
According to 2022 data, the most numerous races in Monroeville, PA are White alone (20,029 residents), Black alone (3,461 residents), and Hispanic (856 residents). 89.7% of Monroeville residents speak English at home.
Race distribution in Monroeville 20,029 70.9% White alone 3,461 12.3% Black alone 1,997 7.1% Asian alone 1,927 6.8% Two or more races 856 3.0% Hispanic 120 0.4% Other race alone 27 0.10% American Indian alone
2000 2022
10,322,455 84.1% White alone 1,202,437 9.8% Black alone 394,088 3.2% Hispanic 218,296 1.8% Asian alone 113,097 0.9% Two or more races 13,086 0.1% Other race alone 14,904 0.1% American Indian alone 2,691 0.02% Native Hawaiian and Other
9,487,228 73.1% White alone 1,311,581 10.1% Black alone 1,115,997 8.6% Hispanic 493,942 3.8% Two or more races 487,124 3.8% Asian alone 63,582 0.5% Other race alone 10,130 0.08% American Indian alone 2,424 0.02% Native Hawaiian and Other
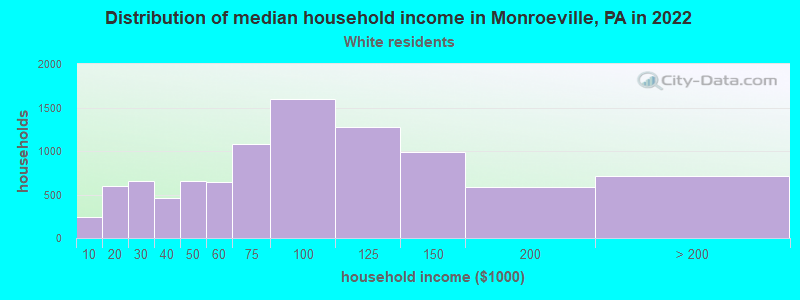
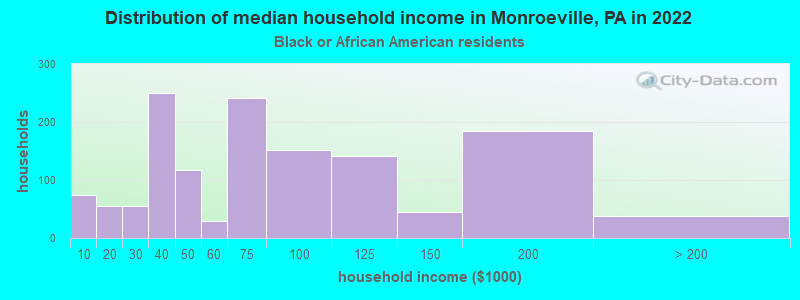
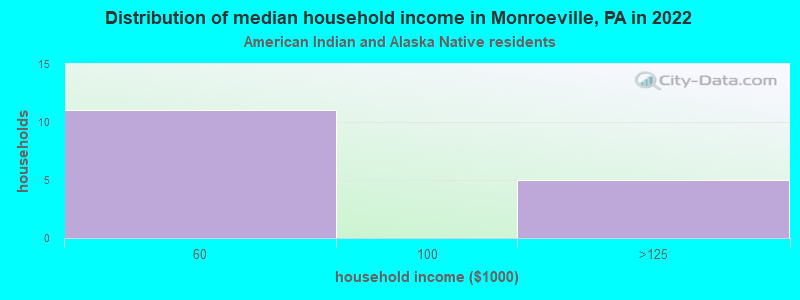
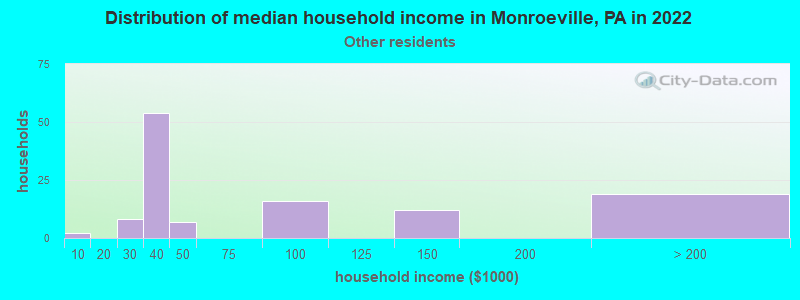
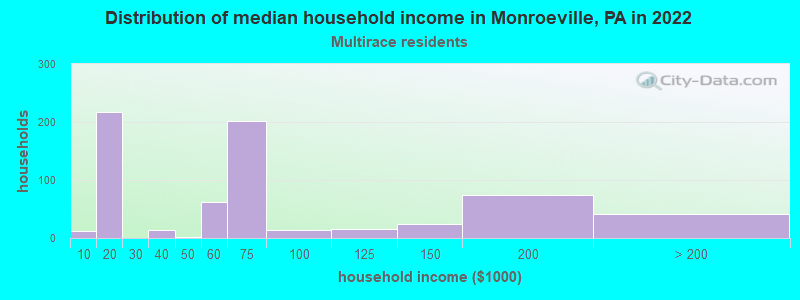
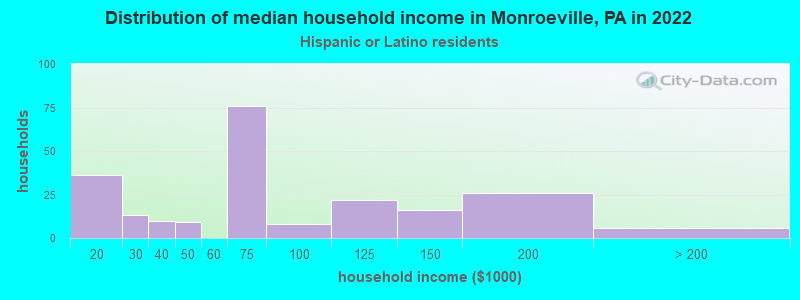
Income and house value in Monroeville Median household income in 2022 $80,967 White non-Hispanic householders$64,497 Black householders$114,382 Asian householders$60,740 Two or more races householders$61,708 Hispanic or Latino race householders
Median age by race in Monroeville
49.5 Median age for White residents49.2 50.3 38.4 Median age for Black or African American residents38.5 39.1 77.4 Median age for American Indian / Alaska Native residents-714,583,332.6 -577,519,379.3 42.2 Median age for Asian residents41.7 45.2 -656,534,953.8 Median age for Native Hawaiian / Pacific Islander residents-919,148,935.3 -747,474,746.7 33.5 Median age for Other race residents24.4 41.6 26.2 Median age for Two or more races residents28.1 19.0 49.6 Median age for White alone residents49.1 50.2 18.5 Median age for Hispanic or Latino residents24.9 15.1
Owner/renter occupied households by race in Monroeville
House owners and renters - White residents 7,080 74.7% Owner occupied2,403 25.3% Renter occupiedHouse owners and renters - Black or African American residents 717 53.5% Owner occupied623 46.5% Renter occupiedHouse owners and renters - American Indian / Alaska Native residents 13 100.0% Owner occupiedHouse owners and renters - Asian residents 592 78.1% Owner occupied166 21.9% Renter occupiedHouse owners and renters - Other race residents 57 65.5% Owner occupied30 34.5% Renter occupiedHouse owners and renters - Two or more races residents 287 47.4% Owner occupied319 52.6% Renter occupiedHouse owners and renters - White alone residents 7,065 74.7% Owner occupied2,393 25.3% Renter occupiedHouse owners and renters - Hispanic or Latino residents 89 47.0% Owner occupied100 53.0% Renter occupied
Language usage in Monroeville
English speakers - Total 89.7% of residents of Monroeville speak English at home.
2.0% of residents speak Spanish at home 450 86.2% Speak English very well72 13.8% Speak English less than very well8.4% of residents speak other language at home 1,537 68.2% Speak English very well717 31.8% Speak English less than very well
English speakers - Born in the United States 94.4% of residents of Monroeville speak English at home.
1.6% of residents speak Spanish at home 42 70.0% Speak English very well18 30.0% Speak English less than very well3.2% of residents speak other language at home 121 100.0% Speak English very well
English speakers - Native, born elsewhere 43.3% of residents of Monroeville speak English at home.
33.8% of residents speak Spanish at home 103 100.0% Speak English very well31.8% of residents speak other language at home 97 100.0% Speak English very well
English speakers - Foreign-born 15.3% of residents of Monroeville speak English at home.
9.4% of residents speak Spanish at home 162 81.0% Speak English very well38 19.0% Speak English less than very well75.0% of residents speak other language at home 971 61.1% Speak English very well619 38.9% Speak English less than very well
White (Caucasian) - Speak only English Native:
98.0% (18,376)Foreign-born:
23.6% (71)
White (Caucasian) - Speak another language Native:
2.0% (374)Foreign-born:
75.4% (226)
Black or African American - Speak only English Native:
99.1% (3,131)Foreign-born:
75.1% (106)
Black or African American - Speak another language Native:
0.8% (27)Foreign-born:
33.9% (48)
Asian - Speak only English Native:
44.6% (192)Foreign-born:
8.4% (123)
Asian - Speak another language Native:
45.2% (195)Foreign-born:
91.6% (1,344)
Other race - Speak another language Native:
19.3% (43)Foreign-born:
100.0% (37)
Two or more races - Speak only English Native:
85.4% (1,918)Foreign-born:
16.9% (40)
Two or more races - Speak another language Native:
15.6% (351)Foreign-born:
83.4% (196)
White alone - Speak only English Native:
97.9% (18,341)Foreign-born:
21.1% (63)
White alone - Speak another language Native:
2.1% (386)Foreign-born:
79.0% (237)
Hispanic or Latino - Speak only English Native:
58.9% (282)Foreign-born:
20.4% (50)
Hispanic or Latino - Speak another language Native:
42.3% (202)Foreign-born:
75.3% (185)
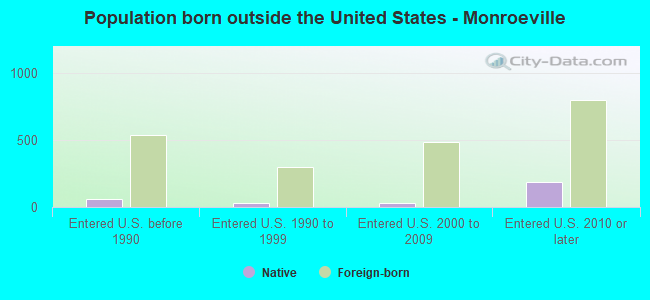
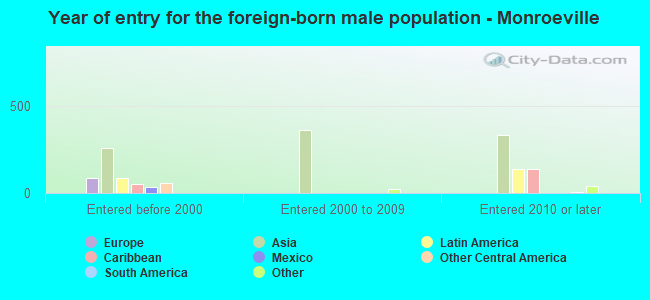
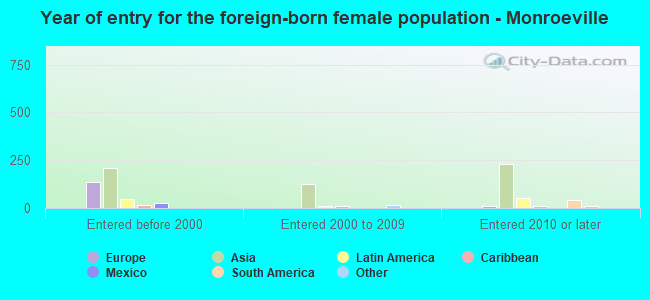
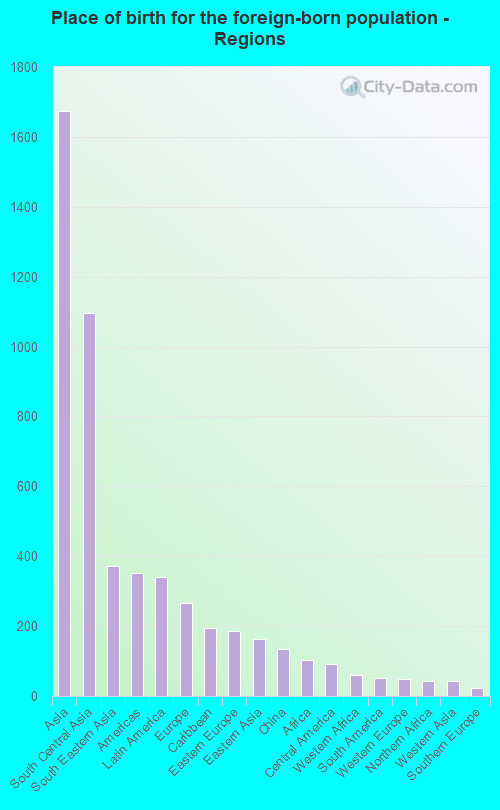
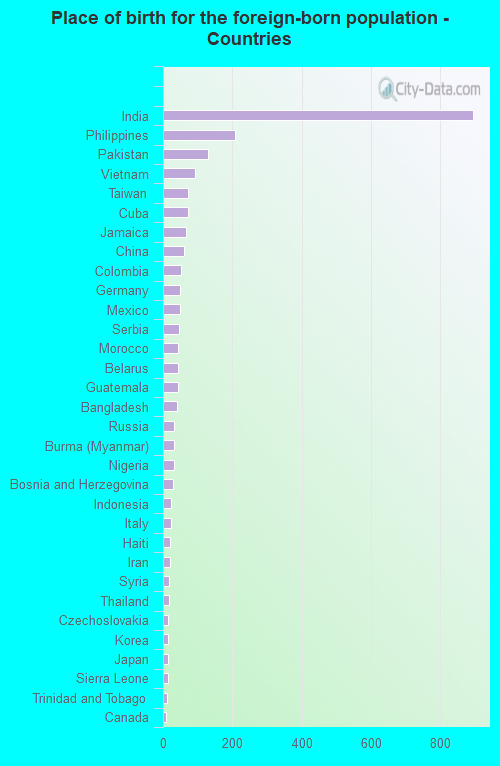
Foreign-born residents in Monroeville
Marital status for residents in Monroeville Marital status - White (Caucasian) population 15 years and over
Males 28.9% Never married56.9% Now married1.3% Separated4.1% Widowed8.9% DivorcedFemales 22.1% Never married51.6% Now married2.6% Separated12.0% Widowed11.6% DivorcedWomen who gave birth in the past 12 months Now married:
91.8% (208)Unmarried:
8.2% (18)
Women who did not give birth in the past 12 months Now married:
49.2% (1,931)Unmarried:
50.8% (1,997)
Marital status - Black or African American population 15 years and over
Males 51.9% Never married39.0% Now married0.0% Separated1.2% Widowed7.9% DivorcedFemales 39.4% Never married34.8% Now married0.4% Separated9.0% Widowed16.3% DivorcedWomen who gave birth in the past 12 months Now married:
0.0% (0)Unmarried:
100.0% (25)
Women who did not give birth in the past 12 months Now married:
29.6% (297)Unmarried:
70.4% (707)
Marital status - American Indian / Alaska Native population 15 years and over
Males 20.0% Never married0.0% Now married0.0% Separated80.0% Widowed0.0% DivorcedFemales 0.0% Never married33.3% Now married0.0% Separated66.7% Widowed0.0% DivorcedMarital status - Asian population 15 years and over
Males 38.0% Never married55.4% Now married0.0% Separated3.5% Widowed3.1% DivorcedFemales 11.3% Never married70.9% Now married0.0% Separated10.1% Widowed7.8% DivorcedWomen who gave birth in the past 12 months Now married:
100.0% (12)Unmarried:
0.0% (0)
Women who did not give birth in the past 12 months Now married:
83.0% (346)Unmarried:
17.0% (71)
Marital status - Other race population 15 years and over
Males 50.0% Never married50.0% Now married0.0% Separated0.0% Widowed0.0% DivorcedFemales 30.3% Never married36.8% Now married0.0% Separated0.0% Widowed32.9% DivorcedWomen who did not give birth in the past 12 months Now married:
44.7% (21)Unmarried:
55.3% (26)
Marital status - Two or more races population 15 years and over
Males 43.1% Never married45.1% Now married1.2% Separated1.9% Widowed8.7% DivorcedFemales 45.9% Never married43.5% Now married1.6% Separated0.0% Widowed9.0% DivorcedWomen who gave birth in the past 12 months Now married:
100.0% (14)Unmarried:
0.0% (0)
Women who did not give birth in the past 12 months Now married:
47.0% (312)Unmarried:
53.0% (351)
Marital status - White alone, not Hispanic / Latino population 15 years and over
Males 28.8% Never married56.8% Now married1.3% Separated4.1% Widowed8.9% DivorcedFemales 22.1% Never married51.6% Now married2.7% Separated12.1% Widowed11.6% DivorcedWomen who gave birth in the past 12 months Now married:
91.8% (209)Unmarried:
8.2% (19)
Women who did not give birth in the past 12 months Now married:
49.3% (1,930)Unmarried:
50.7% (1,985)
Marital status - Hispanic or Latino population 15 years and over
Males 31.8% Never married68.2% Now married0.0% Separated0.0% Widowed0.0% DivorcedFemales 43.7% Never married41.5% Now married0.0% Separated0.0% Widowed14.8% DivorcedWomen who did not give birth in the past 12 months Now married:
34.1% (33)Unmarried:
65.9% (64)
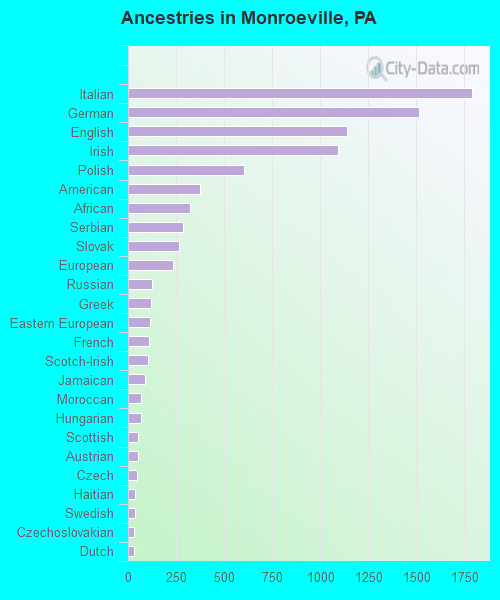
Ancestries in Monroeville
1,789 12.9% Italian1,514 10.9% German1,141 8.2% English1,091 7.9% Irish603 4.4% Polish375 2.7% American322 2.3% African285 2.1% Serbian266 1.9% Slovak233 1.7% European124 0.9% Russian118 0.9% Greek115 0.8% Eastern European108 0.8% French106 0.8% Scotch-Irish89 0.6% Jamaican68 0.5% Moroccan67 0.5% Hungarian52 0.4% Scottish51 0.4% Austrian45 0.3% Czech39 0.3% Haitian34 0.2% Swedish30 0.2% Czechoslovakian29 0.2% Dutch25 0.2% Iranian23 0.2% Pennsylvania German23 0.2% Swiss23 0.2% Welsh18 0.1% Arab18 0.1% Ukrainian18 0.1% Yugoslavian13 0.09% Lithuanian13 0.09% French Canadian13 0.09% Nigerian11 0.08% Norwegian9 0.06% Lebanese9 0.06% Syrian8 0.06% Northern European6 0.04% British6 0.04% Sierra Leonean4 0.03% Slavic
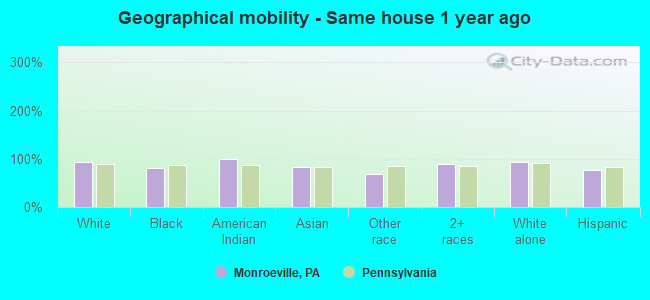
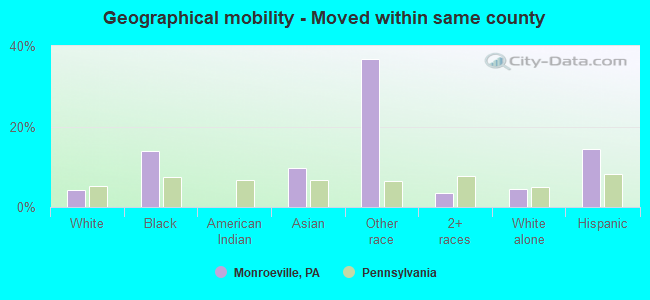
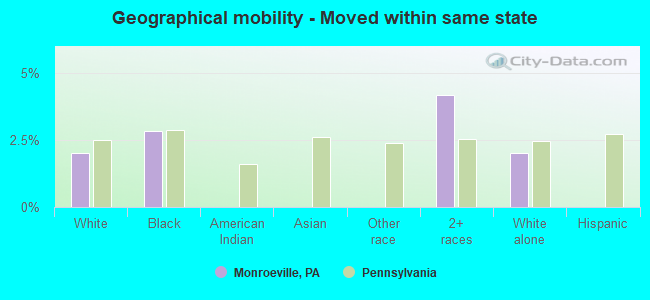
Geographical mobility in Monroeville Same house 1 year ago 18,486 93.4% White (Caucasian)2,815 80.8% Black or African American37 99.6% American Indian / Alaska Native1,681 83.8% Asian168 67.9% Other race2,438 89.9% Two or more races18,477 93.4% White alone, not Hispanic / Latino653 76.3% Hispanic or LatinoMoved within same county 855 4.3% White / Caucasian483 13.9% Black or African American197 9.8% Asian91 36.8% Other race94 3.5% Two or more races860 4.3% White alone, not Hispanic / Latino123 14.3% Hispanic or LatinoMoved within same state 399 2.0% White / Caucasian98 2.8% Black or African American113 4.2% Two or more races401 2.0% White alone, not Hispanic / LatinoMoved from different state 91 0.5% White / Caucasian47 1.3% Black or African American46 2.3% Asian98 3.6% Two or more races92 0.5% White alone, not Hispanic / Latino68 7.9% Hispanic or LatinoMoved from abroad 22 0.1% White88 4.4% Asian19 0.1% White alone, not Hispanic / Latino
Children Nativity (place of birth) in Monroeville
Children under 6 years - Living with two parents Both parents native 1,306 100.0% Native0 0.0% Foreign-bornBoth parents foreign-born 67 86.2% Native11 13.8% Foreign-bornOne native, one foreign-born parent 71 100.0% NativeChildren under 6 years - Living with one parent Native parent 294 100.0% NativeForeign-born parent 33 100.0% Foreign-bornChildren 6 to 17 years - Living with two parents Both parents native 1,629 99.9% Native1 0.1% Foreign-bornBoth parents foreign-born 246 84.4% Native46 15.6% Foreign-bornOne native, one foreign-born parent 106 100.0% NativeChildren 6 to 17 years - Living with one parent Native parent 989 98.3% Native17 1.7% Foreign-bornForeign-born parent 41 74.1% Native14 25.9% Foreign-born
Grandparents responsible for own grandchildren in Monroeville
Grandparents (30 to 59 years) White / Caucasian 21 18.2% Responsible for grandchildren94 81.8% Not responsible for grandchildrenAmerican Indian / Alaska Native 4 100.0% Responsible for grandchildrenWhite alone, not Hispanic / Latino 21 18.3% Responsible for grandchildren95 81.7% Not responsible for grandchildrenGrandparents (60 years and over) White / Caucasian 18 11.6% Responsible for grandchildren134 88.4% Not responsible for grandchildrenWhite alone, not Hispanic / Latino 18 11.5% Responsible for grandchildren136 88.5% Not responsible for grandchildren