Races in Monsey, New York (NY) Detailed Stats
Data:
Races - White alone (%)
Races - White alone (% change since 2000)
Races - Black alone (%)
Races - Black alone (% change since 2000)
Races - American Indian alone (%)
Races - American Indian alone (% change since 2000)
Races - Asian alone (%)
Races - Asian alone (% change since 2000)
Races - Hispanic (%)
Races - Hispanic (% change since 2000)
Races - Native Hawaiian and Other Pacific Islander alone (%)
Races - Native Hawaiian and Other Pacific Islander alone (% change since 2000)
Races - Two or more races(%)
Races - Two or more races(% change since 2000)
Races - Other race alone (%)
Races - Other race alone (% change since 2000)
Racial diversity
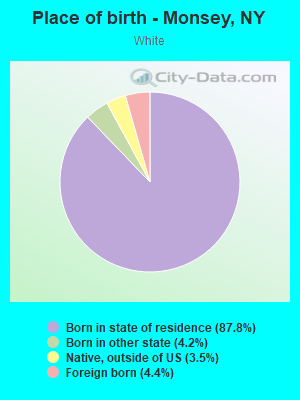
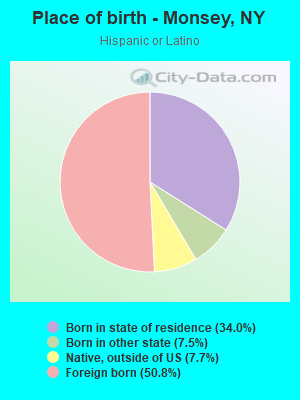
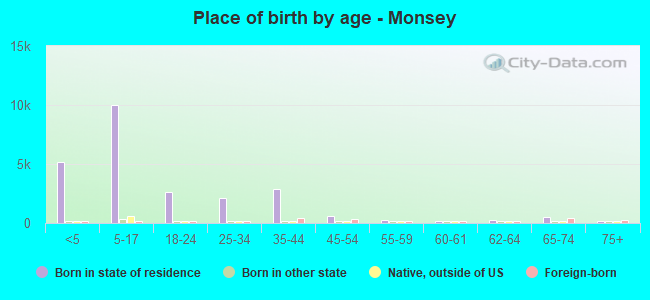
Place of birth - Born in state of residence (%)
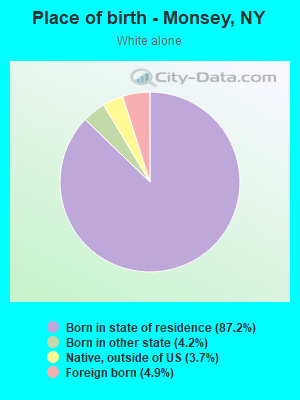
Place of birth - Born in state of residence (%) - White
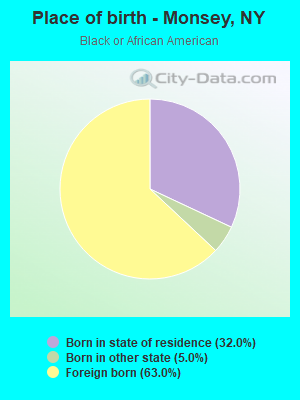
Place of birth - Born in state of residence (%) - Black or African American
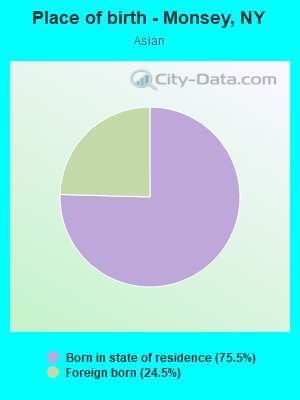
Place of birth - Born in state of residence (%) - Asian
Place of birth - Born in state of residence (%) - Hispanic or Latino
Place of birth - Born in state of residence (%) - American Indian and Alaska Native
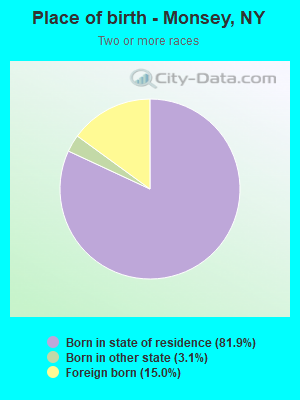
Place of birth - Born in state of residence (%) - Multirace
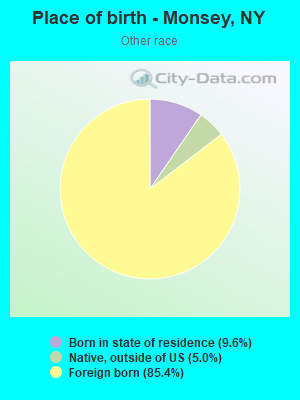
Place of birth - Born in state of residence (%) - Other Race
Place of birth - Born in other state (%)
Place of birth - Born in other state (%) - White
Place of birth - Born in other state (%) - Black or African American
Place of birth - Born in other state (%) - Asian
Place of birth - Born in other state (%) - Hispanic or Latino
Place of birth - Born in other state (%) - American Indian and Alaska Native
Place of birth - Born in other state (%) - Multirace
Place of birth - Born in other state (%) - Other Race
Place of birth - Native, outside of US (%)
Place of birth - Native, outside of US (%) - White
Place of birth - Native, outside of US (%) - Black or African American
Place of birth - Native, outside of US (%) - Asian
Place of birth - Native, outside of US (%) - Hispanic or Latino
Place of birth - Native, outside of US (%) - American Indian and Alaska Native
Place of birth - Native, outside of US (%) - Multirace
Place of birth - Native, outside of US (%) - Other Race
Place of birth - Foreign born (%)
Place of birth - Foreign born (%) - White
Place of birth - Foreign born (%) - Black or African American
Place of birth - Foreign born (%) - Asian
Place of birth - Foreign born (%) - Hispanic or Latino
Place of birth - Foreign born (%) - American Indian and Alaska Native
Place of birth - Foreign born (%) - Multirace
Place of birth - Foreign born (%) - Other Race
Residents speaking English at home (%)
Residents speaking English at home - Born in the United States (%)
Residents speaking English at home - Native, born elsewhere (%)
Residents speaking English at home - Foreign born (%)
Residents speaking Spanish at home (%)
Residents speaking Spanish at home - Born in the United States (%)
Residents speaking Spanish at home - Native, born elsewhere (%)
Residents speaking Spanish at home - Foreign born (%)
Residents speaking other language at home (%)
Residents speaking other language at home - Born in the United States (%)
Residents speaking other language at home - Native, born elsewhere (%)
Residents speaking other language at home - Foreign born (%)
Marital status - Never married (%)
Marital status - Now married (%)
Marital status - Separated (%)
Marital status - Widowed (%)
Marital status - Divorced (%)
Ancestries Reported - Arab (%)
Ancestries Reported - Czech (%)
Ancestries Reported - Danish (%)
Ancestries Reported - Dutch (%)
Ancestries Reported - English (%)
Ancestries Reported - French (%)
Ancestries Reported - French Canadian (%)
Ancestries Reported - German (%)
Ancestries Reported - Greek (%)
Ancestries Reported - Hungarian (%)
Ancestries Reported - Irish (%)
Ancestries Reported - Italian (%)
Ancestries Reported - Lithuanian (%)
Ancestries Reported - Norwegian (%)
Ancestries Reported - Polish (%)
Ancestries Reported - Portuguese (%)
Ancestries Reported - Russian (%)
Ancestries Reported - Scotch-Irish (%)
Ancestries Reported - Scottish (%)
Ancestries Reported - Slovak (%)
Ancestries Reported - Subsaharan African (%)
Ancestries Reported - Swedish (%)
Ancestries Reported - Swiss (%)
Ancestries Reported - Ukrainian (%)
Ancestries Reported - United States (%)
Ancestries Reported - Welsh (%)
Ancestries Reported - West Indian (%)
Ancestries Reported - Other (%)
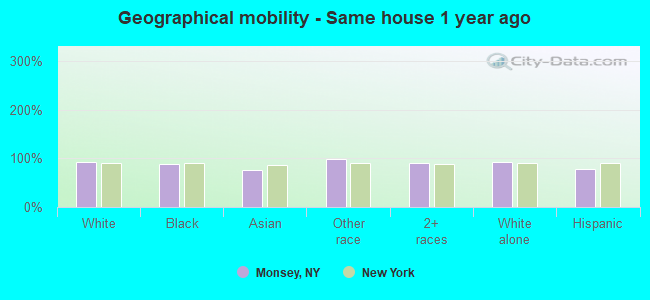
Geographical mobility - Same house 1 year ago (%)
Geographical mobility - Same house 1 year ago (%) - White
Geographical mobility - Same house 1 year ago (%) - Black or African American
Geographical mobility - Same house 1 year ago (%) - Asian
Geographical mobility - Same house 1 year ago (%) - Hispanic or Latino
Geographical mobility - Same house 1 year ago (%) - American Indian and Alaska Native
Geographical mobility - Same house 1 year ago (%) - Multirace
Geographical mobility - Same house 1 year ago (%) - Other Race
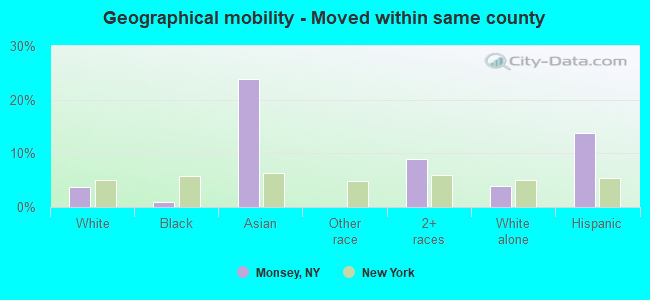
Geographical mobility - Moved within same county (%)
Geographical mobility - Moved within same county (%) - White
Geographical mobility - Moved within same county (%) - Black or African American
Geographical mobility - Moved within same county (%) - Asian
Geographical mobility - Moved within same county (%) - Hispanic or Latino
Geographical mobility - Moved within same county (%) - American Indian and Alaska Native
Geographical mobility - Moved within same county (%) - Multirace
Geographical mobility - Moved within same county (%) - Other Race
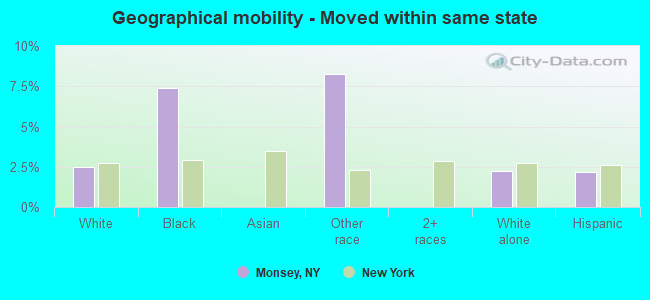
Geographical mobility - Moved from different county within same state (%)
Geographical mobility - Moved from different county within same state (%) - White
Geographical mobility - Moved from different county within same state (%) - Black or African American
Geographical mobility - Moved from different county within same state (%) - Asian
Geographical mobility - Moved from different county within same state (%) - Hispanic or Latino
Geographical mobility - Moved from different county within same state (%) - American Indian and Alaska Native
Geographical mobility - Moved from different county within same state (%) - Multirace
Geographical mobility - Moved from different county within same state (%) - Other Race
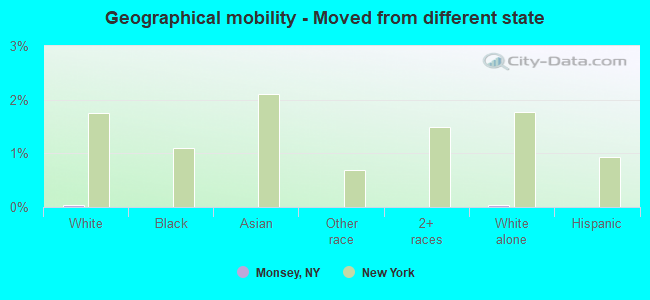
Geographical mobility - Moved from different state (%)
Geographical mobility - Moved from different state (%) - White
Geographical mobility - Moved from different state (%) - Black or African American
Geographical mobility - Moved from different state (%) - Asian
Geographical mobility - Moved from different state (%) - Hispanic or Latino
Geographical mobility - Moved from different state (%) - American Indian and Alaska Native
Geographical mobility - Moved from different state (%) - Multirace
Geographical mobility - Moved from different state (%) - Other Race
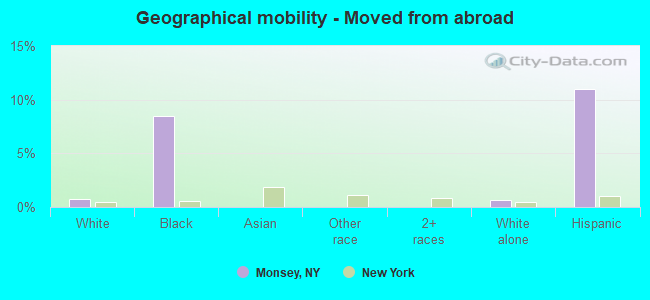
Geographical mobility - Moved from abroad (%)
Geographical mobility - Moved from abroad (%) - White
Geographical mobility - Moved from abroad (%) - Black or African American
Geographical mobility - Moved from abroad (%) - Asian
Geographical mobility - Moved from abroad (%) - Hispanic or Latino
Geographical mobility - Moved from abroad (%) - American Indian and Alaska Native
Geographical mobility - Moved from abroad (%) - Multirace
Geographical mobility - Moved from abroad (%) - Other Race
Place of birth for the foreign-born population - Ireland (%)
Place of birth for the foreign-born population - Denmark (%)
Place of birth for the foreign-born population - Norway (%)
Place of birth for the foreign-born population - Sweden (%)
Place of birth for the foreign-born population - United Kingdom (%)
Place of birth for the foreign-born population - England (%)
Place of birth for the foreign-born population - Scotland (%)
Place of birth for the foreign-born population - Other Northern Europe (%)
Place of birth for the foreign-born population - Austria (%)
Place of birth for the foreign-born population - Belgium (%)
Place of birth for the foreign-born population - France (%)
Place of birth for the foreign-born population - Germany (%)
Place of birth for the foreign-born population - Netherlands (%)
Place of birth for the foreign-born population - Switzerland (%)
Place of birth for the foreign-born population - Other Western Europe (%)
Place of birth for the foreign-born population - Greece (%)
Place of birth for the foreign-born population - Italy (%)
Place of birth for the foreign-born population - Portugal (%)
Place of birth for the foreign-born population - Spain (%)
Place of birth for the foreign-born population - Other Southern Europe (%)
Place of birth for the foreign-born population - Albania (%)
Place of birth for the foreign-born population - Belarus (%)
Place of birth for the foreign-born population - Bosnia and Herzegovina (%)
Place of birth for the foreign-born population - Bulgaria (%)
Place of birth for the foreign-born population - Croatia (%)
Place of birth for the foreign-born population - Czechoslovakia (%)
Place of birth for the foreign-born population - Hungary (%)
Place of birth for the foreign-born population - Latvia (%)
Place of birth for the foreign-born population - Lithuania (%)
Place of birth for the foreign-born population - North Macedonia (Macedonia) (%)
Place of birth for the foreign-born population - Moldova (%)
Place of birth for the foreign-born population - Poland (%)
Place of birth for the foreign-born population - Romania (%)
Place of birth for the foreign-born population - Russia (%)
Place of birth for the foreign-born population - Serbia (%)
Place of birth for the foreign-born population - Ukraine (%)
Place of birth for the foreign-born population - Other Eastern Europe (%)
Place of birth for the foreign-born population - China (%)
Place of birth for the foreign-born population - Hong Kong (%)
Place of birth for the foreign-born population - Taiwan (%)
Place of birth for the foreign-born population - Japan (%)
Place of birth for the foreign-born population - Korea (%)
Place of birth for the foreign-born population - Other Eastern Asia (%)
Place of birth for the foreign-born population - Afghanistan (%)
Place of birth for the foreign-born population - Bangladesh (%)
Place of birth for the foreign-born population - India (%)
Place of birth for the foreign-born population - Iran (%)
Place of birth for the foreign-born population - Kazakhstan (%)
Place of birth for the foreign-born population - Nepal (%)
Place of birth for the foreign-born population - Pakistan (%)
Place of birth for the foreign-born population - Sri Lanka (%)
Place of birth for the foreign-born population - Uzbekistan (%)
Place of birth for the foreign-born population - Other South Central Asia (%)
Place of birth for the foreign-born population - Burma (%)
Place of birth for the foreign-born population - Cambodia (%)
Place of birth for the foreign-born population - Indonesia (%)
Place of birth for the foreign-born population - Laos (%)
Place of birth for the foreign-born population - Malaysia (%)
Place of birth for the foreign-born population - Philippines (%)
Place of birth for the foreign-born population - Singapore (%)
Place of birth for the foreign-born population - Thailand (%)
Place of birth for the foreign-born population - Vietnam (%)
Place of birth for the foreign-born population - Other South Eastern Asia (%)
Place of birth for the foreign-born population - Armenia (%)
Place of birth for the foreign-born population - Iraq (%)
Place of birth for the foreign-born population - Israel (%)
Place of birth for the foreign-born population - Jordan (%)
Place of birth for the foreign-born population - Kuwait (%)
Place of birth for the foreign-born population - Lebanon (%)
Place of birth for the foreign-born population - Saudi Arabia (%)
Place of birth for the foreign-born population - Syria (%)
Place of birth for the foreign-born population - Turkey (%)
Place of birth for the foreign-born population - Yemen (%)
Place of birth for the foreign-born population - Other Western Asia (%)
Place of birth for the foreign-born population - Eritrea (%)
Place of birth for the foreign-born population - Ethiopia (%)
Place of birth for the foreign-born population - Kenya (%)
Place of birth for the foreign-born population - Somalia (%)
Place of birth for the foreign-born population - Uganda (%)
Place of birth for the foreign-born population - Zimbabwe (%)
Place of birth for the foreign-born population - Other Eastern Africa (%)
Place of birth for the foreign-born population - Cameroon (%)
Place of birth for the foreign-born population - Congo (%)
Place of birth for the foreign-born population - Democratic Republic of Congo (Zaire) (%)
Place of birth for the foreign-born population - Other Middle Africa (%)
Place of birth for the foreign-born population - Egypt (%)
Place of birth for the foreign-born population - Morocco (%)
Place of birth for the foreign-born population - Sudan (%)
Place of birth for the foreign-born population - Other Northern Africa (%)
Place of birth for the foreign-born population - South Africa (%)
Place of birth for the foreign-born population - Other Southern Africa (%)
Place of birth for the foreign-born population - Cabo Verde (%)
Place of birth for the foreign-born population - Ghana (%)
Place of birth for the foreign-born population - Liberia (%)
Place of birth for the foreign-born population - Nigeria (%)
Place of birth for the foreign-born population - Senegal (%)
Place of birth for the foreign-born population - Sierra Leone (%)
Place of birth for the foreign-born population - Other Western Africa (%)
Place of birth for the foreign-born population - Australia (%)
Place of birth for the foreign-born population - New Zealand (%)
Place of birth for the foreign-born population - Fiji (%)
Place of birth for the foreign-born population - Micronesia (%)
Place of birth for the foreign-born population - Bahamas (%)
Place of birth for the foreign-born population - Barbados (%)
Place of birth for the foreign-born population - Cuba (%)
Place of birth for the foreign-born population - Dominica (%)
Place of birth for the foreign-born population - Dominican Republic (%)
Place of birth for the foreign-born population - Grenada (%)
Place of birth for the foreign-born population - Haiti (%)
Place of birth for the foreign-born population - Jamaica (%)
Place of birth for the foreign-born population - St. Vincent and the Grenadines (%)
Place of birth for the foreign-born population - Trinidad and Tobago (%)
Place of birth for the foreign-born population - West Indies (%)
Place of birth for the foreign-born population - Other Caribbean (%)
Place of birth for the foreign-born population - Belize (%)
Place of birth for the foreign-born population - Costa Rica (%)
Place of birth for the foreign-born population - El Salvador (%)
Place of birth for the foreign-born population - Guatemala (%)
Place of birth for the foreign-born population - Honduras (%)
Place of birth for the foreign-born population - Mexico (%)
Place of birth for the foreign-born population - Nicaragua (%)
Place of birth for the foreign-born population - Panama (%)
Place of birth for the foreign-born population - Other Central America (%)
Place of birth for the foreign-born population - Argentina (%)
Place of birth for the foreign-born population - Bolivia (%)
Place of birth for the foreign-born population - Brazil (%)
Place of birth for the foreign-born population - Chile (%)
Place of birth for the foreign-born population - Colombia (%)
Place of birth for the foreign-born population - Ecuador (%)
Place of birth for the foreign-born population - Guyana (%)
Place of birth for the foreign-born population - Peru (%)
Place of birth for the foreign-born population - Uruguay (%)
Place of birth for the foreign-born population - Venezuela (%)
Place of birth for the foreign-born population - Other South America (%)
Place of birth for the foreign-born population - Canada (%)
Place of birth for the foreign-born population - Other Northern America (%)
Place of birth for the foreign-born population - Other (%)
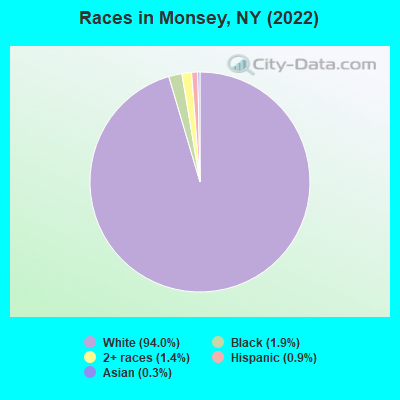
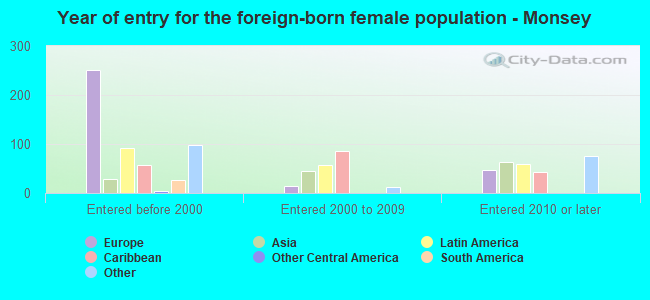
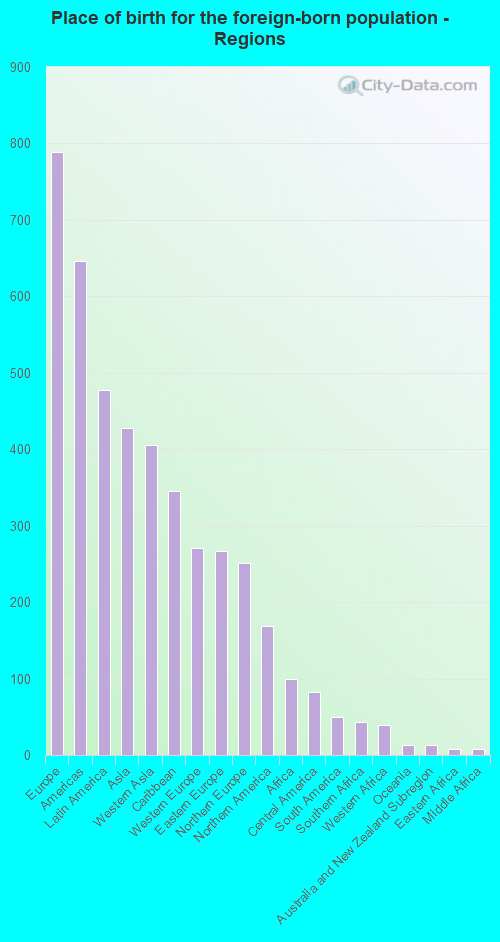
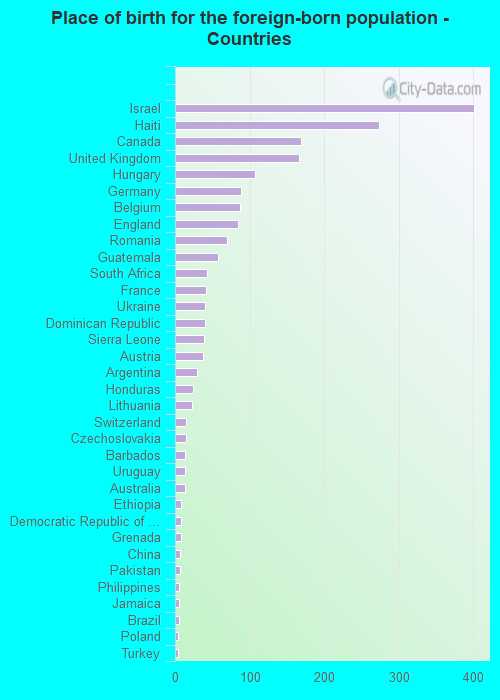
According to 2022 data, the most numerous races in Monsey, NY are White alone (26,710 residents), Hispanic (253 residents), and Black alone (541 residents). 19.7% of Monsey residents speak English at home. 7.0% of Monsey, NY residents are foreign-born (2.8% born in Europe, 1.7% born in Latin America, 1.5% born in Asia), which is 216.0% less than the foreign-born rate of 22.0% across the entire state of New York.
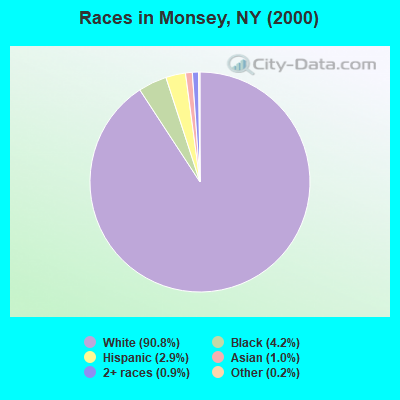
Race distribution in Monsey
2000 2022
11,760,981 62.0% White alone 2,867,583 15.1% Hispanic 2,812,623 14.8% Black alone 1,035,926 5.5% Asian alone 366,116 1.9% Two or more races 75,499 0.4% Other race alone 52,499 0.3% American Indian alone 5,230 0.03% Native Hawaiian and Other
10,408,933 52.9% White alone 3,867,299 19.7% Hispanic 2,633,840 13.4% Black alone 1,776,286 9.0% Asian alone 732,670 3.7% Two or more races 216,110 1.1% Other race alone 35,082 0.2% American Indian alone 6,931 0.04% Native Hawaiian and Other
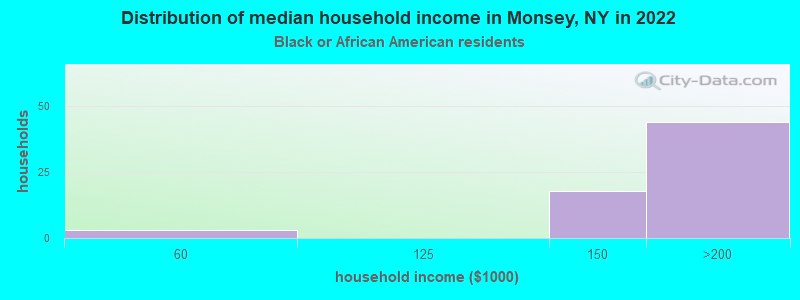
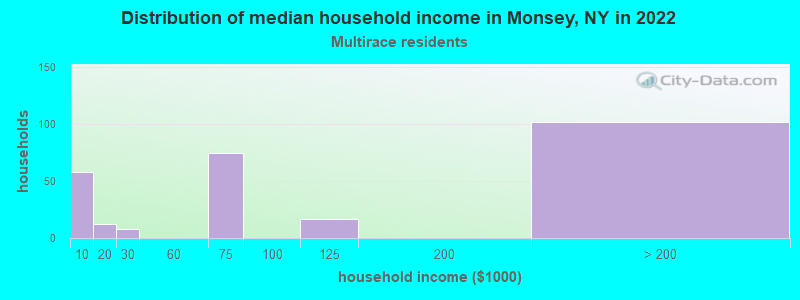
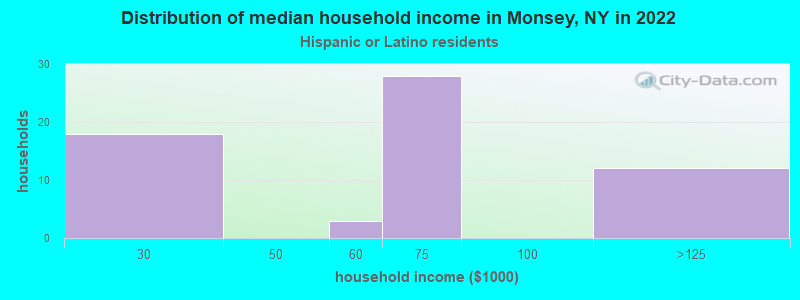
Income and house value in Monsey Median household income in 2022 $48,131 White non-Hispanic householders$128,379 Black householders$61,538 Hispanic or Latino race householdersMedian 2022 house value $897,486 White Non-Hispanic householders$664,675 Black or African American householders $719,659 Asian householders$652,495 Some other race householdersover $1,000,000 Two or more races householders$637,879 Hispanic or Latino householders
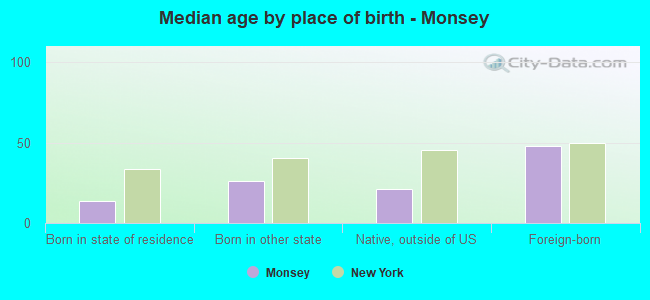
Median age by race in Monsey
14.2 Median age for White residents14.0 14.5 42.5 Median age for Black or African American residents50.0 43.0 -666,666,666.0 Median age for American Indian / Alaska Native residents-750,656,167.2 -644,444,443.8 34.7 Median age for Asian residents-616,822,429.3 33.6 -463,937,621.4 Median age for Native Hawaiian / Pacific Islander residents-649,572,648.9 -666,666,666.0 26.3 Median age for Other race residents25.3 71.2 38.1 Median age for Two or more races residents42.9 42.6 14.0 Median age for White alone residents13.8 14.3 44.6 Median age for Hispanic or Latino residents42.1 46.0
Owner/renter occupied households by race in Monsey
House owners and renters - White residents 1,648 36.5% Owner occupied2,863 63.5% Renter occupiedHouse owners and renters - Black or African American residents 3 4.5% Owner occupied61 95.5% Renter occupiedHouse owners and renters - Asian residents 9 100.0% Owner occupiedHouse owners and renters - Other race residents 17 100.0% Renter occupiedHouse owners and renters - Two or more races residents 110 42.3% Owner occupied150 57.7% Renter occupiedHouse owners and renters - White alone residents 1,691 37.6% Owner occupied2,810 62.4% Renter occupiedHouse owners and renters - Hispanic or Latino residents 3 3.5% Owner occupied84 96.5% Renter occupied
Language usage in Monsey
English speakers - Total 19.7% of residents of Monsey speak English at home.
0.7% of residents speak Spanish at home 55 32.4% Speak English very well115 67.6% Speak English less than very well79.7% of residents speak other language at home 7,969 43.6% Speak English very well10,320 56.4% Speak English less than very well
English speakers - Born in the United States 68.6% of residents of Monsey speak English at home.
0.8% of residents speak Spanish at home 8 100.0% Speak English very well29.6% of residents speak other language at home 88 30.2% Speak English very well203 69.8% Speak English less than very well
English speakers - Native, born elsewhere 35.7% of residents of Monsey speak English at home.
2.3% of residents speak Spanish at home 8 34.8% Speak English very well15 65.2% Speak English less than very well78.4% of residents speak other language at home 303 39.2% Speak English very well469 60.8% Speak English less than very well
English speakers - Foreign-born 18.7% of residents of Monsey speak English at home.
5.3% of residents speak Spanish at home 24 23.5% Speak English very well78 76.5% Speak English less than very well75.7% of residents speak other language at home 644 43.9% Speak English very well822 56.1% Speak English less than very well
White (Caucasian) - Speak only English Native:
18.3% (3,624)Foreign-born:
22.9% (265)
White (Caucasian) - Speak another language Native:
77.5% (15,328)Foreign-born:
74.4% (860)
Black or African American - Speak only English Native:
55.8% (79)Foreign-born:
6.0% (20)
Black or African American - Speak another language Native:
45.0% (64)Foreign-born:
96.1% (325)
Asian - Speak only English Native:
58.8% (32)Foreign-born:
33.9% (8)
Asian - Speak another language Native:
41.4% (23)Foreign-born:
70.4% (16)
Other race - Speak another language Native:
90.5% (19)Foreign-born:
100.0% (81)
Two or more races - Speak only English Native:
85.9% (452)Foreign-born:
100.0% (91)
Two or more races - Speak another language Native:
18.3% (97)Foreign-born:
20.2% (19)
White alone - Speak only English Native:
17.8% (3,586)Foreign-born:
20.0% (264)
White alone - Speak another language Native:
82.6% (16,639)Foreign-born:
78.9% (1,041)
Hispanic or Latino - Speak only English Native:
33.7% (43)Foreign-born:
16.9% (21)
Hispanic or Latino - Speak another language Native:
59.5% (76)Foreign-born:
84.3% (103)
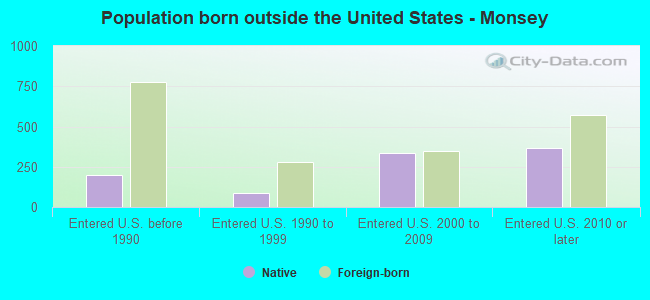
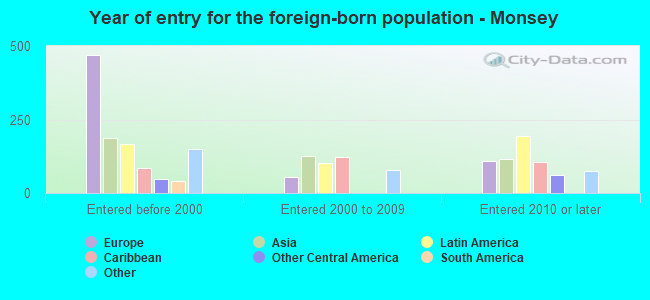
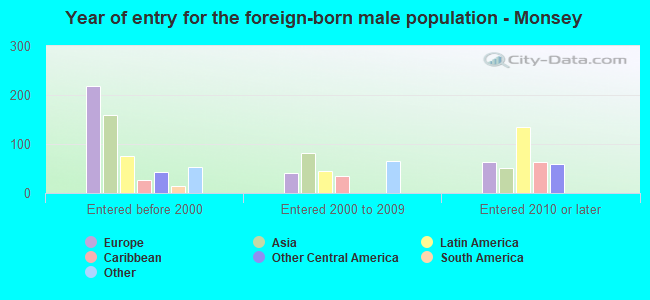
Foreign-born residents in Monsey 1,979 residents are foreign born (2.8% Europe , 1.7% Latin America , 1.5% Asia ).
This city:
7.0%New York:
22.6%
Marital status for residents in Monsey Marital status - White (Caucasian) population 15 years and over
Males 33.4% Never married65.9% Now married0.1% Separated0.4% Widowed0.3% DivorcedFemales 26.7% Never married67.1% Now married0.0% Separated2.0% Widowed4.3% DivorcedWomen who gave birth in the past 12 months Now married:
98.4% (1,289)Unmarried:
1.6% (21)
Women who did not give birth in the past 12 months Now married:
54.4% (1,974)Unmarried:
45.6% (1,655)
Marital status - Black or African American population 15 years and over
Males 28.7% Never married39.8% Now married27.5% Separated4.1% Widowed0.0% DivorcedFemales 17.6% Never married52.1% Now married0.0% Separated8.0% Widowed22.3% DivorcedWomen who did not give birth in the past 12 months Now married:
58.9% (71)Unmarried:
41.1% (50)
Marital status - Asian population 15 years and over
Males 57.9% Never married42.1% Now married0.0% Separated0.0% Widowed0.0% DivorcedFemales 67.2% Never married32.8% Now married0.0% Separated0.0% Widowed0.0% DivorcedWomen who did not give birth in the past 12 months Now married:
0.0% (0)Unmarried:
100.0% (39)
Marital status - Other race population 15 years and over
Males 74.6% Never married0.0% Now married0.0% Separated0.0% Widowed25.4% DivorcedFemales 18.2% Never married0.0% Now married0.0% Separated0.0% Widowed81.8% DivorcedMarital status - Two or more races population 15 years and over
Males 25.7% Never married74.3% Now married0.0% Separated0.0% Widowed0.0% DivorcedFemales 15.3% Never married53.8% Now married0.0% Separated0.0% Widowed30.9% DivorcedWomen who did not give birth in the past 12 months Now married:
45.2% (141)Unmarried:
54.8% (171)
Marital status - White alone, not Hispanic / Latino population 15 years and over
Males 33.1% Never married66.2% Now married0.1% Separated0.4% Widowed0.3% DivorcedFemales 26.6% Never married67.2% Now married0.0% Separated2.0% Widowed4.3% DivorcedWomen who gave birth in the past 12 months Now married:
98.4% (1,333)Unmarried:
1.6% (21)
Women who did not give birth in the past 12 months Now married:
54.5% (2,042)Unmarried:
45.5% (1,708)
Marital status - Hispanic or Latino population 15 years and over
Males 60.6% Never married26.8% Now married0.0% Separated0.0% Widowed12.7% DivorcedFemales 16.9% Never married62.9% Now married0.0% Separated0.0% Widowed20.2% DivorcedWomen who did not give birth in the past 12 months Now married:
91.4% (55)Unmarried:
8.6% (5)
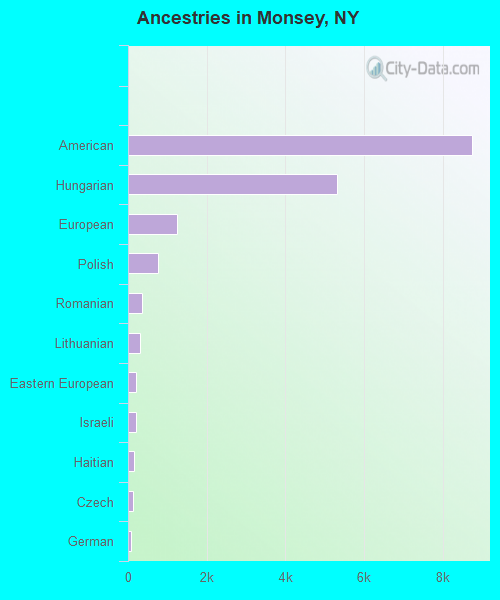
Ancestries in Monsey
8,745 43.5% American5,317 26.5% Hungarian1,242 6.2% European763 3.8% Polish350 1.7% Romanian298 1.5% Lithuanian212 1.1% Eastern European198 1.0% Israeli144 0.7% Haitian124 0.6% Czech81 0.4% German71 0.4% Swiss54 0.3% Irish39 0.2% Dutch39 0.2% English37 0.2% Russian35 0.2% Ukrainian33 0.2% British28 0.1% Austrian26 0.1% French23 0.1% South African22 0.1% Belgian19 0.09% Lebanese18 0.09% Canadian14 0.07% British West Indian13 0.06% Czechoslovakian10 0.05% Ethiopian7 0.03% West Indian5 0.02% Slovak5 0.02% Turkish4 0.02% Italian
Children Nativity (place of birth) in Monsey
Children under 6 years - Living with two parents Both parents native 5,183 100.0% NativeBoth parents foreign-born 78 100.0% NativeOne native, one foreign-born parent 1,218 100.0% NativeChildren under 6 years - Living with one parent Native parent 17 100.0% NativeChildren 6 to 17 years - Living with two parents Both parents native 7,663 100.0% NativeBoth parents foreign-born 164 65.2% Native87 34.8% Foreign-bornOne native, one foreign-born parent 2,097 100.0% NativeChildren 6 to 17 years - Living with one parent Native parent 157 100.0% NativeForeign-born parent 5 47.2% Native5 52.8% Foreign-born