Races in Montgomery, Ohio (OH) Detailed Stats
Data:
Races - White alone (%)
Races - White alone (% change since 2000)
Races - Black alone (%)
Races - Black alone (% change since 2000)
Races - American Indian alone (%)
Races - American Indian alone (% change since 2000)
Races - Asian alone (%)
Races - Asian alone (% change since 2000)
Races - Hispanic (%)
Races - Hispanic (% change since 2000)
Races - Native Hawaiian and Other Pacific Islander alone (%)
Races - Native Hawaiian and Other Pacific Islander alone (% change since 2000)
Races - Two or more races(%)
Races - Two or more races(% change since 2000)
Races - Other race alone (%)
Races - Other race alone (% change since 2000)
Racial diversity
Place of birth - Born in state of residence (%)
Place of birth - Born in state of residence (%) - White
Place of birth - Born in state of residence (%) - Black or African American
Place of birth - Born in state of residence (%) - Asian
Place of birth - Born in state of residence (%) - Hispanic or Latino
Place of birth - Born in state of residence (%) - American Indian and Alaska Native
Place of birth - Born in state of residence (%) - Multirace
Place of birth - Born in state of residence (%) - Other Race
Place of birth - Born in other state (%)
Place of birth - Born in other state (%) - White
Place of birth - Born in other state (%) - Black or African American
Place of birth - Born in other state (%) - Asian
Place of birth - Born in other state (%) - Hispanic or Latino
Place of birth - Born in other state (%) - American Indian and Alaska Native
Place of birth - Born in other state (%) - Multirace
Place of birth - Born in other state (%) - Other Race
Place of birth - Native, outside of US (%)
Place of birth - Native, outside of US (%) - White
Place of birth - Native, outside of US (%) - Black or African American
Place of birth - Native, outside of US (%) - Asian
Place of birth - Native, outside of US (%) - Hispanic or Latino
Place of birth - Native, outside of US (%) - American Indian and Alaska Native
Place of birth - Native, outside of US (%) - Multirace
Place of birth - Native, outside of US (%) - Other Race
Place of birth - Foreign born (%)
Place of birth - Foreign born (%) - White
Place of birth - Foreign born (%) - Black or African American
Place of birth - Foreign born (%) - Asian
Place of birth - Foreign born (%) - Hispanic or Latino
Place of birth - Foreign born (%) - American Indian and Alaska Native
Place of birth - Foreign born (%) - Multirace
Place of birth - Foreign born (%) - Other Race
Residents speaking English at home (%)
Residents speaking English at home - Born in the United States (%)
Residents speaking English at home - Native, born elsewhere (%)
Residents speaking English at home - Foreign born (%)
Residents speaking Spanish at home (%)
Residents speaking Spanish at home - Born in the United States (%)
Residents speaking Spanish at home - Native, born elsewhere (%)
Residents speaking Spanish at home - Foreign born (%)
Residents speaking other language at home (%)
Residents speaking other language at home - Born in the United States (%)
Residents speaking other language at home - Native, born elsewhere (%)
Residents speaking other language at home - Foreign born (%)
Marital status - Never married (%)
Marital status - Now married (%)
Marital status - Separated (%)
Marital status - Widowed (%)
Marital status - Divorced (%)
Ancestries Reported - Arab (%)
Ancestries Reported - Czech (%)
Ancestries Reported - Danish (%)
Ancestries Reported - Dutch (%)
Ancestries Reported - English (%)
Ancestries Reported - French (%)
Ancestries Reported - French Canadian (%)
Ancestries Reported - German (%)
Ancestries Reported - Greek (%)
Ancestries Reported - Hungarian (%)
Ancestries Reported - Irish (%)
Ancestries Reported - Italian (%)
Ancestries Reported - Lithuanian (%)
Ancestries Reported - Norwegian (%)
Ancestries Reported - Polish (%)
Ancestries Reported - Portuguese (%)
Ancestries Reported - Russian (%)
Ancestries Reported - Scotch-Irish (%)
Ancestries Reported - Scottish (%)
Ancestries Reported - Slovak (%)
Ancestries Reported - Subsaharan African (%)
Ancestries Reported - Swedish (%)
Ancestries Reported - Swiss (%)
Ancestries Reported - Ukrainian (%)
Ancestries Reported - United States (%)
Ancestries Reported - Welsh (%)
Ancestries Reported - West Indian (%)
Ancestries Reported - Other (%)
Geographical mobility - Same house 1 year ago (%)
Geographical mobility - Same house 1 year ago (%) - White
Geographical mobility - Same house 1 year ago (%) - Black or African American
Geographical mobility - Same house 1 year ago (%) - Asian
Geographical mobility - Same house 1 year ago (%) - Hispanic or Latino
Geographical mobility - Same house 1 year ago (%) - American Indian and Alaska Native
Geographical mobility - Same house 1 year ago (%) - Multirace
Geographical mobility - Same house 1 year ago (%) - Other Race
Geographical mobility - Moved within same county (%)
Geographical mobility - Moved within same county (%) - White
Geographical mobility - Moved within same county (%) - Black or African American
Geographical mobility - Moved within same county (%) - Asian
Geographical mobility - Moved within same county (%) - Hispanic or Latino
Geographical mobility - Moved within same county (%) - American Indian and Alaska Native
Geographical mobility - Moved within same county (%) - Multirace
Geographical mobility - Moved within same county (%) - Other Race
Geographical mobility - Moved from different county within same state (%)
Geographical mobility - Moved from different county within same state (%) - White
Geographical mobility - Moved from different county within same state (%) - Black or African American
Geographical mobility - Moved from different county within same state (%) - Asian
Geographical mobility - Moved from different county within same state (%) - Hispanic or Latino
Geographical mobility - Moved from different county within same state (%) - American Indian and Alaska Native
Geographical mobility - Moved from different county within same state (%) - Multirace
Geographical mobility - Moved from different county within same state (%) - Other Race
Geographical mobility - Moved from different state (%)
Geographical mobility - Moved from different state (%) - White
Geographical mobility - Moved from different state (%) - Black or African American
Geographical mobility - Moved from different state (%) - Asian
Geographical mobility - Moved from different state (%) - Hispanic or Latino
Geographical mobility - Moved from different state (%) - American Indian and Alaska Native
Geographical mobility - Moved from different state (%) - Multirace
Geographical mobility - Moved from different state (%) - Other Race
Geographical mobility - Moved from abroad (%)
Geographical mobility - Moved from abroad (%) - White
Geographical mobility - Moved from abroad (%) - Black or African American
Geographical mobility - Moved from abroad (%) - Asian
Geographical mobility - Moved from abroad (%) - Hispanic or Latino
Geographical mobility - Moved from abroad (%) - American Indian and Alaska Native
Geographical mobility - Moved from abroad (%) - Multirace
Geographical mobility - Moved from abroad (%) - Other Race
Place of birth for the foreign-born population - Ireland (%)
Place of birth for the foreign-born population - Denmark (%)
Place of birth for the foreign-born population - Norway (%)
Place of birth for the foreign-born population - Sweden (%)
Place of birth for the foreign-born population - United Kingdom (%)
Place of birth for the foreign-born population - England (%)
Place of birth for the foreign-born population - Scotland (%)
Place of birth for the foreign-born population - Other Northern Europe (%)
Place of birth for the foreign-born population - Austria (%)
Place of birth for the foreign-born population - Belgium (%)
Place of birth for the foreign-born population - France (%)
Place of birth for the foreign-born population - Germany (%)
Place of birth for the foreign-born population - Netherlands (%)
Place of birth for the foreign-born population - Switzerland (%)
Place of birth for the foreign-born population - Other Western Europe (%)
Place of birth for the foreign-born population - Greece (%)
Place of birth for the foreign-born population - Italy (%)
Place of birth for the foreign-born population - Portugal (%)
Place of birth for the foreign-born population - Spain (%)
Place of birth for the foreign-born population - Other Southern Europe (%)
Place of birth for the foreign-born population - Albania (%)
Place of birth for the foreign-born population - Belarus (%)
Place of birth for the foreign-born population - Bosnia and Herzegovina (%)
Place of birth for the foreign-born population - Bulgaria (%)
Place of birth for the foreign-born population - Croatia (%)
Place of birth for the foreign-born population - Czechoslovakia (%)
Place of birth for the foreign-born population - Hungary (%)
Place of birth for the foreign-born population - Latvia (%)
Place of birth for the foreign-born population - Lithuania (%)
Place of birth for the foreign-born population - North Macedonia (Macedonia) (%)
Place of birth for the foreign-born population - Moldova (%)
Place of birth for the foreign-born population - Poland (%)
Place of birth for the foreign-born population - Romania (%)
Place of birth for the foreign-born population - Russia (%)
Place of birth for the foreign-born population - Serbia (%)
Place of birth for the foreign-born population - Ukraine (%)
Place of birth for the foreign-born population - Other Eastern Europe (%)
Place of birth for the foreign-born population - China (%)
Place of birth for the foreign-born population - Hong Kong (%)
Place of birth for the foreign-born population - Taiwan (%)
Place of birth for the foreign-born population - Japan (%)
Place of birth for the foreign-born population - Korea (%)
Place of birth for the foreign-born population - Other Eastern Asia (%)
Place of birth for the foreign-born population - Afghanistan (%)
Place of birth for the foreign-born population - Bangladesh (%)
Place of birth for the foreign-born population - India (%)
Place of birth for the foreign-born population - Iran (%)
Place of birth for the foreign-born population - Kazakhstan (%)
Place of birth for the foreign-born population - Nepal (%)
Place of birth for the foreign-born population - Pakistan (%)
Place of birth for the foreign-born population - Sri Lanka (%)
Place of birth for the foreign-born population - Uzbekistan (%)
Place of birth for the foreign-born population - Other South Central Asia (%)
Place of birth for the foreign-born population - Burma (%)
Place of birth for the foreign-born population - Cambodia (%)
Place of birth for the foreign-born population - Indonesia (%)
Place of birth for the foreign-born population - Laos (%)
Place of birth for the foreign-born population - Malaysia (%)
Place of birth for the foreign-born population - Philippines (%)
Place of birth for the foreign-born population - Singapore (%)
Place of birth for the foreign-born population - Thailand (%)
Place of birth for the foreign-born population - Vietnam (%)
Place of birth for the foreign-born population - Other South Eastern Asia (%)
Place of birth for the foreign-born population - Armenia (%)
Place of birth for the foreign-born population - Iraq (%)
Place of birth for the foreign-born population - Israel (%)
Place of birth for the foreign-born population - Jordan (%)
Place of birth for the foreign-born population - Kuwait (%)
Place of birth for the foreign-born population - Lebanon (%)
Place of birth for the foreign-born population - Saudi Arabia (%)
Place of birth for the foreign-born population - Syria (%)
Place of birth for the foreign-born population - Turkey (%)
Place of birth for the foreign-born population - Yemen (%)
Place of birth for the foreign-born population - Other Western Asia (%)
Place of birth for the foreign-born population - Eritrea (%)
Place of birth for the foreign-born population - Ethiopia (%)
Place of birth for the foreign-born population - Kenya (%)
Place of birth for the foreign-born population - Somalia (%)
Place of birth for the foreign-born population - Uganda (%)
Place of birth for the foreign-born population - Zimbabwe (%)
Place of birth for the foreign-born population - Other Eastern Africa (%)
Place of birth for the foreign-born population - Cameroon (%)
Place of birth for the foreign-born population - Congo (%)
Place of birth for the foreign-born population - Democratic Republic of Congo (Zaire) (%)
Place of birth for the foreign-born population - Other Middle Africa (%)
Place of birth for the foreign-born population - Egypt (%)
Place of birth for the foreign-born population - Morocco (%)
Place of birth for the foreign-born population - Sudan (%)
Place of birth for the foreign-born population - Other Northern Africa (%)
Place of birth for the foreign-born population - South Africa (%)
Place of birth for the foreign-born population - Other Southern Africa (%)
Place of birth for the foreign-born population - Cabo Verde (%)
Place of birth for the foreign-born population - Ghana (%)
Place of birth for the foreign-born population - Liberia (%)
Place of birth for the foreign-born population - Nigeria (%)
Place of birth for the foreign-born population - Senegal (%)
Place of birth for the foreign-born population - Sierra Leone (%)
Place of birth for the foreign-born population - Other Western Africa (%)
Place of birth for the foreign-born population - Australia (%)
Place of birth for the foreign-born population - New Zealand (%)
Place of birth for the foreign-born population - Fiji (%)
Place of birth for the foreign-born population - Micronesia (%)
Place of birth for the foreign-born population - Bahamas (%)
Place of birth for the foreign-born population - Barbados (%)
Place of birth for the foreign-born population - Cuba (%)
Place of birth for the foreign-born population - Dominica (%)
Place of birth for the foreign-born population - Dominican Republic (%)
Place of birth for the foreign-born population - Grenada (%)
Place of birth for the foreign-born population - Haiti (%)
Place of birth for the foreign-born population - Jamaica (%)
Place of birth for the foreign-born population - St. Vincent and the Grenadines (%)
Place of birth for the foreign-born population - Trinidad and Tobago (%)
Place of birth for the foreign-born population - West Indies (%)
Place of birth for the foreign-born population - Other Caribbean (%)
Place of birth for the foreign-born population - Belize (%)
Place of birth for the foreign-born population - Costa Rica (%)
Place of birth for the foreign-born population - El Salvador (%)
Place of birth for the foreign-born population - Guatemala (%)
Place of birth for the foreign-born population - Honduras (%)
Place of birth for the foreign-born population - Mexico (%)
Place of birth for the foreign-born population - Nicaragua (%)
Place of birth for the foreign-born population - Panama (%)
Place of birth for the foreign-born population - Other Central America (%)
Place of birth for the foreign-born population - Argentina (%)
Place of birth for the foreign-born population - Bolivia (%)
Place of birth for the foreign-born population - Brazil (%)
Place of birth for the foreign-born population - Chile (%)
Place of birth for the foreign-born population - Colombia (%)
Place of birth for the foreign-born population - Ecuador (%)
Place of birth for the foreign-born population - Guyana (%)
Place of birth for the foreign-born population - Peru (%)
Place of birth for the foreign-born population - Uruguay (%)
Place of birth for the foreign-born population - Venezuela (%)
Place of birth for the foreign-born population - Other South America (%)
Place of birth for the foreign-born population - Canada (%)
Place of birth for the foreign-born population - Other Northern America (%)
Place of birth for the foreign-born population - Other (%)
Latest news about races in Montgomery, OH collected exclusively by city-data.com from local newspapers, TV, and radio stations
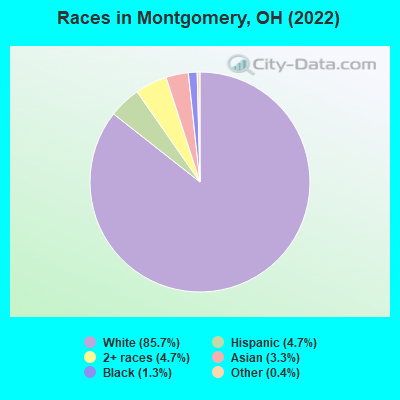
According to 2022 data, the most numerous races in Montgomery, OH are White alone (9,238 residents), Black alone (142 residents), and Two or more races (506 residents). 93.8% of Montgomery residents speak English at home. 5.4% of Montgomery, OH residents are foreign-born (2.8% born in Asia, 1.0% born in Latin America, 0.8% born in Europe, 0.6% born in North America), which is 25.8% greater than the foreign-born rate of 4.0% across the entire state of Ohio.
Race distribution in Montgomery
2000 2022
9,538,111 84.0% White alone 1,290,662 11.4% Black alone 217,123 1.9% Hispanic 137,770 1.2% Two or more races 131,670 1.2% Asian alone 21,985 0.2% American Indian alone 13,483 0.1% Other race alone 2,336 0.02% Native Hawaiian and Other
8,948,793 76.1% White alone 1,401,403 11.9% Black alone 529,291 4.5% Two or more races 517,232 4.4% Hispanic 293,387 2.5% Asian alone 52,805 0.4% Other race alone 9,785 0.08% American Indian alone 3,362 0.03% Native Hawaiian and Other
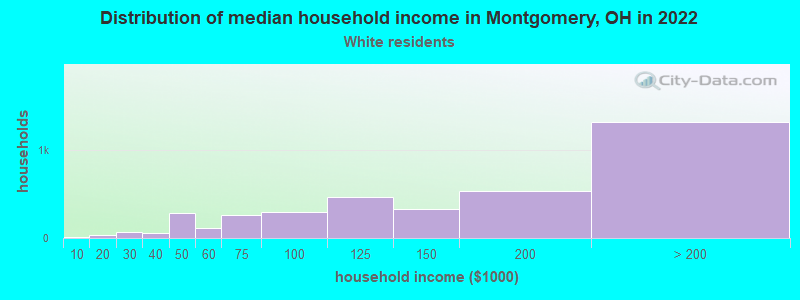
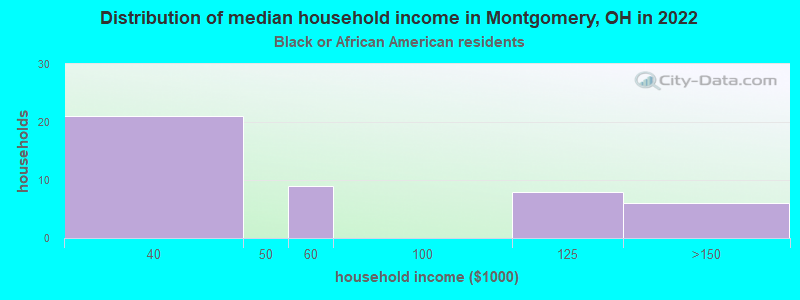
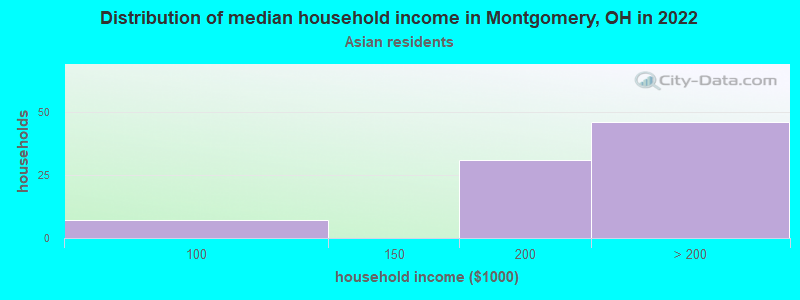
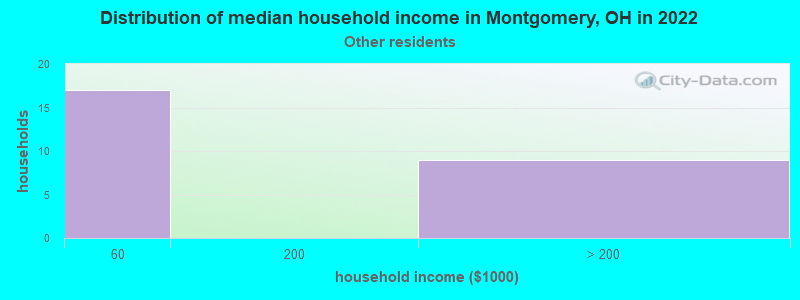
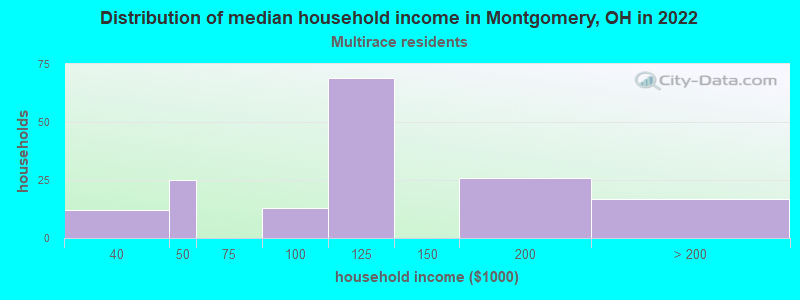
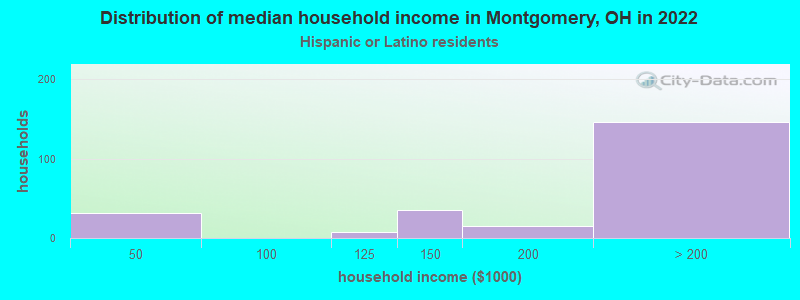
Income and house value in Montgomery Median household income in 2022 $138,922 White non-Hispanic householders$196,372 Asian householders$104,021 Two or more races householdersover $200,000 Hispanic or Latino race householdersMedian 2022 house value $539,813 White Non-Hispanic householders$430,676 Black or African American householders$336,466 American Indian or Alaska Native householders $545,686 Asian householders$550,580 Two or more races householders$192,825 Hispanic or Latino householders
Median age by race in Montgomery
45.4 Median age for White residents44.0 48.1 65.0 Median age for Black or African American residents47.5 67.2 -666,666,666.0 Median age for American Indian / Alaska Native residents-622,116,148.9 -871,212,120.3 39.9 Median age for Asian residents38.9 47.0 -800,387,596.1 Median age for Native Hawaiian / Pacific Islander residents-750,242,953.6 -805,394,989.6 44.2 Median age for Other race residents48.3 15.9 35.5 Median age for Two or more races residents27.9 51.3 45.8 Median age for White alone residents43.3 48.3 45.7 Median age for Hispanic or Latino residents46.5 11.4
Owner/renter occupied households by race in Montgomery
House owners and renters - White residents 3,425 90.2% Owner occupied374 9.8% Renter occupiedHouse owners and renters - Black or African American residents 8 16.4% Owner occupied42 83.6% Renter occupiedHouse owners and renters - Asian residents 86 100.0% Owner occupiedHouse owners and renters - Other race residents 13 100.0% Owner occupiedHouse owners and renters - Two or more races residents 260 100.0% Owner occupiedHouse owners and renters - White alone residents 3,309 90.4% Owner occupied351 9.6% Renter occupiedHouse owners and renters - Hispanic or Latino residents 186 86.6% Owner occupied29 13.4% Renter occupied
Language usage in Montgomery
English speakers - Total 93.8% of residents of Montgomery speak English at home.
1.3% of residents speak Spanish at home 131 100.0% Speak English very well4.8% of residents speak other language at home 446 93.7% Speak English very well30 6.3% Speak English less than very well
English speakers - Born in the United States 98.1% of residents of Montgomery speak English at home.
0.5% of residents speak Spanish at home 19 100.0% Speak English very well0.9% of residents speak other language at home 32 100.0% Speak English very well
All residents speak only English at home
English speakers - Foreign-born 41.6% of residents of Montgomery speak English at home.
11.3% of residents speak Spanish at home 65 100.0% Speak English very well50.1% of residents speak other language at home 282 97.9% Speak English very well6 2.1% Speak English less than very well
White (Caucasian) - Speak only English Native:
98.2% (8,371)Foreign-born:
51.1% (160)
White (Caucasian) - Speak another language Native:
1.8% (153)Foreign-born:
51.4% (161)
Asian - Speak only English Native:
35.7% (29)Foreign-born:
19.5% (44)
Asian - Speak another language Native:
56.3% (46)Foreign-born:
80.8% (185)
Other race - Speak only English Native:
73.1% (43)Foreign-born:
74.6% (13)
White alone - Speak only English Native:
97.9% (8,128)Foreign-born:
55.2% (119)
White alone - Speak another language Native:
2.1% (175)Foreign-born:
45.8% (99)
Hispanic or Latino - Speak only English Native:
87.2% (328)Foreign-born:
32.3% (45)
Hispanic or Latino - Speak another language Native:
4.9% (18)Foreign-born:
55.6% (77)
Foreign-born residents in Montgomery 581 residents are foreign born (2.8% Asia , 1.0% Latin America , 0.8% Europe , 0.6% North America ).
Marital status for residents in Montgomery Marital status - White (Caucasian) population 15 years and over
Males 18.6% Never married68.1% Now married0.0% Separated7.2% Widowed6.1% DivorcedFemales 15.1% Never married64.1% Now married0.3% Separated8.9% Widowed11.6% DivorcedWomen who gave birth in the past 12 months Now married:
100.0% (100)Unmarried:
0.0% (0)
Women who did not give birth in the past 12 months Now married:
60.9% (864)Unmarried:
39.1% (555)
Marital status - Black or African American population 15 years and over
Males 22.2% Never married25.0% Now married0.0% Separated12.5% Widowed40.3% DivorcedFemales 28.4% Never married24.3% Now married0.0% Separated47.3% Widowed0.0% DivorcedWomen who did not give birth in the past 12 months Now married:
34.8% (8)Unmarried:
65.2% (15)
Marital status - Asian population 15 years and over
Males 15.3% Never married84.7% Now married0.0% Separated0.0% Widowed0.0% DivorcedFemales 5.6% Never married94.4% Now married0.0% Separated0.0% Widowed0.0% DivorcedWomen who did not give birth in the past 12 months Now married:
88.9% (56)Unmarried:
11.1% (7)
Marital status - Other race population 15 years and over
Males 20.0% Never married20.0% Now married0.0% Separated0.0% Widowed60.0% DivorcedFemales 57.1% Never married17.1% Now married0.0% Separated0.0% Widowed25.7% DivorcedWomen who did not give birth in the past 12 months Now married:
23.1% (8)Unmarried:
76.9% (26)
Marital status - Two or more races population 15 years and over
Males 53.5% Never married42.6% Now married0.0% Separated0.0% Widowed3.9% DivorcedFemales 26.0% Never married61.0% Now married0.0% Separated2.7% Widowed10.3% DivorcedWomen who gave birth in the past 12 months Now married:
100.0% (10)Unmarried:
0.0% (0)
Women who did not give birth in the past 12 months Now married:
29.3% (31)Unmarried:
70.7% (74)
Marital status - White alone, not Hispanic / Latino population 15 years and over
Males 18.2% Never married67.5% Now married0.0% Separated7.7% Widowed6.5% DivorcedFemales 15.2% Never married64.3% Now married0.3% Separated8.5% Widowed11.7% DivorcedWomen who gave birth in the past 12 months Now married:
100.0% (101)Unmarried:
0.0% (0)
Women who did not give birth in the past 12 months Now married:
60.5% (857)Unmarried:
39.5% (560)
Marital status - Hispanic or Latino population 15 years and over
Males 21.9% Never married71.7% Now married0.0% Separated0.0% Widowed6.5% DivorcedFemales 18.9% Never married40.5% Now married0.0% Separated21.6% Widowed18.9% DivorcedWomen who did not give birth in the past 12 months Now married:
68.2% (33)Unmarried:
31.8% (16)
Ancestries in Montgomery
1,134 25.9% German697 15.9% English348 8.0% American321 7.3% European314 7.2% Irish253 5.8% Italian135 3.1% Israeli124 2.8% Scottish88 2.0% Eastern European48 1.1% Polish42 1.0% Greek41 0.9% French41 0.9% Welsh30 0.7% British16 0.4% Russian13 0.3% Portuguese13 0.3% Scotch-Irish12 0.3% Bulgarian12 0.3% Danish11 0.3% Brazilian11 0.3% Swedish9 0.2% Canadian9 0.2% Dutch9 0.2% Slovak7 0.2% Hungarian6 0.1% Scandinavian
Children Nativity (place of birth) in Montgomery
Children under 6 years - Living with two parents Both parents native 827 100.0% NativeBoth parents foreign-born 79 100.0% NativeOne native, one foreign-born parent 87 100.0% NativeChildren under 6 years - Living with one parent Native parent 57 100.0% NativeChildren 6 to 17 years - Living with two parents Both parents native 1,666 98.9% Native18 1.1% Foreign-bornBoth parents foreign-born 116 66.5% Native58 33.5% Foreign-bornOne native, one foreign-born parent 48 100.0% NativeChildren 6 to 17 years - Living with one parent Native parent 75 100.0% Native