Races in Montgomery Village, Maryland (MD) Detailed Stats
Data:
Races - White alone (%)
Races - White alone (% change since 2000)
Races - Black alone (%)
Races - Black alone (% change since 2000)
Races - American Indian alone (%)
Races - American Indian alone (% change since 2000)
Races - Asian alone (%)
Races - Asian alone (% change since 2000)
Races - Hispanic (%)
Races - Hispanic (% change since 2000)
Races - Native Hawaiian and Other Pacific Islander alone (%)
Races - Native Hawaiian and Other Pacific Islander alone (% change since 2000)
Races - Two or more races(%)
Races - Two or more races(% change since 2000)
Races - Other race alone (%)
Races - Other race alone (% change since 2000)
Racial diversity
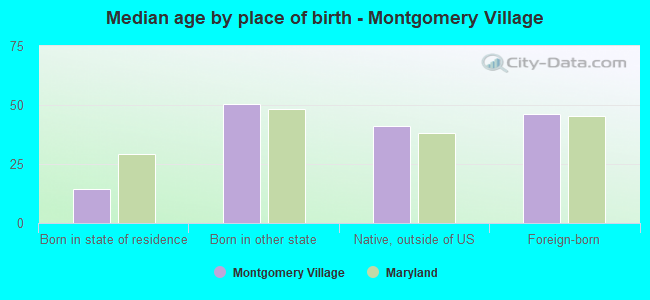
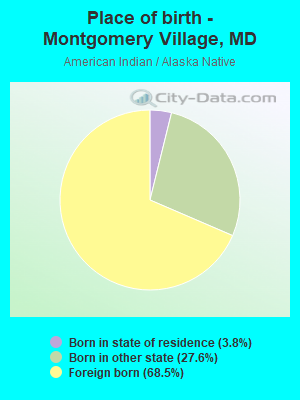
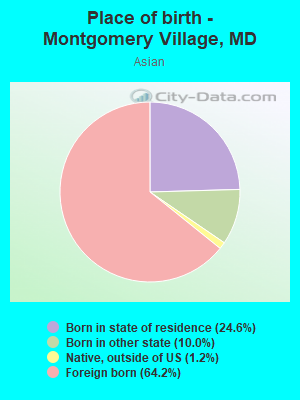
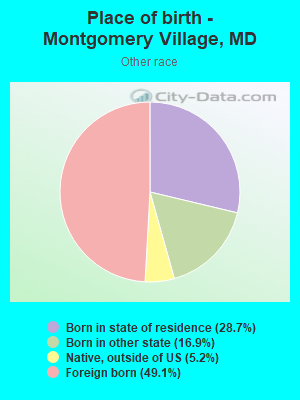
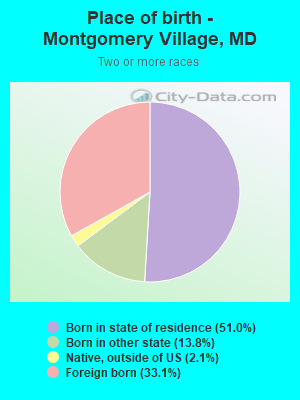
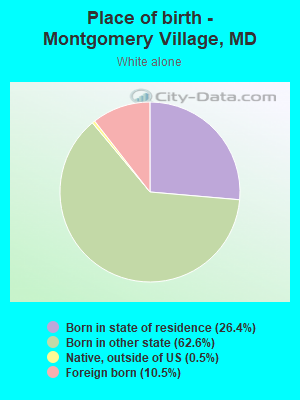
Place of birth - Born in state of residence (%)
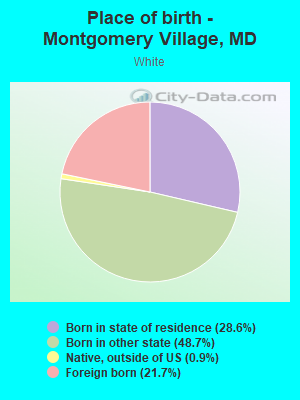
Place of birth - Born in state of residence (%) - White
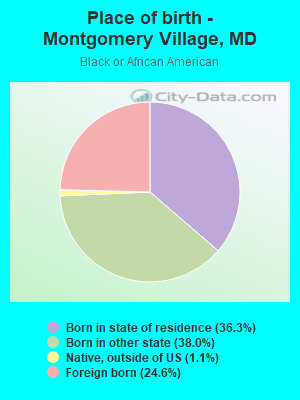
Place of birth - Born in state of residence (%) - Black or African American
Place of birth - Born in state of residence (%) - Asian
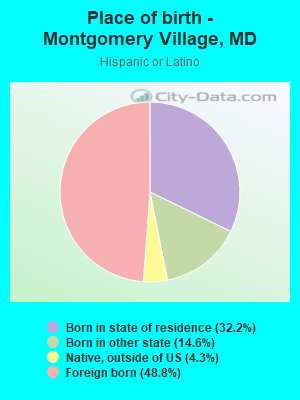
Place of birth - Born in state of residence (%) - Hispanic or Latino
Place of birth - Born in state of residence (%) - American Indian and Alaska Native
Place of birth - Born in state of residence (%) - Multirace
Place of birth - Born in state of residence (%) - Other Race
Place of birth - Born in other state (%)
Place of birth - Born in other state (%) - White
Place of birth - Born in other state (%) - Black or African American
Place of birth - Born in other state (%) - Asian
Place of birth - Born in other state (%) - Hispanic or Latino
Place of birth - Born in other state (%) - American Indian and Alaska Native
Place of birth - Born in other state (%) - Multirace
Place of birth - Born in other state (%) - Other Race
Place of birth - Native, outside of US (%)
Place of birth - Native, outside of US (%) - White
Place of birth - Native, outside of US (%) - Black or African American
Place of birth - Native, outside of US (%) - Asian
Place of birth - Native, outside of US (%) - Hispanic or Latino
Place of birth - Native, outside of US (%) - American Indian and Alaska Native
Place of birth - Native, outside of US (%) - Multirace
Place of birth - Native, outside of US (%) - Other Race
Place of birth - Foreign born (%)
Place of birth - Foreign born (%) - White
Place of birth - Foreign born (%) - Black or African American
Place of birth - Foreign born (%) - Asian
Place of birth - Foreign born (%) - Hispanic or Latino
Place of birth - Foreign born (%) - American Indian and Alaska Native
Place of birth - Foreign born (%) - Multirace
Place of birth - Foreign born (%) - Other Race
Residents speaking English at home (%)
Residents speaking English at home - Born in the United States (%)
Residents speaking English at home - Native, born elsewhere (%)
Residents speaking English at home - Foreign born (%)
Residents speaking Spanish at home (%)
Residents speaking Spanish at home - Born in the United States (%)
Residents speaking Spanish at home - Native, born elsewhere (%)
Residents speaking Spanish at home - Foreign born (%)
Residents speaking other language at home (%)
Residents speaking other language at home - Born in the United States (%)
Residents speaking other language at home - Native, born elsewhere (%)
Residents speaking other language at home - Foreign born (%)
Marital status - Never married (%)
Marital status - Now married (%)
Marital status - Separated (%)
Marital status - Widowed (%)
Marital status - Divorced (%)
Ancestries Reported - Arab (%)
Ancestries Reported - Czech (%)
Ancestries Reported - Danish (%)
Ancestries Reported - Dutch (%)
Ancestries Reported - English (%)
Ancestries Reported - French (%)
Ancestries Reported - French Canadian (%)
Ancestries Reported - German (%)
Ancestries Reported - Greek (%)
Ancestries Reported - Hungarian (%)
Ancestries Reported - Irish (%)
Ancestries Reported - Italian (%)
Ancestries Reported - Lithuanian (%)
Ancestries Reported - Norwegian (%)
Ancestries Reported - Polish (%)
Ancestries Reported - Portuguese (%)
Ancestries Reported - Russian (%)
Ancestries Reported - Scotch-Irish (%)
Ancestries Reported - Scottish (%)
Ancestries Reported - Slovak (%)
Ancestries Reported - Subsaharan African (%)
Ancestries Reported - Swedish (%)
Ancestries Reported - Swiss (%)
Ancestries Reported - Ukrainian (%)
Ancestries Reported - United States (%)
Ancestries Reported - Welsh (%)
Ancestries Reported - West Indian (%)
Ancestries Reported - Other (%)
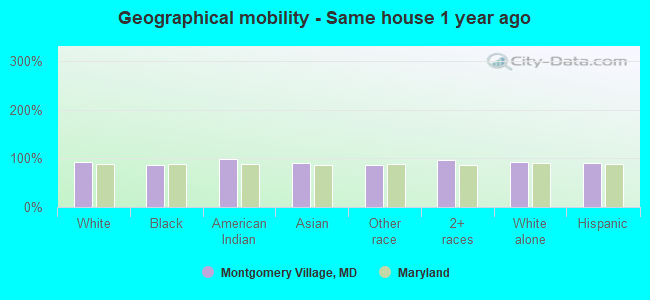
Geographical mobility - Same house 1 year ago (%)
Geographical mobility - Same house 1 year ago (%) - White
Geographical mobility - Same house 1 year ago (%) - Black or African American
Geographical mobility - Same house 1 year ago (%) - Asian
Geographical mobility - Same house 1 year ago (%) - Hispanic or Latino
Geographical mobility - Same house 1 year ago (%) - American Indian and Alaska Native
Geographical mobility - Same house 1 year ago (%) - Multirace
Geographical mobility - Same house 1 year ago (%) - Other Race
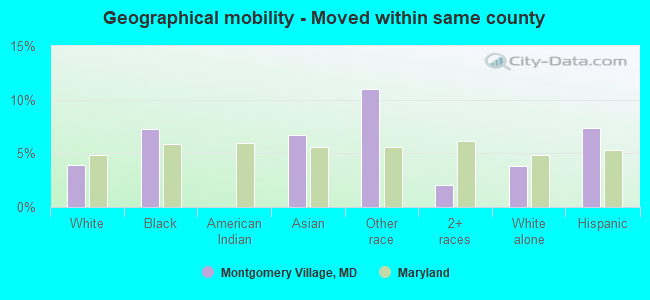
Geographical mobility - Moved within same county (%)
Geographical mobility - Moved within same county (%) - White
Geographical mobility - Moved within same county (%) - Black or African American
Geographical mobility - Moved within same county (%) - Asian
Geographical mobility - Moved within same county (%) - Hispanic or Latino
Geographical mobility - Moved within same county (%) - American Indian and Alaska Native
Geographical mobility - Moved within same county (%) - Multirace
Geographical mobility - Moved within same county (%) - Other Race
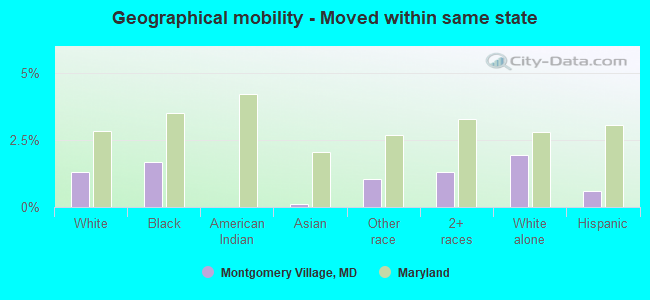
Geographical mobility - Moved from different county within same state (%)
Geographical mobility - Moved from different county within same state (%) - White
Geographical mobility - Moved from different county within same state (%) - Black or African American
Geographical mobility - Moved from different county within same state (%) - Asian
Geographical mobility - Moved from different county within same state (%) - Hispanic or Latino
Geographical mobility - Moved from different county within same state (%) - American Indian and Alaska Native
Geographical mobility - Moved from different county within same state (%) - Multirace
Geographical mobility - Moved from different county within same state (%) - Other Race
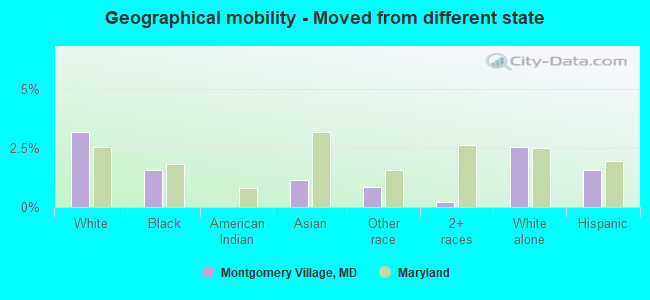
Geographical mobility - Moved from different state (%)
Geographical mobility - Moved from different state (%) - White
Geographical mobility - Moved from different state (%) - Black or African American
Geographical mobility - Moved from different state (%) - Asian
Geographical mobility - Moved from different state (%) - Hispanic or Latino
Geographical mobility - Moved from different state (%) - American Indian and Alaska Native
Geographical mobility - Moved from different state (%) - Multirace
Geographical mobility - Moved from different state (%) - Other Race
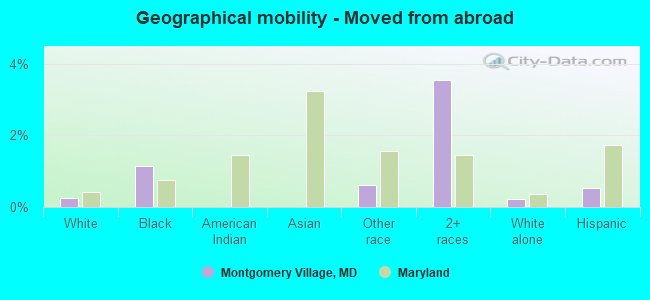
Geographical mobility - Moved from abroad (%)
Geographical mobility - Moved from abroad (%) - White
Geographical mobility - Moved from abroad (%) - Black or African American
Geographical mobility - Moved from abroad (%) - Asian
Geographical mobility - Moved from abroad (%) - Hispanic or Latino
Geographical mobility - Moved from abroad (%) - American Indian and Alaska Native
Geographical mobility - Moved from abroad (%) - Multirace
Geographical mobility - Moved from abroad (%) - Other Race
Place of birth for the foreign-born population - Ireland (%)
Place of birth for the foreign-born population - Denmark (%)
Place of birth for the foreign-born population - Norway (%)
Place of birth for the foreign-born population - Sweden (%)
Place of birth for the foreign-born population - United Kingdom (%)
Place of birth for the foreign-born population - England (%)
Place of birth for the foreign-born population - Scotland (%)
Place of birth for the foreign-born population - Other Northern Europe (%)
Place of birth for the foreign-born population - Austria (%)
Place of birth for the foreign-born population - Belgium (%)
Place of birth for the foreign-born population - France (%)
Place of birth for the foreign-born population - Germany (%)
Place of birth for the foreign-born population - Netherlands (%)
Place of birth for the foreign-born population - Switzerland (%)
Place of birth for the foreign-born population - Other Western Europe (%)
Place of birth for the foreign-born population - Greece (%)
Place of birth for the foreign-born population - Italy (%)
Place of birth for the foreign-born population - Portugal (%)
Place of birth for the foreign-born population - Spain (%)
Place of birth for the foreign-born population - Other Southern Europe (%)
Place of birth for the foreign-born population - Albania (%)
Place of birth for the foreign-born population - Belarus (%)
Place of birth for the foreign-born population - Bosnia and Herzegovina (%)
Place of birth for the foreign-born population - Bulgaria (%)
Place of birth for the foreign-born population - Croatia (%)
Place of birth for the foreign-born population - Czechoslovakia (%)
Place of birth for the foreign-born population - Hungary (%)
Place of birth for the foreign-born population - Latvia (%)
Place of birth for the foreign-born population - Lithuania (%)
Place of birth for the foreign-born population - North Macedonia (Macedonia) (%)
Place of birth for the foreign-born population - Moldova (%)
Place of birth for the foreign-born population - Poland (%)
Place of birth for the foreign-born population - Romania (%)
Place of birth for the foreign-born population - Russia (%)
Place of birth for the foreign-born population - Serbia (%)
Place of birth for the foreign-born population - Ukraine (%)
Place of birth for the foreign-born population - Other Eastern Europe (%)
Place of birth for the foreign-born population - China (%)
Place of birth for the foreign-born population - Hong Kong (%)
Place of birth for the foreign-born population - Taiwan (%)
Place of birth for the foreign-born population - Japan (%)
Place of birth for the foreign-born population - Korea (%)
Place of birth for the foreign-born population - Other Eastern Asia (%)
Place of birth for the foreign-born population - Afghanistan (%)
Place of birth for the foreign-born population - Bangladesh (%)
Place of birth for the foreign-born population - India (%)
Place of birth for the foreign-born population - Iran (%)
Place of birth for the foreign-born population - Kazakhstan (%)
Place of birth for the foreign-born population - Nepal (%)
Place of birth for the foreign-born population - Pakistan (%)
Place of birth for the foreign-born population - Sri Lanka (%)
Place of birth for the foreign-born population - Uzbekistan (%)
Place of birth for the foreign-born population - Other South Central Asia (%)
Place of birth for the foreign-born population - Burma (%)
Place of birth for the foreign-born population - Cambodia (%)
Place of birth for the foreign-born population - Indonesia (%)
Place of birth for the foreign-born population - Laos (%)
Place of birth for the foreign-born population - Malaysia (%)
Place of birth for the foreign-born population - Philippines (%)
Place of birth for the foreign-born population - Singapore (%)
Place of birth for the foreign-born population - Thailand (%)
Place of birth for the foreign-born population - Vietnam (%)
Place of birth for the foreign-born population - Other South Eastern Asia (%)
Place of birth for the foreign-born population - Armenia (%)
Place of birth for the foreign-born population - Iraq (%)
Place of birth for the foreign-born population - Israel (%)
Place of birth for the foreign-born population - Jordan (%)
Place of birth for the foreign-born population - Kuwait (%)
Place of birth for the foreign-born population - Lebanon (%)
Place of birth for the foreign-born population - Saudi Arabia (%)
Place of birth for the foreign-born population - Syria (%)
Place of birth for the foreign-born population - Turkey (%)
Place of birth for the foreign-born population - Yemen (%)
Place of birth for the foreign-born population - Other Western Asia (%)
Place of birth for the foreign-born population - Eritrea (%)
Place of birth for the foreign-born population - Ethiopia (%)
Place of birth for the foreign-born population - Kenya (%)
Place of birth for the foreign-born population - Somalia (%)
Place of birth for the foreign-born population - Uganda (%)
Place of birth for the foreign-born population - Zimbabwe (%)
Place of birth for the foreign-born population - Other Eastern Africa (%)
Place of birth for the foreign-born population - Cameroon (%)
Place of birth for the foreign-born population - Congo (%)
Place of birth for the foreign-born population - Democratic Republic of Congo (Zaire) (%)
Place of birth for the foreign-born population - Other Middle Africa (%)
Place of birth for the foreign-born population - Egypt (%)
Place of birth for the foreign-born population - Morocco (%)
Place of birth for the foreign-born population - Sudan (%)
Place of birth for the foreign-born population - Other Northern Africa (%)
Place of birth for the foreign-born population - South Africa (%)
Place of birth for the foreign-born population - Other Southern Africa (%)
Place of birth for the foreign-born population - Cabo Verde (%)
Place of birth for the foreign-born population - Ghana (%)
Place of birth for the foreign-born population - Liberia (%)
Place of birth for the foreign-born population - Nigeria (%)
Place of birth for the foreign-born population - Senegal (%)
Place of birth for the foreign-born population - Sierra Leone (%)
Place of birth for the foreign-born population - Other Western Africa (%)
Place of birth for the foreign-born population - Australia (%)
Place of birth for the foreign-born population - New Zealand (%)
Place of birth for the foreign-born population - Fiji (%)
Place of birth for the foreign-born population - Micronesia (%)
Place of birth for the foreign-born population - Bahamas (%)
Place of birth for the foreign-born population - Barbados (%)
Place of birth for the foreign-born population - Cuba (%)
Place of birth for the foreign-born population - Dominica (%)
Place of birth for the foreign-born population - Dominican Republic (%)
Place of birth for the foreign-born population - Grenada (%)
Place of birth for the foreign-born population - Haiti (%)
Place of birth for the foreign-born population - Jamaica (%)
Place of birth for the foreign-born population - St. Vincent and the Grenadines (%)
Place of birth for the foreign-born population - Trinidad and Tobago (%)
Place of birth for the foreign-born population - West Indies (%)
Place of birth for the foreign-born population - Other Caribbean (%)
Place of birth for the foreign-born population - Belize (%)
Place of birth for the foreign-born population - Costa Rica (%)
Place of birth for the foreign-born population - El Salvador (%)
Place of birth for the foreign-born population - Guatemala (%)
Place of birth for the foreign-born population - Honduras (%)
Place of birth for the foreign-born population - Mexico (%)
Place of birth for the foreign-born population - Nicaragua (%)
Place of birth for the foreign-born population - Panama (%)
Place of birth for the foreign-born population - Other Central America (%)
Place of birth for the foreign-born population - Argentina (%)
Place of birth for the foreign-born population - Bolivia (%)
Place of birth for the foreign-born population - Brazil (%)
Place of birth for the foreign-born population - Chile (%)
Place of birth for the foreign-born population - Colombia (%)
Place of birth for the foreign-born population - Ecuador (%)
Place of birth for the foreign-born population - Guyana (%)
Place of birth for the foreign-born population - Peru (%)
Place of birth for the foreign-born population - Uruguay (%)
Place of birth for the foreign-born population - Venezuela (%)
Place of birth for the foreign-born population - Other South America (%)
Place of birth for the foreign-born population - Canada (%)
Place of birth for the foreign-born population - Other Northern America (%)
Place of birth for the foreign-born population - Other (%)
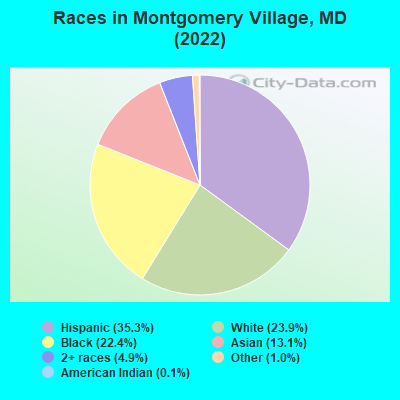
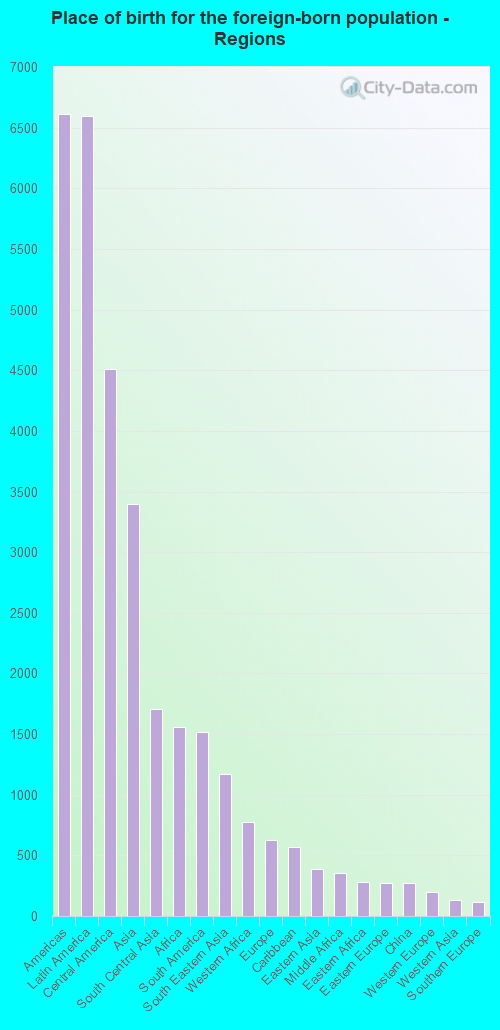
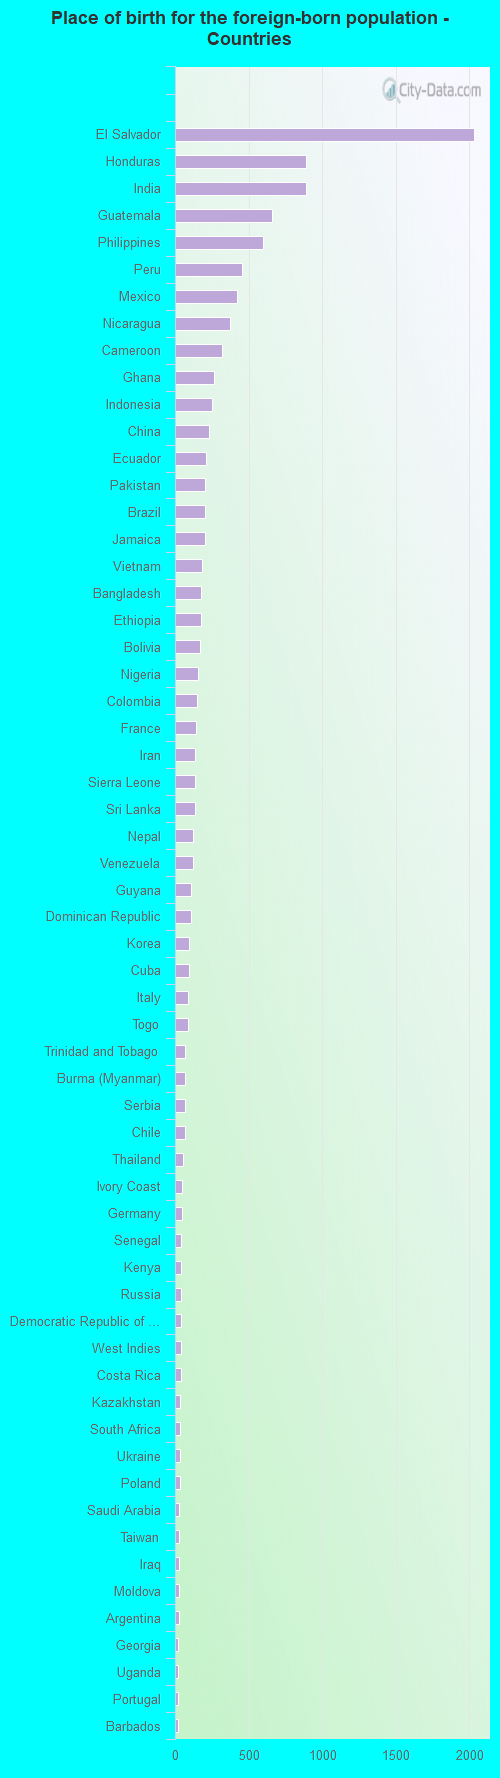
According to 2022 data, the most numerous races in Montgomery Village, MD are White alone (8,261 residents), Black alone (7,760 residents), and Hispanic (12,217 residents). 46.6% of Montgomery Village residents speak English at home. 35.3% of Montgomery Village, MD residents are foreign-born (18.3% born in Latin America, 9.4% born in Asia, 4.3% born in Africa), which is 54.6% greater than the foreign-born rate of 16.0% across the entire state of Maryland.
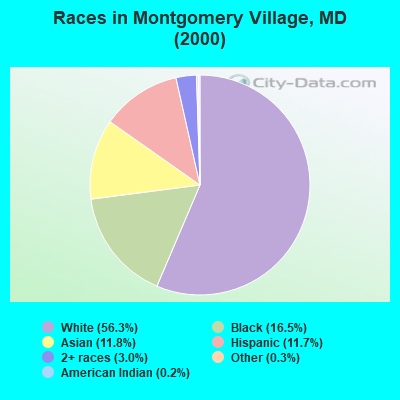
Race distribution in Montgomery Village
2000 2022
21,433 56.3% White alone 6,297 16.5% Black alone 4,494 11.8% Asian alone 4,458 11.7% Hispanic 1,139 3.0% Two or more races 127 0.3% Other race alone 77 0.2% American Indian alone 26 0.07% Native Hawaiian and Other
12,217 35.3% Hispanic 8,261 23.9% White alone 7,760 22.4% Black alone 4,548 13.1% Asian alone 1,693 4.9% Two or more races 330 1.0% Other race alone 43 0.1% American Indian alone
2000 2022
3,286,547 62.1% White alone 1,464,735 27.7% Black alone 227,916 4.3% Hispanic 209,738 4.0% Asian alone 82,946 1.6% Two or more races 13,312 0.3% American Indian alone 9,379 0.2% Other race alone 1,913 0.04% Native Hawaiian and Other
2,906,492 47.1% White alone 1,800,914 29.2% Black alone 705,842 11.4% Hispanic 401,818 6.5% Asian alone 291,317 4.7% Two or more races 46,930 0.8% Other race alone 8,930 0.1% American Indian alone 2,417 0.04% Native Hawaiian and Other
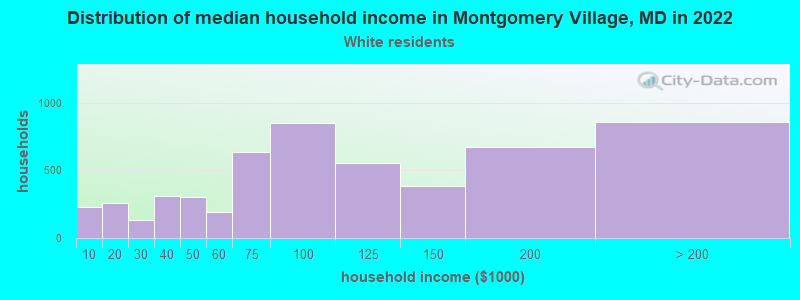
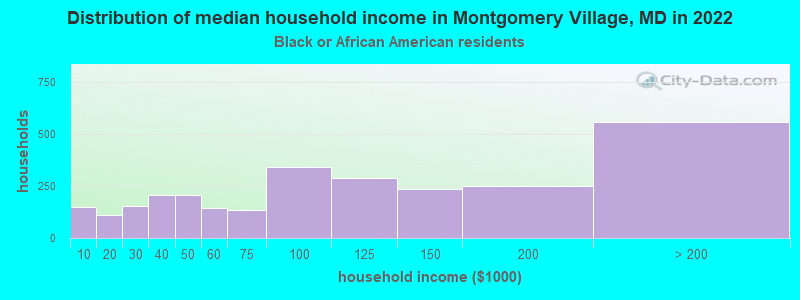
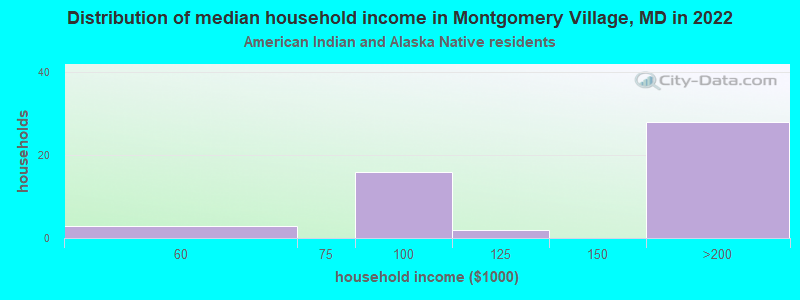
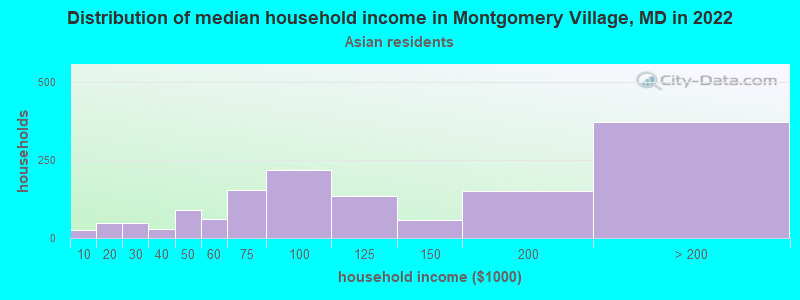
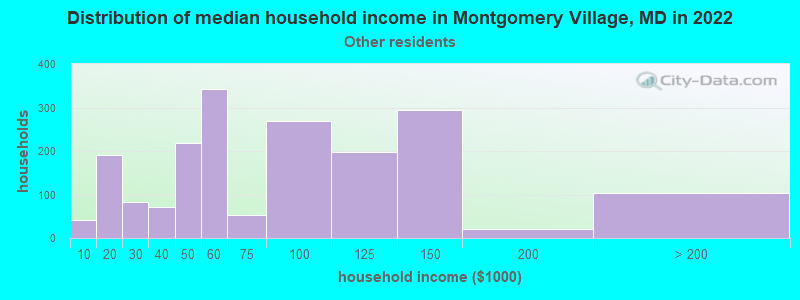
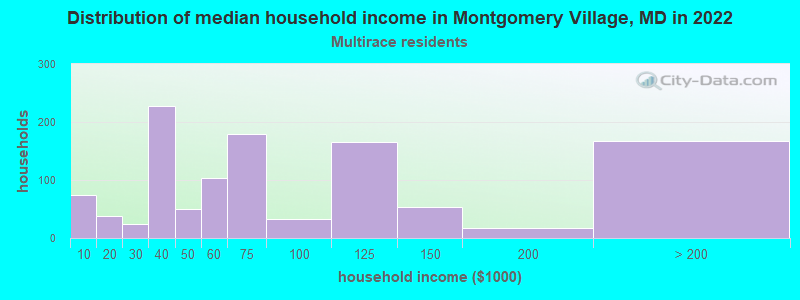
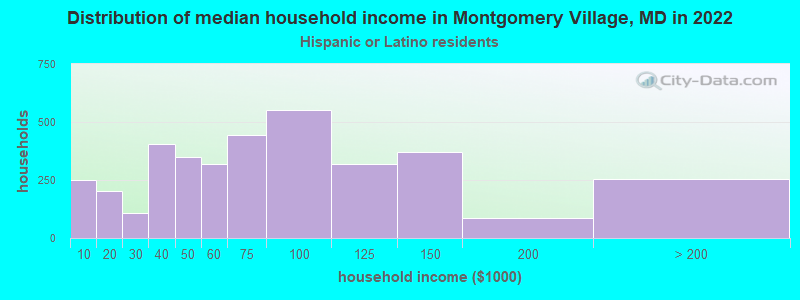
Income and house value in Montgomery Village Median household income in 2022 $104,459 White non-Hispanic householders$92,174 Black householders$102,786 Asian householders$65,585 Some other race householders$61,386 Two or more races householders$68,415 Hispanic or Latino race householdersMedian 2022 house value $416,063 White Non-Hispanic householders$324,311 Black or African American householders$469,628 American Indian or Alaska Native householders $402,804 Asian householders$328,554 Some other race householders$342,874 Two or more races householders$321,659 Hispanic or Latino householders
Median age by race in Montgomery Village
44.8 Median age for White residents44.8 44.2 36.6 Median age for Black or African American residents30.7 43.3 20.1 Median age for American Indian / Alaska Native residents22.5 22.1 42.0 Median age for Asian residents41.0 43.6 -763,333,332.6 Median age for Native Hawaiian / Pacific Islander residents-720,061,021.4 -760,942,760.2 31.5 Median age for Other race residents29.0 34.3 21.7 Median age for Two or more races residents20.7 25.0 54.1 Median age for White alone residents50.9 55.7 31.7 Median age for Hispanic or Latino residents31.7 31.6
Owner/renter occupied households by race in Montgomery Village
House owners and renters - White residents 3,577 67.2% Owner occupied1,745 32.8% Renter occupiedHouse owners and renters - Black or African American residents 1,824 63.7% Owner occupied1,040 36.3% Renter occupiedHouse owners and renters - American Indian / Alaska Native residents 47 95.8% Owner occupied2 4.2% Renter occupiedHouse owners and renters - Asian residents 1,320 88.2% Owner occupied177 11.8% Renter occupiedHouse owners and renters - Other race residents 1,053 56.6% Owner occupied808 43.4% Renter occupiedHouse owners and renters - Two or more races residents 684 65.6% Owner occupied359 34.4% Renter occupiedHouse owners and renters - White alone residents 3,104 70.6% Owner occupied1,293 29.4% Renter occupiedHouse owners and renters - Hispanic or Latino residents 1,825 52.2% Owner occupied1,671 47.8% Renter occupied
Language usage in Montgomery Village
English speakers - Total 46.6% of residents of Montgomery Village speak English at home.
31.2% of residents speak Spanish at home 4,973 50.6% Speak English very well4,860 49.4% Speak English less than very well22.4% of residents speak other language at home 4,134 58.7% Speak English very well2,911 41.3% Speak English less than very well
English speakers - Born in the United States 72.4% of residents of Montgomery Village speak English at home.
13.7% of residents speak Spanish at home 985 68.3% Speak English very well458 31.7% Speak English less than very well11.9% of residents speak other language at home 600 47.8% Speak English very well655 52.2% Speak English less than very well
English speakers - Native, born elsewhere 27.1% of residents of Montgomery Village speak English at home.
68.3% of residents speak Spanish at home 322 77.8% Speak English very well92 22.2% Speak English less than very well4.6% of residents speak other language at home 28 100.0% Speak English very well
English speakers - Foreign-born 11.0% of residents of Montgomery Village speak English at home.
47.6% of residents speak Spanish at home 1,979 34.3% Speak English very well3,785 65.7% Speak English less than very well41.4% of residents speak other language at home 3,013 60.0% Speak English very well2,009 40.0% Speak English less than very well
White (Caucasian) - Speak only English Native:
82.5% (6,670)Foreign-born:
6.6% (162)
White (Caucasian) - Speak another language Native:
14.6% (1,183)Foreign-born:
90.0% (2,201)
Black or African American - Speak only English Native:
85.4% (4,708)Foreign-born:
30.1% (595)
Black or African American - Speak another language Native:
14.8% (813)Foreign-born:
67.9% (1,345)
American Indian / Alaska Native - Speak another language Native:
100.0% (5)Foreign-born:
76.9% (103)
Asian - Speak only English Native:
47.2% (640)Foreign-born:
7.3% (214)
Asian - Speak another language Native:
52.8% (716)Foreign-born:
92.3% (2,706)
Other race - Speak only English Native:
14.1% (389)Foreign-born:
2.4% (78)
Other race - Speak another language Native:
83.3% (2,295)Foreign-born:
97.9% (3,185)
Two or more races - Speak only English Native:
49.6% (1,010)Foreign-born:
18.6% (275)
Two or more races - Speak another language Native:
53.9% (1,096)Foreign-born:
81.9% (1,212)
White alone - Speak only English Native:
88.6% (6,271)Foreign-born:
15.0% (131)
White alone - Speak another language Native:
11.0% (781)Foreign-born:
85.8% (746)
Hispanic or Latino - Speak only English Native:
25.4% (1,282)Foreign-born:
3.1% (183)
Hispanic or Latino - Speak another language Native:
74.0% (3,736)Foreign-born:
97.0% (5,716)
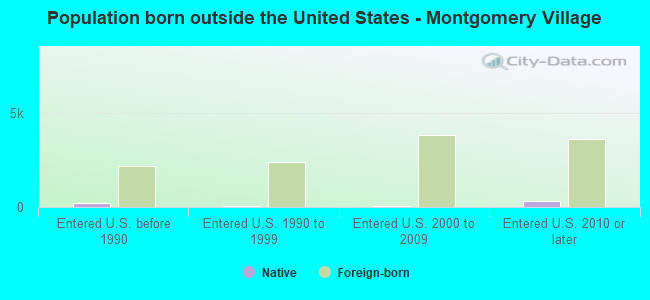
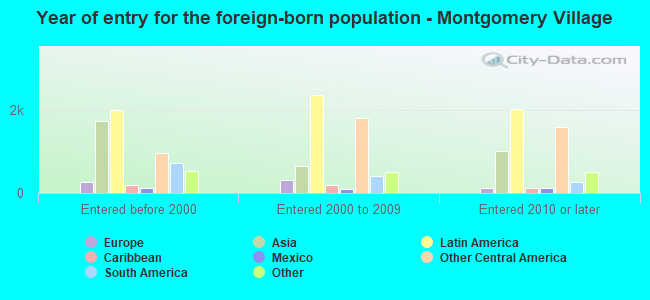
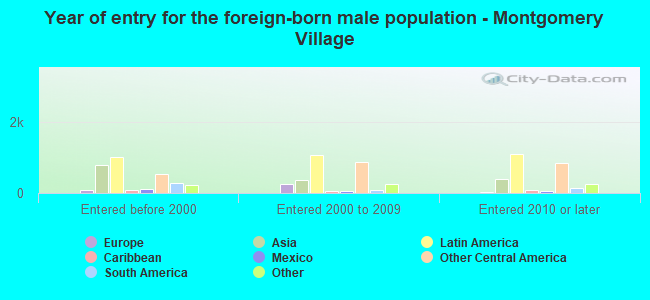
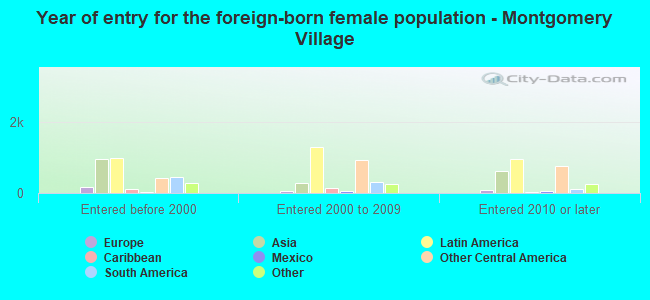
Foreign-born residents in Montgomery Village 12,199 residents are foreign born (18.3% Latin America , 9.4% Asia , 4.3% Africa ).
This city:
35.3%Maryland:
15.7%
Marital status for residents in Montgomery Village Marital status - White (Caucasian) population 15 years and over
Males 32.2% Never married52.9% Now married1.3% Separated1.2% Widowed12.4% DivorcedFemales 27.6% Never married50.8% Now married1.3% Separated9.9% Widowed10.4% DivorcedWomen who gave birth in the past 12 months Now married:
100.0% (132)Unmarried:
0.0% (0)
Women who did not give birth in the past 12 months Now married:
50.4% (1,009)Unmarried:
49.6% (994)
Marital status - Black or African American population 15 years and over
Males 50.3% Never married41.8% Now married1.7% Separated0.3% Widowed5.8% DivorcedFemales 42.7% Never married31.4% Now married4.0% Separated6.4% Widowed15.6% DivorcedWomen who gave birth in the past 12 months Now married:
100.0% (104)Unmarried:
0.0% (0)
Women who did not give birth in the past 12 months Now married:
29.8% (564)Unmarried:
70.2% (1,324)
Marital status - American Indian / Alaska Native population 15 years and over
Males 26.8% Never married73.2% Now married0.0% Separated0.0% Widowed0.0% DivorcedFemales 47.4% Never married52.6% Now married0.0% Separated0.0% Widowed0.0% DivorcedWomen who did not give birth in the past 12 months Now married:
42.9% (22)Unmarried:
57.1% (30)
Marital status - Asian population 15 years and over
Males 25.1% Never married71.7% Now married0.0% Separated1.3% Widowed2.0% DivorcedFemales 25.9% Never married61.1% Now married0.8% Separated5.4% Widowed6.8% DivorcedWomen who gave birth in the past 12 months Now married:
100.0% (51)Unmarried:
0.0% (0)
Women who did not give birth in the past 12 months Now married:
47.8% (534)Unmarried:
52.2% (584)
Marital status - Other race population 15 years and over
Males 43.9% Never married47.7% Now married1.5% Separated0.0% Widowed6.9% DivorcedFemales 29.3% Never married43.4% Now married1.2% Separated8.1% Widowed18.0% DivorcedWomen who gave birth in the past 12 months Now married:
61.6% (153)Unmarried:
38.4% (96)
Women who did not give birth in the past 12 months Now married:
49.6% (640)Unmarried:
50.4% (649)
Marital status - Two or more races population 15 years and over
Males 54.8% Never married30.2% Now married3.8% Separated0.0% Widowed11.2% DivorcedFemales 36.4% Never married45.1% Now married2.8% Separated8.0% Widowed7.6% DivorcedWomen who gave birth in the past 12 months Now married:
17.3% (10)Unmarried:
82.7% (50)
Women who did not give birth in the past 12 months Now married:
43.3% (289)Unmarried:
56.7% (380)
Marital status - White alone, not Hispanic / Latino population 15 years and over
Males 32.6% Never married48.5% Now married1.2% Separated1.7% Widowed15.9% DivorcedFemales 24.4% Never married50.9% Now married0.5% Separated12.2% Widowed12.0% DivorcedWomen who gave birth in the past 12 months Now married:
100.0% (51)Unmarried:
0.0% (0)
Women who did not give birth in the past 12 months Now married:
52.8% (650)Unmarried:
47.2% (581)
Marital status - Hispanic or Latino population 15 years and over
Males 40.3% Never married50.8% Now married2.2% Separated0.0% Widowed6.6% DivorcedFemales 35.4% Never married43.1% Now married3.3% Separated5.9% Widowed12.3% DivorcedWomen who gave birth in the past 12 months Now married:
65.7% (231)Unmarried:
34.3% (121)
Women who did not give birth in the past 12 months Now married:
45.7% (1,233)Unmarried:
54.3% (1,467)
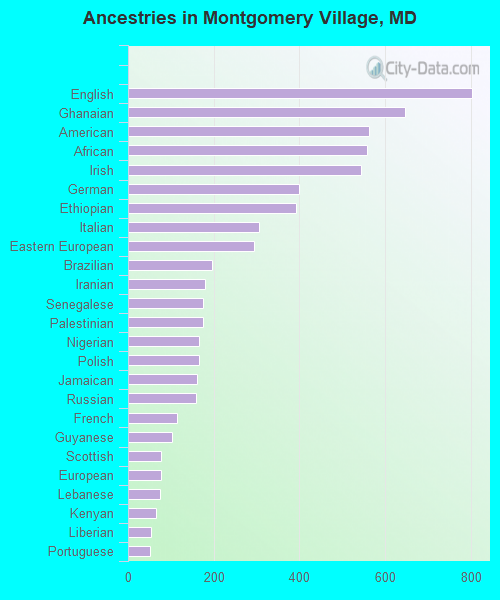
Ancestries in Montgomery Village
802 3.5% English647 2.8% Ghanaian563 2.5% American557 2.4% African544 2.4% Irish398 1.7% German392 1.7% Ethiopian306 1.3% Italian294 1.3% Eastern European195 0.8% Brazilian179 0.8% Iranian175 0.8% Senegalese174 0.8% Palestinian165 0.7% Nigerian165 0.7% Polish160 0.7% Jamaican158 0.7% Russian114 0.5% French103 0.4% Guyanese77 0.3% Scottish76 0.3% European74 0.3% Lebanese65 0.3% Kenyan54 0.2% Liberian51 0.2% Portuguese49 0.2% Romanian47 0.2% Arab43 0.2% Ukrainian42 0.2% Greek41 0.2% Bulgarian40 0.2% South African35 0.2% Turkish31 0.1% Haitian31 0.1% West Indian24 0.1% Dutch24 0.1% Scotch-Irish19 0.08% Trinidadian and Tobagonian18 0.08% Lithuanian17 0.07% Armenian15 0.07% Czech15 0.07% Swedish14 0.06% Egyptian10 0.04% Hungarian10 0.04% Ugandan9 0.04% Bermudan6 0.03% Czechoslovakian6 0.03% Canadian6 0.03% British West Indian4 0.02% Israeli3 0.01% French Canadian3 0.01% Croatian2 0.01% Moroccan
Geographical mobility in Montgomery Village Same house 1 year ago 10,262 91.5% White (Caucasian)6,885 86.5% Black or African American231 98.9% American Indian / Alaska Native4,108 90.7% Asian5,837 87.0% Other race3,861 96.1% Two or more races7,483 91.5% White alone, not Hispanic / Latino10,784 90.1% Hispanic or LatinoMoved within same county 441 3.9% White / Caucasian578 7.3% Black or African American304 6.7% Asian741 11.0% Other race82 2.0% Two or more races310 3.8% White alone, not Hispanic / Latino875 7.3% Hispanic or LatinoMoved within same state 146 1.3% White / Caucasian132 1.7% Black or African American5 0.1% Asian71 1.1% Other race52 1.3% Two or more races159 1.9% White alone, not Hispanic / Latino71 0.6% Hispanic or LatinoMoved from different state 356 3.2% White / Caucasian124 1.6% Black or African American52 1.2% Asian57 0.9% Other race8 0.2% Two or more races208 2.5% White alone, not Hispanic / Latino186 1.6% Hispanic or LatinoMoved from abroad 27 0.2% White91 1.1% Black or African American42 0.6% Other race143 3.6% Two or more races18 0.2% White alone, not Hispanic / Latino65 0.5% Hispanic or Latino
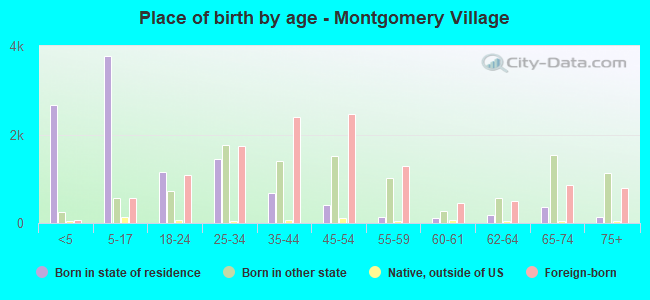
Children Nativity (place of birth) in Montgomery Village
Children under 6 years - Living with two parents Both parents native 840 100.0% NativeBoth parents foreign-born 952 98.3% Native17 1.7% Foreign-bornOne native, one foreign-born parent 458 100.0% NativeChildren under 6 years - Living with one parent Native parent 630 100.0% NativeForeign-born parent 379 88.4% Native50 11.6% Foreign-bornChildren 6 to 17 years - Living with two parents Both parents native 978 99.9% Native1 0.1% Foreign-bornBoth parents foreign-born 1,282 80.9% Native302 19.1% Foreign-bornOne native, one foreign-born parent 313 100.0% NativeChildren 6 to 17 years - Living with one parent Native parent 733 100.0% NativeForeign-born parent 663 57.8% Native484 42.2% Foreign-born
Place of birth for residents in Montgomery Village
Grandparents responsible for own grandchildren in Montgomery Village
Grandparents (30 to 59 years) White / Caucasian 161 61.7% Responsible for grandchildren100 38.3% Not responsible for grandchildrenBlack or African American 10 23.7% Responsible for grandchildren32 76.3% Not responsible for grandchildrenAsian 26 100.0% Not responsible for grandchildrenOther race 36 100.0% Not responsible for grandchildrenTwo or more races 23 62.1% Responsible for grandchildren14 37.9% Not responsible for grandchildrenWhite alone, not Hispanic / Latino 149 79.7% Responsible for grandchildren38 20.3% Not responsible for grandchildrenHispanic or Latino 51 31.8% Responsible for grandchildren110 68.2% Not responsible for grandchildrenGrandparents (60 years and over) White / Caucasian 61 24.0% Responsible for grandchildren193 76.0% Not responsible for grandchildrenBlack or African American 142 100.0% Not responsible for grandchildrenAsian 13 7.8% Responsible for grandchildren149 92.2% Not responsible for grandchildrenOther race 159 100.0% Not responsible for grandchildrenTwo or more races 4 100.0% Not responsible for grandchildrenWhite alone, not Hispanic / Latino 50 22.8% Responsible for grandchildren168 77.2% Not responsible for grandchildrenHispanic or Latino 174 100.0% Not responsible for grandchildren