Races in Morristown, Tennessee (TN) Detailed Stats
Data:
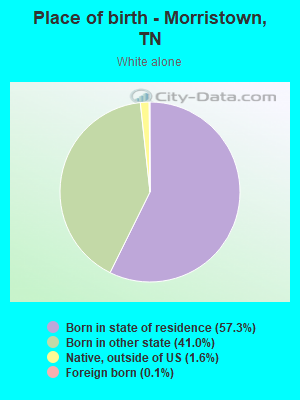
Races - White alone (%)
Races - White alone (% change since 2000)
Races - Black alone (%)
Races - Black alone (% change since 2000)
Races - American Indian alone (%)
Races - American Indian alone (% change since 2000)
Races - Asian alone (%)
Races - Asian alone (% change since 2000)
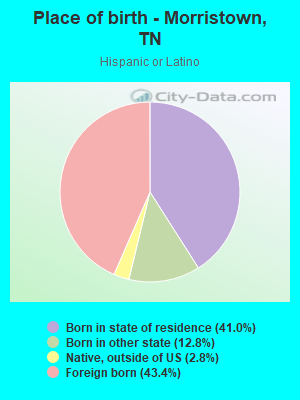
Races - Hispanic (%)
Races - Hispanic (% change since 2000)
Races - Native Hawaiian and Other Pacific Islander alone (%)
Races - Native Hawaiian and Other Pacific Islander alone (% change since 2000)
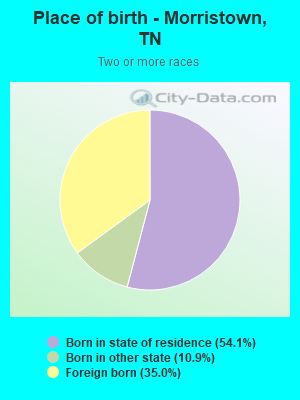
Races - Two or more races(%)
Races - Two or more races(% change since 2000)
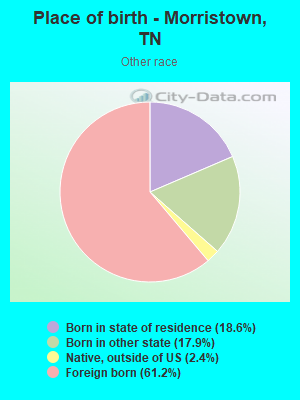
Races - Other race alone (%)
Races - Other race alone (% change since 2000)
Racial diversity
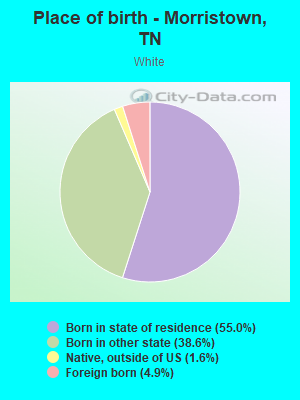
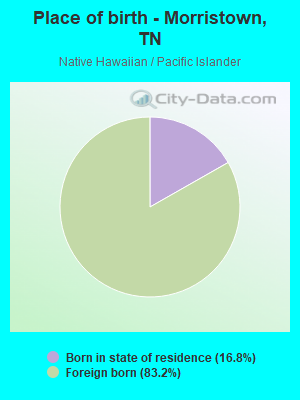
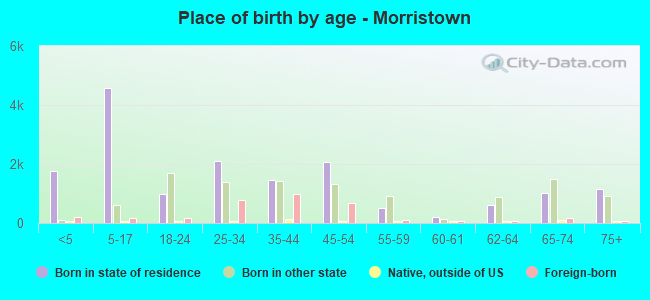
Place of birth - Born in state of residence (%)
Place of birth - Born in state of residence (%) - White
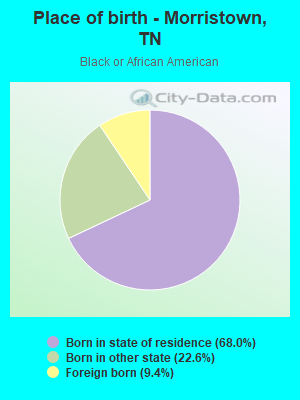
Place of birth - Born in state of residence (%) - Black or African American
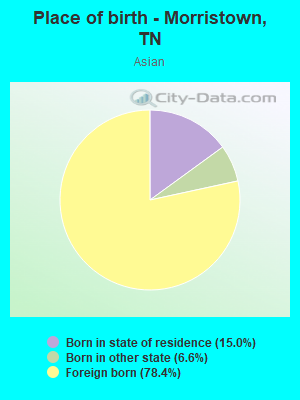
Place of birth - Born in state of residence (%) - Asian
Place of birth - Born in state of residence (%) - Hispanic or Latino
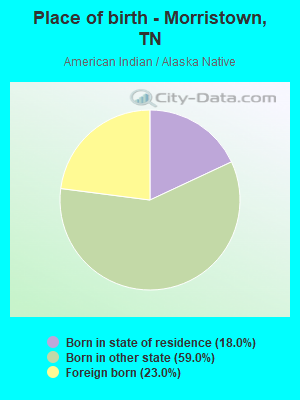
Place of birth - Born in state of residence (%) - American Indian and Alaska Native
Place of birth - Born in state of residence (%) - Multirace
Place of birth - Born in state of residence (%) - Other Race
Place of birth - Born in other state (%)
Place of birth - Born in other state (%) - White
Place of birth - Born in other state (%) - Black or African American
Place of birth - Born in other state (%) - Asian
Place of birth - Born in other state (%) - Hispanic or Latino
Place of birth - Born in other state (%) - American Indian and Alaska Native
Place of birth - Born in other state (%) - Multirace
Place of birth - Born in other state (%) - Other Race
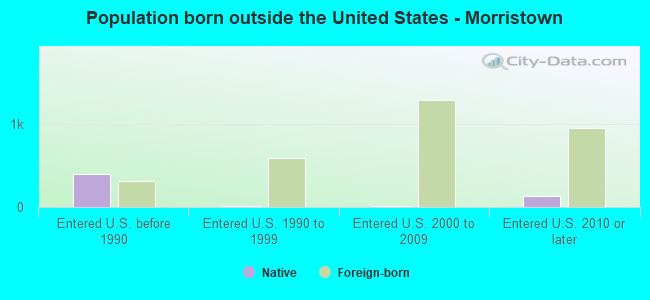
Place of birth - Native, outside of US (%)
Place of birth - Native, outside of US (%) - White
Place of birth - Native, outside of US (%) - Black or African American
Place of birth - Native, outside of US (%) - Asian
Place of birth - Native, outside of US (%) - Hispanic or Latino
Place of birth - Native, outside of US (%) - American Indian and Alaska Native
Place of birth - Native, outside of US (%) - Multirace
Place of birth - Native, outside of US (%) - Other Race
Place of birth - Foreign born (%)
Place of birth - Foreign born (%) - White
Place of birth - Foreign born (%) - Black or African American
Place of birth - Foreign born (%) - Asian
Place of birth - Foreign born (%) - Hispanic or Latino
Place of birth - Foreign born (%) - American Indian and Alaska Native
Place of birth - Foreign born (%) - Multirace
Place of birth - Foreign born (%) - Other Race
Residents speaking English at home (%)
Residents speaking English at home - Born in the United States (%)
Residents speaking English at home - Native, born elsewhere (%)
Residents speaking English at home - Foreign born (%)
Residents speaking Spanish at home (%)
Residents speaking Spanish at home - Born in the United States (%)
Residents speaking Spanish at home - Native, born elsewhere (%)
Residents speaking Spanish at home - Foreign born (%)
Residents speaking other language at home (%)
Residents speaking other language at home - Born in the United States (%)
Residents speaking other language at home - Native, born elsewhere (%)
Residents speaking other language at home - Foreign born (%)
Marital status - Never married (%)
Marital status - Now married (%)
Marital status - Separated (%)
Marital status - Widowed (%)
Marital status - Divorced (%)
Ancestries Reported - Arab (%)
Ancestries Reported - Czech (%)
Ancestries Reported - Danish (%)
Ancestries Reported - Dutch (%)
Ancestries Reported - English (%)
Ancestries Reported - French (%)
Ancestries Reported - French Canadian (%)
Ancestries Reported - German (%)
Ancestries Reported - Greek (%)
Ancestries Reported - Hungarian (%)
Ancestries Reported - Irish (%)
Ancestries Reported - Italian (%)
Ancestries Reported - Lithuanian (%)
Ancestries Reported - Norwegian (%)
Ancestries Reported - Polish (%)
Ancestries Reported - Portuguese (%)
Ancestries Reported - Russian (%)
Ancestries Reported - Scotch-Irish (%)
Ancestries Reported - Scottish (%)
Ancestries Reported - Slovak (%)
Ancestries Reported - Subsaharan African (%)
Ancestries Reported - Swedish (%)
Ancestries Reported - Swiss (%)
Ancestries Reported - Ukrainian (%)
Ancestries Reported - United States (%)
Ancestries Reported - Welsh (%)
Ancestries Reported - West Indian (%)
Ancestries Reported - Other (%)
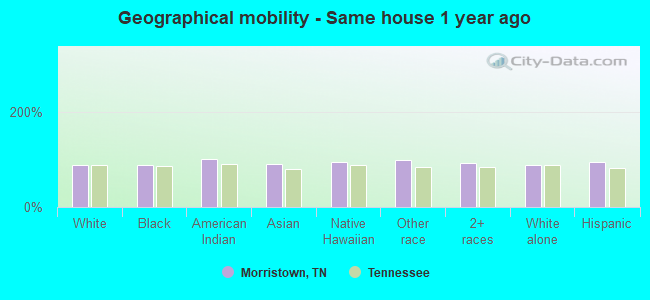
Geographical mobility - Same house 1 year ago (%)
Geographical mobility - Same house 1 year ago (%) - White
Geographical mobility - Same house 1 year ago (%) - Black or African American
Geographical mobility - Same house 1 year ago (%) - Asian
Geographical mobility - Same house 1 year ago (%) - Hispanic or Latino
Geographical mobility - Same house 1 year ago (%) - American Indian and Alaska Native
Geographical mobility - Same house 1 year ago (%) - Multirace
Geographical mobility - Same house 1 year ago (%) - Other Race
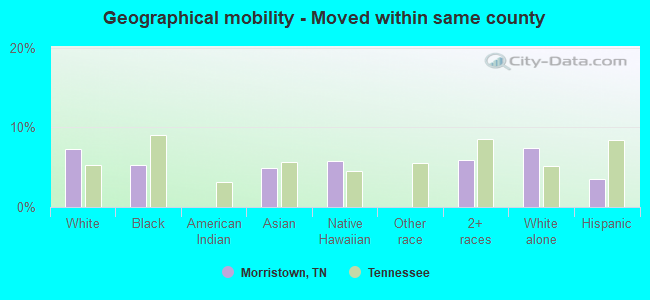
Geographical mobility - Moved within same county (%)
Geographical mobility - Moved within same county (%) - White
Geographical mobility - Moved within same county (%) - Black or African American
Geographical mobility - Moved within same county (%) - Asian
Geographical mobility - Moved within same county (%) - Hispanic or Latino
Geographical mobility - Moved within same county (%) - American Indian and Alaska Native
Geographical mobility - Moved within same county (%) - Multirace
Geographical mobility - Moved within same county (%) - Other Race
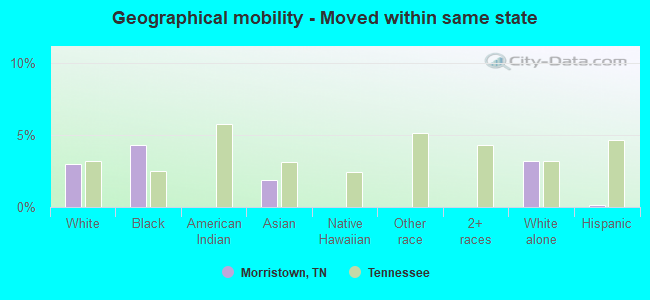
Geographical mobility - Moved from different county within same state (%)
Geographical mobility - Moved from different county within same state (%) - White
Geographical mobility - Moved from different county within same state (%) - Black or African American
Geographical mobility - Moved from different county within same state (%) - Asian
Geographical mobility - Moved from different county within same state (%) - Hispanic or Latino
Geographical mobility - Moved from different county within same state (%) - American Indian and Alaska Native
Geographical mobility - Moved from different county within same state (%) - Multirace
Geographical mobility - Moved from different county within same state (%) - Other Race
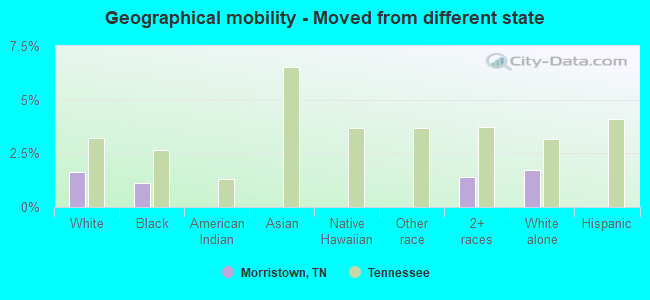
Geographical mobility - Moved from different state (%)
Geographical mobility - Moved from different state (%) - White
Geographical mobility - Moved from different state (%) - Black or African American
Geographical mobility - Moved from different state (%) - Asian
Geographical mobility - Moved from different state (%) - Hispanic or Latino
Geographical mobility - Moved from different state (%) - American Indian and Alaska Native
Geographical mobility - Moved from different state (%) - Multirace
Geographical mobility - Moved from different state (%) - Other Race
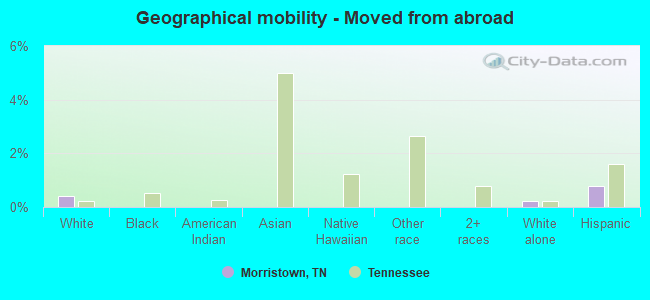
Geographical mobility - Moved from abroad (%)
Geographical mobility - Moved from abroad (%) - White
Geographical mobility - Moved from abroad (%) - Black or African American
Geographical mobility - Moved from abroad (%) - Asian
Geographical mobility - Moved from abroad (%) - Hispanic or Latino
Geographical mobility - Moved from abroad (%) - American Indian and Alaska Native
Geographical mobility - Moved from abroad (%) - Multirace
Geographical mobility - Moved from abroad (%) - Other Race
Place of birth for the foreign-born population - Ireland (%)
Place of birth for the foreign-born population - Denmark (%)
Place of birth for the foreign-born population - Norway (%)
Place of birth for the foreign-born population - Sweden (%)
Place of birth for the foreign-born population - United Kingdom (%)
Place of birth for the foreign-born population - England (%)
Place of birth for the foreign-born population - Scotland (%)
Place of birth for the foreign-born population - Other Northern Europe (%)
Place of birth for the foreign-born population - Austria (%)
Place of birth for the foreign-born population - Belgium (%)
Place of birth for the foreign-born population - France (%)
Place of birth for the foreign-born population - Germany (%)
Place of birth for the foreign-born population - Netherlands (%)
Place of birth for the foreign-born population - Switzerland (%)
Place of birth for the foreign-born population - Other Western Europe (%)
Place of birth for the foreign-born population - Greece (%)
Place of birth for the foreign-born population - Italy (%)
Place of birth for the foreign-born population - Portugal (%)
Place of birth for the foreign-born population - Spain (%)
Place of birth for the foreign-born population - Other Southern Europe (%)
Place of birth for the foreign-born population - Albania (%)
Place of birth for the foreign-born population - Belarus (%)
Place of birth for the foreign-born population - Bosnia and Herzegovina (%)
Place of birth for the foreign-born population - Bulgaria (%)
Place of birth for the foreign-born population - Croatia (%)
Place of birth for the foreign-born population - Czechoslovakia (%)
Place of birth for the foreign-born population - Hungary (%)
Place of birth for the foreign-born population - Latvia (%)
Place of birth for the foreign-born population - Lithuania (%)
Place of birth for the foreign-born population - North Macedonia (Macedonia) (%)
Place of birth for the foreign-born population - Moldova (%)
Place of birth for the foreign-born population - Poland (%)
Place of birth for the foreign-born population - Romania (%)
Place of birth for the foreign-born population - Russia (%)
Place of birth for the foreign-born population - Serbia (%)
Place of birth for the foreign-born population - Ukraine (%)
Place of birth for the foreign-born population - Other Eastern Europe (%)
Place of birth for the foreign-born population - China (%)
Place of birth for the foreign-born population - Hong Kong (%)
Place of birth for the foreign-born population - Taiwan (%)
Place of birth for the foreign-born population - Japan (%)
Place of birth for the foreign-born population - Korea (%)
Place of birth for the foreign-born population - Other Eastern Asia (%)
Place of birth for the foreign-born population - Afghanistan (%)
Place of birth for the foreign-born population - Bangladesh (%)
Place of birth for the foreign-born population - India (%)
Place of birth for the foreign-born population - Iran (%)
Place of birth for the foreign-born population - Kazakhstan (%)
Place of birth for the foreign-born population - Nepal (%)
Place of birth for the foreign-born population - Pakistan (%)
Place of birth for the foreign-born population - Sri Lanka (%)
Place of birth for the foreign-born population - Uzbekistan (%)
Place of birth for the foreign-born population - Other South Central Asia (%)
Place of birth for the foreign-born population - Burma (%)
Place of birth for the foreign-born population - Cambodia (%)
Place of birth for the foreign-born population - Indonesia (%)
Place of birth for the foreign-born population - Laos (%)
Place of birth for the foreign-born population - Malaysia (%)
Place of birth for the foreign-born population - Philippines (%)
Place of birth for the foreign-born population - Singapore (%)
Place of birth for the foreign-born population - Thailand (%)
Place of birth for the foreign-born population - Vietnam (%)
Place of birth for the foreign-born population - Other South Eastern Asia (%)
Place of birth for the foreign-born population - Armenia (%)
Place of birth for the foreign-born population - Iraq (%)
Place of birth for the foreign-born population - Israel (%)
Place of birth for the foreign-born population - Jordan (%)
Place of birth for the foreign-born population - Kuwait (%)
Place of birth for the foreign-born population - Lebanon (%)
Place of birth for the foreign-born population - Saudi Arabia (%)
Place of birth for the foreign-born population - Syria (%)
Place of birth for the foreign-born population - Turkey (%)
Place of birth for the foreign-born population - Yemen (%)
Place of birth for the foreign-born population - Other Western Asia (%)
Place of birth for the foreign-born population - Eritrea (%)
Place of birth for the foreign-born population - Ethiopia (%)
Place of birth for the foreign-born population - Kenya (%)
Place of birth for the foreign-born population - Somalia (%)
Place of birth for the foreign-born population - Uganda (%)
Place of birth for the foreign-born population - Zimbabwe (%)
Place of birth for the foreign-born population - Other Eastern Africa (%)
Place of birth for the foreign-born population - Cameroon (%)
Place of birth for the foreign-born population - Congo (%)
Place of birth for the foreign-born population - Democratic Republic of Congo (Zaire) (%)
Place of birth for the foreign-born population - Other Middle Africa (%)
Place of birth for the foreign-born population - Egypt (%)
Place of birth for the foreign-born population - Morocco (%)
Place of birth for the foreign-born population - Sudan (%)
Place of birth for the foreign-born population - Other Northern Africa (%)
Place of birth for the foreign-born population - South Africa (%)
Place of birth for the foreign-born population - Other Southern Africa (%)
Place of birth for the foreign-born population - Cabo Verde (%)
Place of birth for the foreign-born population - Ghana (%)
Place of birth for the foreign-born population - Liberia (%)
Place of birth for the foreign-born population - Nigeria (%)
Place of birth for the foreign-born population - Senegal (%)
Place of birth for the foreign-born population - Sierra Leone (%)
Place of birth for the foreign-born population - Other Western Africa (%)
Place of birth for the foreign-born population - Australia (%)
Place of birth for the foreign-born population - New Zealand (%)
Place of birth for the foreign-born population - Fiji (%)
Place of birth for the foreign-born population - Micronesia (%)
Place of birth for the foreign-born population - Bahamas (%)
Place of birth for the foreign-born population - Barbados (%)
Place of birth for the foreign-born population - Cuba (%)
Place of birth for the foreign-born population - Dominica (%)
Place of birth for the foreign-born population - Dominican Republic (%)
Place of birth for the foreign-born population - Grenada (%)
Place of birth for the foreign-born population - Haiti (%)
Place of birth for the foreign-born population - Jamaica (%)
Place of birth for the foreign-born population - St. Vincent and the Grenadines (%)
Place of birth for the foreign-born population - Trinidad and Tobago (%)
Place of birth for the foreign-born population - West Indies (%)
Place of birth for the foreign-born population - Other Caribbean (%)
Place of birth for the foreign-born population - Belize (%)
Place of birth for the foreign-born population - Costa Rica (%)
Place of birth for the foreign-born population - El Salvador (%)
Place of birth for the foreign-born population - Guatemala (%)
Place of birth for the foreign-born population - Honduras (%)
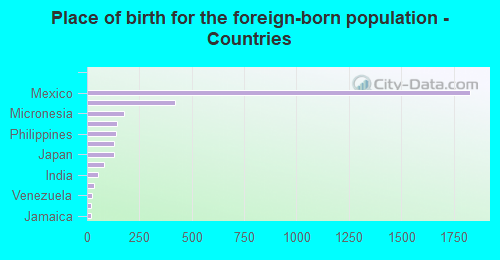
Place of birth for the foreign-born population - Mexico (%)
Place of birth for the foreign-born population - Nicaragua (%)
Place of birth for the foreign-born population - Panama (%)
Place of birth for the foreign-born population - Other Central America (%)
Place of birth for the foreign-born population - Argentina (%)
Place of birth for the foreign-born population - Bolivia (%)
Place of birth for the foreign-born population - Brazil (%)
Place of birth for the foreign-born population - Chile (%)
Place of birth for the foreign-born population - Colombia (%)
Place of birth for the foreign-born population - Ecuador (%)
Place of birth for the foreign-born population - Guyana (%)
Place of birth for the foreign-born population - Peru (%)
Place of birth for the foreign-born population - Uruguay (%)
Place of birth for the foreign-born population - Venezuela (%)
Place of birth for the foreign-born population - Other South America (%)
Place of birth for the foreign-born population - Canada (%)
Place of birth for the foreign-born population - Other Northern America (%)
Place of birth for the foreign-born population - Other (%)
Latest news about races in Morristown, TN collected exclusively by city-data.com from local newspapers, TV, and radio stations
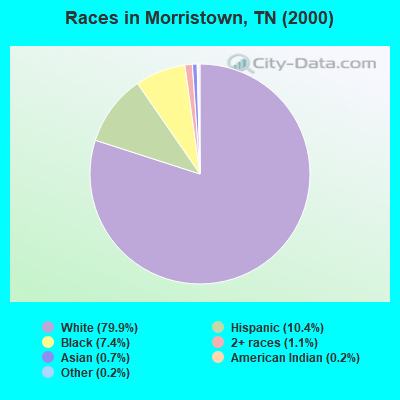
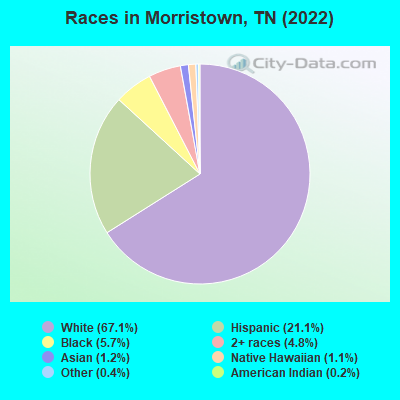
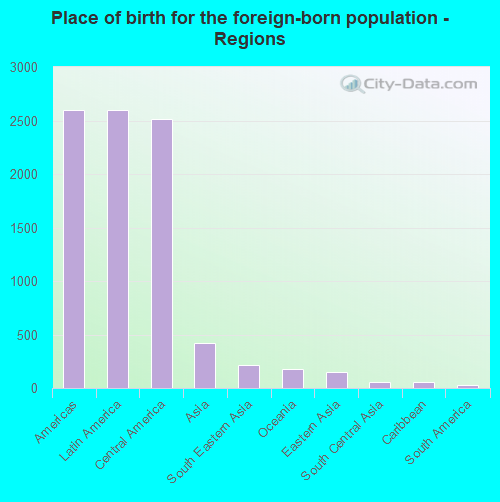
According to 2022 data, the most numerous races in Morristown, TN are White alone (20,891 residents), Black alone (1,776 residents), and Hispanic (6,565 residents). 80.7% of Morristown residents speak English at home. 10.3% of Morristown, TN residents are foreign-born (8.1% born in Latin America, 1.3% born in Asia), which is 51.6% greater than the foreign-born rate of 5.0% across the entire state of Tennessee.
Race distribution in Morristown
2000 2022
4,505,930 79.2% White alone 928,204 16.3% Black alone 123,838 2.2% Hispanic 54,824 1.0% Two or more races 56,077 1.0% Asian alone 13,820 0.2% American Indian alone 4,780 0.08% Other race alone 1,810 0.03% Native Hawaiian and Other
5,070,026 71.9% White alone 1,089,738 15.5% Black alone 442,629 6.3% Hispanic 279,381 4.0% Two or more races 131,817 1.9% Asian alone 26,972 0.4% Other race alone 6,387 0.09% American Indian alone 4,389 0.06% Native Hawaiian and Other
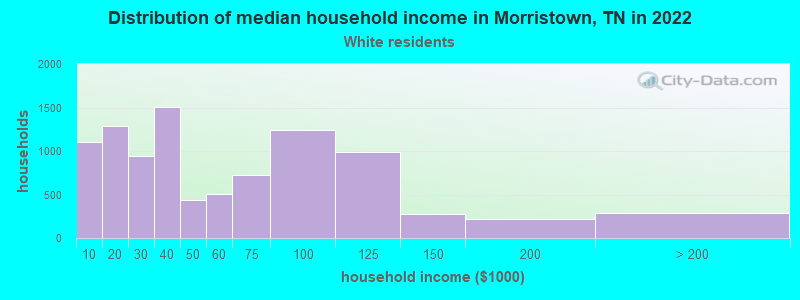
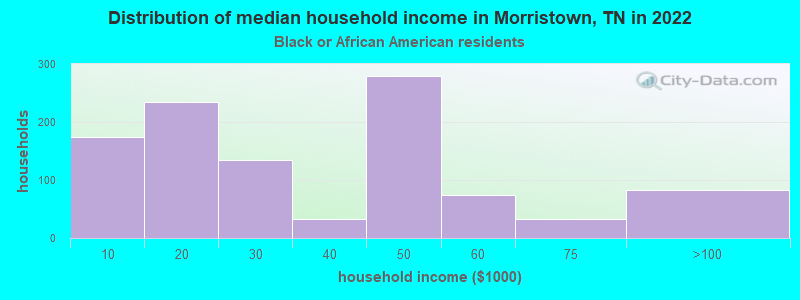
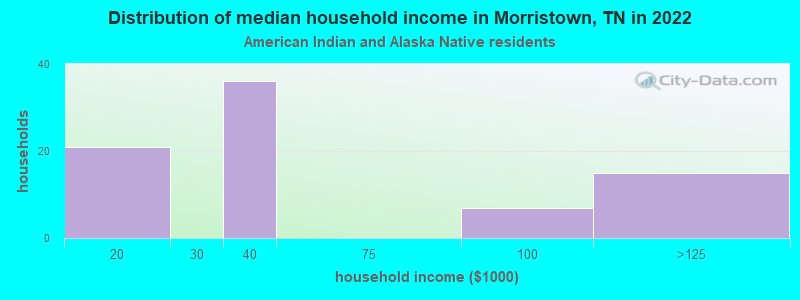
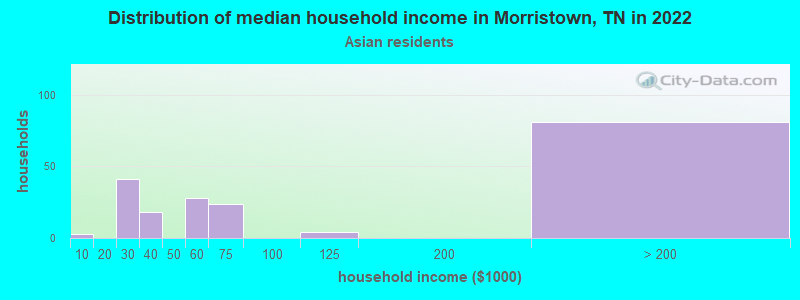
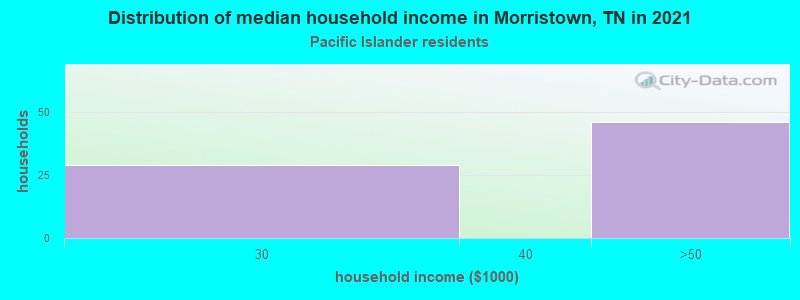
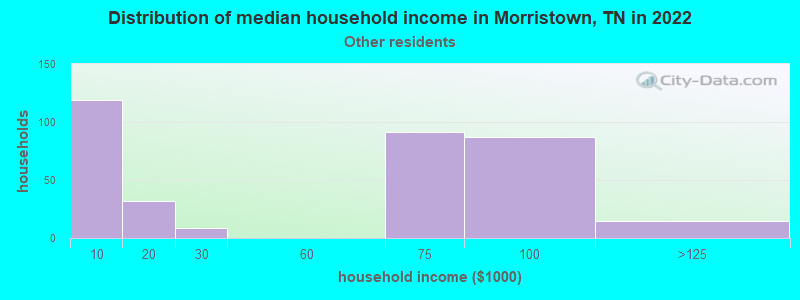
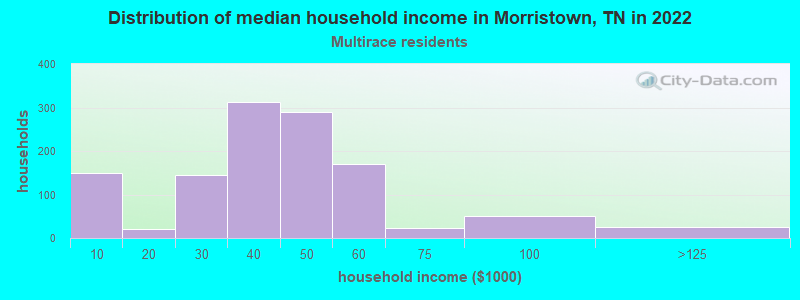
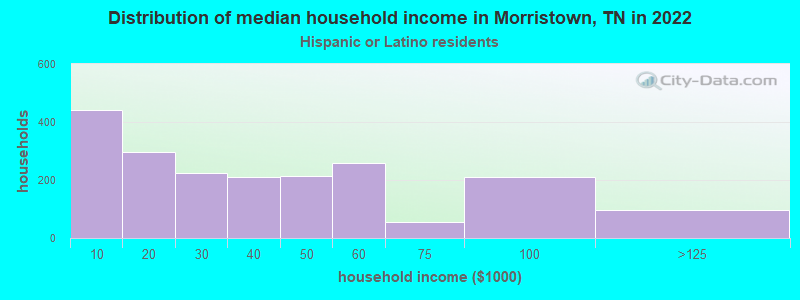
Income and house value in Morristown Median household income in 2022 $49,011 White non-Hispanic householders$24,909 Black householders$35,951 American Indian and Alaska Native householders$49,064 Native Hawaiian and other Pacific Islander householders$34,913 Two or more races householders$31,529 Hispanic or Latino race householdersMedian 2022 house value $175,504 White Non-Hispanic householders$160,899 Black or African American householders$203,518 American Indian or Alaska Native householders over $1,000,000 Asian householders$118,040 Some other race householders$165,687 Two or more races householders$165,927 Hispanic or Latino householders
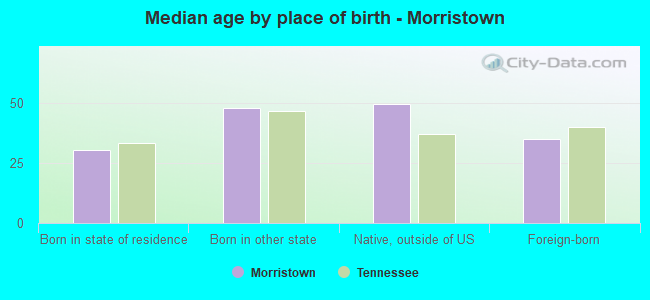
Median age by race in Morristown
42.5 Median age for White residents39.3 44.7 57.6 Median age for Black or African American residents53.2 53.6 36.3 Median age for American Indian / Alaska Native residents36.3 -666,666,666.0 57.5 Median age for Asian residents56.9 37.1 35.2 Median age for Native Hawaiian / Pacific Islander residents49.5 25.9 20.8 Median age for Other race residents25.9 13.3 21.3 Median age for Two or more races residents17.2 21.7 43.8 Median age for White alone residents40.0 44.9 21.0 Median age for Hispanic or Latino residents22.3 21.3
Owner/renter occupied households by race in Morristown
House owners and renters - White residents 5,845 59.3% Owner occupied4,016 40.7% Renter occupiedHouse owners and renters - Black or African American residents 455 43.0% Owner occupied603 57.0% Renter occupiedHouse owners and renters - American Indian / Alaska Native residents 50 51.5% Owner occupied47 48.5% Renter occupiedHouse owners and renters - Asian residents 127 64.5% Owner occupied70 35.5% Renter occupiedHouse owners and renters - Native Hawaiian / Pacific Islander residents 100 100.0% Renter occupiedHouse owners and renters - Other race residents 64 10.4% Owner occupied549 89.6% Renter occupiedHouse owners and renters - Two or more races residents 339 52.0% Owner occupied313 48.0% Renter occupiedHouse owners and renters - White alone residents 5,695 59.4% Owner occupied3,890 40.6% Renter occupiedHouse owners and renters - Hispanic or Latino residents 1,042 63.9% Owner occupied588 36.1% Renter occupied
Language usage in Morristown
English speakers - Total 80.7% of residents of Morristown speak English at home.
17.4% of residents speak Spanish at home 2,558 50.3% Speak English very well2,527 49.7% Speak English less than very well2.2% of residents speak other language at home 376 58.7% Speak English very well265 41.3% Speak English less than very well
English speakers - Born in the United States 90.1% of residents of Morristown speak English at home.
8.5% of residents speak Spanish at home 726 90.4% Speak English very well77 9.6% Speak English less than very well1.2% of residents speak other language at home 112 100.0% Speak English very well
English speakers - Native, born elsewhere 49.8% of residents of Morristown speak English at home.
53.8% of residents speak Spanish at home 28 9.5% Speak English very well266 90.5% Speak English less than very well
English speakers - Foreign-born 3.7% of residents of Morristown speak English at home.
82.4% of residents speak Spanish at home 578 22.6% Speak English very well1,977 77.4% Speak English less than very well15.8% of residents speak other language at home 248 50.6% Speak English very well242 49.4% Speak English less than very well
White (Caucasian) - Speak only English Native:
95.1% (20,044)Foreign-born:
3.1% (25)
White (Caucasian) - Speak another language Native:
4.3% (907)Foreign-born:
88.3% (716)
Black or African American - Speak only English Native:
96.9% (1,628)Foreign-born:
10.1% (18)
Black or African American - Speak another language Native:
3.2% (54)Foreign-born:
87.9% (160)
American Indian / Alaska Native - Speak another language Native:
72.1% (159)Foreign-born:
100.0% (81)
Asian - Speak only English Native:
41.1% (26)Foreign-born:
11.5% (35)
Asian - Speak another language Native:
59.9% (38)Foreign-born:
88.6% (271)
Native Hawaiian / Pacific Islander - Speak only English Native:
100.0% (22)Foreign-born:
14.5% (43)
Other race - Speak another language Native:
78.2% (568)Foreign-born:
100.0% (536)
Two or more races - Speak another language Native:
45.2% (1,398)Foreign-born:
99.8% (1,250)
White alone - Speak only English Native:
98.6% (19,693)Foreign-born:
96.7% (27)
Hispanic or Latino - Speak another language Native:
85.3% (2,412)Foreign-born:
100.0% (2,651)
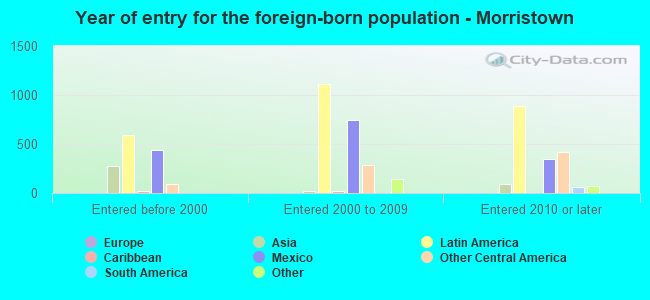
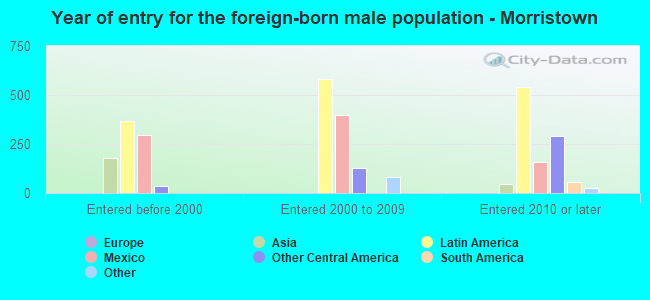
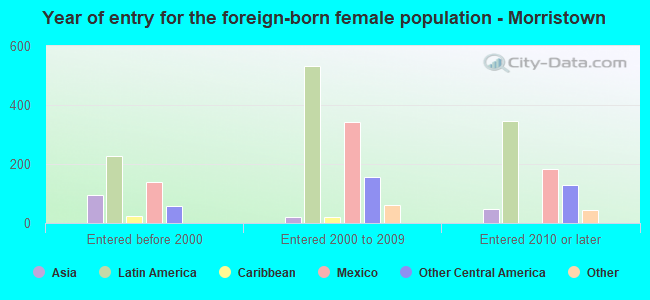
Foreign-born residents in Morristown 3,192 residents are foreign born (8.1% Latin America , 1.3% Asia ).
This city:
10.3%Tennessee:
5.4%
Marital status for residents in Morristown Marital status - White (Caucasian) population 15 years and over
Males 38.3% Never married41.7% Now married2.6% Separated5.1% Widowed12.2% DivorcedFemales 25.1% Never married36.8% Now married2.0% Separated13.0% Widowed23.0% DivorcedWomen who gave birth in the past 12 months Now married:
68.9% (174)Unmarried:
31.1% (79)
Women who did not give birth in the past 12 months Now married:
34.2% (1,600)Unmarried:
65.8% (3,082)
Marital status - Black or African American population 15 years and over
Males 34.3% Never married21.9% Now married0.0% Separated0.0% Widowed43.8% DivorcedFemales 63.3% Never married13.0% Now married1.4% Separated22.3% Widowed0.0% DivorcedWomen who did not give birth in the past 12 months Now married:
11.3% (43)Unmarried:
88.7% (337)
Marital status - American Indian / Alaska Native population 15 years and over
Males 9.2% Never married71.3% Now married0.0% Separated0.0% Widowed19.5% DivorcedFemales 0.0% Never married100.0% Now married0.0% Separated0.0% Widowed0.0% DivorcedWomen who did not give birth in the past 12 months Now married:
100.0% (35)Unmarried:
0.0% (0)
Marital status - Asian population 15 years and over
Males 0.0% Never married95.2% Now married4.8% Separated0.0% Widowed0.0% DivorcedFemales 14.2% Never married79.3% Now married0.0% Separated6.5% Widowed0.0% DivorcedWomen who did not give birth in the past 12 months Now married:
66.0% (97)Unmarried:
34.0% (50)
Marital status - Native Hawaiian / Pacific Islander population 15 years and over
Males 25.9% Never married74.1% Now married0.0% Separated0.0% Widowed0.0% DivorcedFemales 46.0% Never married54.0% Now married0.0% Separated0.0% Widowed0.0% DivorcedWomen who gave birth in the past 12 months Now married:
100.0% (9)Unmarried:
0.0% (0)
Women who did not give birth in the past 12 months Now married:
48.1% (35)Unmarried:
51.9% (37)
Marital status - Other race population 15 years and over
Males 29.2% Never married58.2% Now married0.0% Separated0.0% Widowed12.5% DivorcedFemales 37.0% Never married63.0% Now married0.0% Separated0.0% Widowed0.0% DivorcedWomen who gave birth in the past 12 months Now married:
100.0% (6)Unmarried:
0.0% (0)
Women who did not give birth in the past 12 months Now married:
53.1% (161)Unmarried:
46.9% (142)
Marital status - Two or more races population 15 years and over
Males 45.7% Never married51.7% Now married0.0% Separated0.9% Widowed1.8% DivorcedFemales 63.9% Never married21.7% Now married0.0% Separated0.7% Widowed13.7% DivorcedWomen who did not give birth in the past 12 months Now married:
21.3% (318)Unmarried:
78.7% (1,174)
Marital status - White alone, not Hispanic / Latino population 15 years and over
Males 38.1% Never married41.3% Now married2.9% Separated5.8% Widowed12.0% DivorcedFemales 24.8% Never married35.4% Now married1.8% Separated13.8% Widowed24.2% DivorcedWomen who gave birth in the past 12 months Now married:
66.4% (163)Unmarried:
33.6% (83)
Women who did not give birth in the past 12 months Now married:
32.8% (1,487)Unmarried:
67.2% (3,053)
Marital status - Hispanic or Latino population 15 years and over
Males 32.5% Never married56.3% Now married0.0% Separated0.0% Widowed11.2% DivorcedFemales 45.9% Never married44.5% Now married1.6% Separated0.0% Widowed8.1% DivorcedWomen who gave birth in the past 12 months Now married:
100.0% (27)Unmarried:
0.0% (0)
Women who did not give birth in the past 12 months Now married:
37.2% (630)Unmarried:
62.8% (1,061)
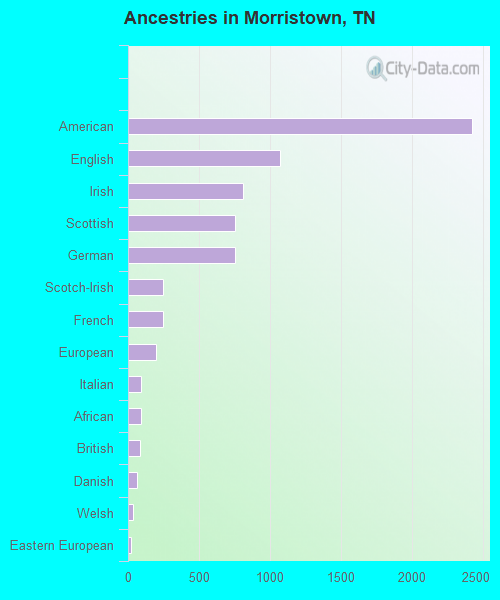
Ancestries in Morristown
2,424 16.1% American1,069 7.1% English814 5.4% Irish754 5.0% Scottish752 5.0% German249 1.7% Scotch-Irish248 1.6% French197 1.3% European94 0.6% Italian93 0.6% African82 0.5% British62 0.4% Danish35 0.2% Welsh24 0.2% Eastern European22 0.1% Belgian20 0.1% Northern European19 0.1% Swedish17 0.1% Dutch16 0.1% Canadian16 0.1% Norwegian15 0.10% Polish9 0.06% Hungarian4 0.03% Russian
Geographical mobility in Morristown Same house 1 year ago 19,051 88.1% White (Caucasian)1,727 89.3% Black or African American307 100.0% American Indian / Alaska Native356 89.6% Asian229 94.8% Native Hawaiian / Pacific Islander1,439 99.0% Other race4,407 92.5% Two or more races17,890 87.7% White alone, not Hispanic / Latino6,134 94.4% Hispanic or LatinoMoved within same county 1,574 7.3% White / Caucasian101 5.2% Black or African American19 4.9% Asian14 5.8% Native Hawaiian / Pacific Islander282 5.9% Two or more races1,518 7.4% White alone, not Hispanic / Latino231 3.6% Hispanic or LatinoMoved within same state 652 3.0% White / Caucasian83 4.3% Black or African American8 1.9% Asian653 3.2% White alone, not Hispanic / Latino11 0.2% Hispanic or LatinoMoved from different state 352 1.6% White / Caucasian22 1.1% Black or African American66 1.4% Two or more races352 1.7% White alone, not Hispanic / LatinoMoved from abroad 86 0.4% White44 0.2% White alone, not Hispanic / Latino50 0.8% Hispanic or Latino
Children Nativity (place of birth) in Morristown
Children under 6 years - Living with two parents Both parents native 599 100.0% NativeBoth parents foreign-born 291 62.6% Native174 37.4% Foreign-bornOne native, one foreign-born parent 96 100.0% NativeChildren under 6 years - Living with one parent Native parent 792 99.9% Native1 0.1% Foreign-bornForeign-born parent 148 86.2% Native24 13.8% Foreign-bornChildren 6 to 17 years - Living with two parents Both parents native 1,383 100.0% NativeBoth parents foreign-born 406 73.7% Native145 26.3% Foreign-bornOne native, one foreign-born parent 195 100.0% NativeChildren 6 to 17 years - Living with one parent Native parent 1,815 100.0% NativeForeign-born parent 663 54.2% Native560 45.8% Foreign-born
Grandparents responsible for own grandchildren in Morristown
Grandparents (30 to 59 years) White / Caucasian 67 46.7% Responsible for grandchildren76 53.3% Not responsible for grandchildrenBlack or African American 43 100.0% Responsible for grandchildrenAmerican Indian / Alaska Native 7 100.0% Responsible for grandchildrenTwo or more races 183 100.0% Responsible for grandchildrenWhite alone, not Hispanic / Latino 67 46.1% Responsible for grandchildren78 53.9% Not responsible for grandchildrenHispanic or Latino 106 100.0% Responsible for grandchildrenGrandparents (60 years and over) White / Caucasian 162 73.2% Responsible for grandchildren59 26.8% Not responsible for grandchildrenBlack or African American 9 100.0% Not responsible for grandchildrenWhite alone, not Hispanic / Latino 164 73.3% Responsible for grandchildren59 26.7% Not responsible for grandchildren