Races in Moses Lake North, Washington (WA) Detailed Stats
Data:
Races - White alone (%)
Races - White alone (% change since 2000)
Races - Black alone (%)
Races - Black alone (% change since 2000)
Races - American Indian alone (%)
Races - American Indian alone (% change since 2000)
Races - Asian alone (%)
Races - Asian alone (% change since 2000)
Races - Hispanic (%)
Races - Hispanic (% change since 2000)
Races - Native Hawaiian and Other Pacific Islander alone (%)
Races - Native Hawaiian and Other Pacific Islander alone (% change since 2000)
Races - Two or more races(%)
Races - Two or more races(% change since 2000)
Races - Other race alone (%)
Races - Other race alone (% change since 2000)
Racial diversity
Place of birth - Born in state of residence (%)
Place of birth - Born in state of residence (%) - White
Place of birth - Born in state of residence (%) - Black or African American
Place of birth - Born in state of residence (%) - Asian
Place of birth - Born in state of residence (%) - Hispanic or Latino
Place of birth - Born in state of residence (%) - American Indian and Alaska Native
Place of birth - Born in state of residence (%) - Multirace
Place of birth - Born in state of residence (%) - Other Race
Place of birth - Born in other state (%)
Place of birth - Born in other state (%) - White
Place of birth - Born in other state (%) - Black or African American
Place of birth - Born in other state (%) - Asian
Place of birth - Born in other state (%) - Hispanic or Latino
Place of birth - Born in other state (%) - American Indian and Alaska Native
Place of birth - Born in other state (%) - Multirace
Place of birth - Born in other state (%) - Other Race
Place of birth - Native, outside of US (%)
Place of birth - Native, outside of US (%) - White
Place of birth - Native, outside of US (%) - Black or African American
Place of birth - Native, outside of US (%) - Asian
Place of birth - Native, outside of US (%) - Hispanic or Latino
Place of birth - Native, outside of US (%) - American Indian and Alaska Native
Place of birth - Native, outside of US (%) - Multirace
Place of birth - Native, outside of US (%) - Other Race
Place of birth - Foreign born (%)
Place of birth - Foreign born (%) - White
Place of birth - Foreign born (%) - Black or African American
Place of birth - Foreign born (%) - Asian
Place of birth - Foreign born (%) - Hispanic or Latino
Place of birth - Foreign born (%) - American Indian and Alaska Native
Place of birth - Foreign born (%) - Multirace
Place of birth - Foreign born (%) - Other Race
Residents speaking English at home (%)
Residents speaking English at home - Born in the United States (%)
Residents speaking English at home - Native, born elsewhere (%)
Residents speaking English at home - Foreign born (%)
Residents speaking Spanish at home (%)
Residents speaking Spanish at home - Born in the United States (%)
Residents speaking Spanish at home - Native, born elsewhere (%)
Residents speaking Spanish at home - Foreign born (%)
Residents speaking other language at home (%)
Residents speaking other language at home - Born in the United States (%)
Residents speaking other language at home - Native, born elsewhere (%)
Residents speaking other language at home - Foreign born (%)
Marital status - Never married (%)
Marital status - Now married (%)
Marital status - Separated (%)
Marital status - Widowed (%)
Marital status - Divorced (%)
Ancestries Reported - Arab (%)
Ancestries Reported - Czech (%)
Ancestries Reported - Danish (%)
Ancestries Reported - Dutch (%)
Ancestries Reported - English (%)
Ancestries Reported - French (%)
Ancestries Reported - French Canadian (%)
Ancestries Reported - German (%)
Ancestries Reported - Greek (%)
Ancestries Reported - Hungarian (%)
Ancestries Reported - Irish (%)
Ancestries Reported - Italian (%)
Ancestries Reported - Lithuanian (%)
Ancestries Reported - Norwegian (%)
Ancestries Reported - Polish (%)
Ancestries Reported - Portuguese (%)
Ancestries Reported - Russian (%)
Ancestries Reported - Scotch-Irish (%)
Ancestries Reported - Scottish (%)
Ancestries Reported - Slovak (%)
Ancestries Reported - Subsaharan African (%)
Ancestries Reported - Swedish (%)
Ancestries Reported - Swiss (%)
Ancestries Reported - Ukrainian (%)
Ancestries Reported - United States (%)
Ancestries Reported - Welsh (%)
Ancestries Reported - West Indian (%)
Ancestries Reported - Other (%)
Geographical mobility - Same house 1 year ago (%)
Geographical mobility - Same house 1 year ago (%) - White
Geographical mobility - Same house 1 year ago (%) - Black or African American
Geographical mobility - Same house 1 year ago (%) - Asian
Geographical mobility - Same house 1 year ago (%) - Hispanic or Latino
Geographical mobility - Same house 1 year ago (%) - American Indian and Alaska Native
Geographical mobility - Same house 1 year ago (%) - Multirace
Geographical mobility - Same house 1 year ago (%) - Other Race
Geographical mobility - Moved within same county (%)
Geographical mobility - Moved within same county (%) - White
Geographical mobility - Moved within same county (%) - Black or African American
Geographical mobility - Moved within same county (%) - Asian
Geographical mobility - Moved within same county (%) - Hispanic or Latino
Geographical mobility - Moved within same county (%) - American Indian and Alaska Native
Geographical mobility - Moved within same county (%) - Multirace
Geographical mobility - Moved within same county (%) - Other Race
Geographical mobility - Moved from different county within same state (%)
Geographical mobility - Moved from different county within same state (%) - White
Geographical mobility - Moved from different county within same state (%) - Black or African American
Geographical mobility - Moved from different county within same state (%) - Asian
Geographical mobility - Moved from different county within same state (%) - Hispanic or Latino
Geographical mobility - Moved from different county within same state (%) - American Indian and Alaska Native
Geographical mobility - Moved from different county within same state (%) - Multirace
Geographical mobility - Moved from different county within same state (%) - Other Race
Geographical mobility - Moved from different state (%)
Geographical mobility - Moved from different state (%) - White
Geographical mobility - Moved from different state (%) - Black or African American
Geographical mobility - Moved from different state (%) - Asian
Geographical mobility - Moved from different state (%) - Hispanic or Latino
Geographical mobility - Moved from different state (%) - American Indian and Alaska Native
Geographical mobility - Moved from different state (%) - Multirace
Geographical mobility - Moved from different state (%) - Other Race
Geographical mobility - Moved from abroad (%)
Geographical mobility - Moved from abroad (%) - White
Geographical mobility - Moved from abroad (%) - Black or African American
Geographical mobility - Moved from abroad (%) - Asian
Geographical mobility - Moved from abroad (%) - Hispanic or Latino
Geographical mobility - Moved from abroad (%) - American Indian and Alaska Native
Geographical mobility - Moved from abroad (%) - Multirace
Geographical mobility - Moved from abroad (%) - Other Race
Place of birth for the foreign-born population - Ireland (%)
Place of birth for the foreign-born population - Denmark (%)
Place of birth for the foreign-born population - Norway (%)
Place of birth for the foreign-born population - Sweden (%)
Place of birth for the foreign-born population - United Kingdom (%)
Place of birth for the foreign-born population - England (%)
Place of birth for the foreign-born population - Scotland (%)
Place of birth for the foreign-born population - Other Northern Europe (%)
Place of birth for the foreign-born population - Austria (%)
Place of birth for the foreign-born population - Belgium (%)
Place of birth for the foreign-born population - France (%)
Place of birth for the foreign-born population - Germany (%)
Place of birth for the foreign-born population - Netherlands (%)
Place of birth for the foreign-born population - Switzerland (%)
Place of birth for the foreign-born population - Other Western Europe (%)
Place of birth for the foreign-born population - Greece (%)
Place of birth for the foreign-born population - Italy (%)
Place of birth for the foreign-born population - Portugal (%)
Place of birth for the foreign-born population - Spain (%)
Place of birth for the foreign-born population - Other Southern Europe (%)
Place of birth for the foreign-born population - Albania (%)
Place of birth for the foreign-born population - Belarus (%)
Place of birth for the foreign-born population - Bosnia and Herzegovina (%)
Place of birth for the foreign-born population - Bulgaria (%)
Place of birth for the foreign-born population - Croatia (%)
Place of birth for the foreign-born population - Czechoslovakia (%)
Place of birth for the foreign-born population - Hungary (%)
Place of birth for the foreign-born population - Latvia (%)
Place of birth for the foreign-born population - Lithuania (%)
Place of birth for the foreign-born population - North Macedonia (Macedonia) (%)
Place of birth for the foreign-born population - Moldova (%)
Place of birth for the foreign-born population - Poland (%)
Place of birth for the foreign-born population - Romania (%)
Place of birth for the foreign-born population - Russia (%)
Place of birth for the foreign-born population - Serbia (%)
Place of birth for the foreign-born population - Ukraine (%)
Place of birth for the foreign-born population - Other Eastern Europe (%)
Place of birth for the foreign-born population - China (%)
Place of birth for the foreign-born population - Hong Kong (%)
Place of birth for the foreign-born population - Taiwan (%)
Place of birth for the foreign-born population - Japan (%)
Place of birth for the foreign-born population - Korea (%)
Place of birth for the foreign-born population - Other Eastern Asia (%)
Place of birth for the foreign-born population - Afghanistan (%)
Place of birth for the foreign-born population - Bangladesh (%)
Place of birth for the foreign-born population - India (%)
Place of birth for the foreign-born population - Iran (%)
Place of birth for the foreign-born population - Kazakhstan (%)
Place of birth for the foreign-born population - Nepal (%)
Place of birth for the foreign-born population - Pakistan (%)
Place of birth for the foreign-born population - Sri Lanka (%)
Place of birth for the foreign-born population - Uzbekistan (%)
Place of birth for the foreign-born population - Other South Central Asia (%)
Place of birth for the foreign-born population - Burma (%)
Place of birth for the foreign-born population - Cambodia (%)
Place of birth for the foreign-born population - Indonesia (%)
Place of birth for the foreign-born population - Laos (%)
Place of birth for the foreign-born population - Malaysia (%)
Place of birth for the foreign-born population - Philippines (%)
Place of birth for the foreign-born population - Singapore (%)
Place of birth for the foreign-born population - Thailand (%)
Place of birth for the foreign-born population - Vietnam (%)
Place of birth for the foreign-born population - Other South Eastern Asia (%)
Place of birth for the foreign-born population - Armenia (%)
Place of birth for the foreign-born population - Iraq (%)
Place of birth for the foreign-born population - Israel (%)
Place of birth for the foreign-born population - Jordan (%)
Place of birth for the foreign-born population - Kuwait (%)
Place of birth for the foreign-born population - Lebanon (%)
Place of birth for the foreign-born population - Saudi Arabia (%)
Place of birth for the foreign-born population - Syria (%)
Place of birth for the foreign-born population - Turkey (%)
Place of birth for the foreign-born population - Yemen (%)
Place of birth for the foreign-born population - Other Western Asia (%)
Place of birth for the foreign-born population - Eritrea (%)
Place of birth for the foreign-born population - Ethiopia (%)
Place of birth for the foreign-born population - Kenya (%)
Place of birth for the foreign-born population - Somalia (%)
Place of birth for the foreign-born population - Uganda (%)
Place of birth for the foreign-born population - Zimbabwe (%)
Place of birth for the foreign-born population - Other Eastern Africa (%)
Place of birth for the foreign-born population - Cameroon (%)
Place of birth for the foreign-born population - Congo (%)
Place of birth for the foreign-born population - Democratic Republic of Congo (Zaire) (%)
Place of birth for the foreign-born population - Other Middle Africa (%)
Place of birth for the foreign-born population - Egypt (%)
Place of birth for the foreign-born population - Morocco (%)
Place of birth for the foreign-born population - Sudan (%)
Place of birth for the foreign-born population - Other Northern Africa (%)
Place of birth for the foreign-born population - South Africa (%)
Place of birth for the foreign-born population - Other Southern Africa (%)
Place of birth for the foreign-born population - Cabo Verde (%)
Place of birth for the foreign-born population - Ghana (%)
Place of birth for the foreign-born population - Liberia (%)
Place of birth for the foreign-born population - Nigeria (%)
Place of birth for the foreign-born population - Senegal (%)
Place of birth for the foreign-born population - Sierra Leone (%)
Place of birth for the foreign-born population - Other Western Africa (%)
Place of birth for the foreign-born population - Australia (%)
Place of birth for the foreign-born population - New Zealand (%)
Place of birth for the foreign-born population - Fiji (%)
Place of birth for the foreign-born population - Micronesia (%)
Place of birth for the foreign-born population - Bahamas (%)
Place of birth for the foreign-born population - Barbados (%)
Place of birth for the foreign-born population - Cuba (%)
Place of birth for the foreign-born population - Dominica (%)
Place of birth for the foreign-born population - Dominican Republic (%)
Place of birth for the foreign-born population - Grenada (%)
Place of birth for the foreign-born population - Haiti (%)
Place of birth for the foreign-born population - Jamaica (%)
Place of birth for the foreign-born population - St. Vincent and the Grenadines (%)
Place of birth for the foreign-born population - Trinidad and Tobago (%)
Place of birth for the foreign-born population - West Indies (%)
Place of birth for the foreign-born population - Other Caribbean (%)
Place of birth for the foreign-born population - Belize (%)
Place of birth for the foreign-born population - Costa Rica (%)
Place of birth for the foreign-born population - El Salvador (%)
Place of birth for the foreign-born population - Guatemala (%)
Place of birth for the foreign-born population - Honduras (%)
Place of birth for the foreign-born population - Mexico (%)
Place of birth for the foreign-born population - Nicaragua (%)
Place of birth for the foreign-born population - Panama (%)
Place of birth for the foreign-born population - Other Central America (%)
Place of birth for the foreign-born population - Argentina (%)
Place of birth for the foreign-born population - Bolivia (%)
Place of birth for the foreign-born population - Brazil (%)
Place of birth for the foreign-born population - Chile (%)
Place of birth for the foreign-born population - Colombia (%)
Place of birth for the foreign-born population - Ecuador (%)
Place of birth for the foreign-born population - Guyana (%)
Place of birth for the foreign-born population - Peru (%)
Place of birth for the foreign-born population - Uruguay (%)
Place of birth for the foreign-born population - Venezuela (%)
Place of birth for the foreign-born population - Other South America (%)
Place of birth for the foreign-born population - Canada (%)
Place of birth for the foreign-born population - Other Northern America (%)
Place of birth for the foreign-born population - Other (%)
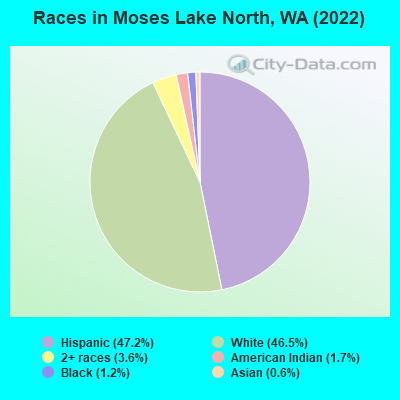
According to 2022 data, the most numerous races in Moses Lake North, WA are White alone (2,354 residents), Hispanic (2,389 residents), and Asian alone (28 residents). 77.2% of Moses Lake North residents speak English at home. 9.4% of Moses Lake North, WA residents are foreign-born (8.3% born in Latin America), which is 59.6% less than the foreign-born rate of 15.0% across the entire state of Washington.
Race distribution in Moses Lake North
2000 2022
4,652,490 78.9% White alone 441,509 7.5% Hispanic 319,401 5.4% Asian alone 184,631 3.1% Black alone 175,926 3.0% Two or more races 85,396 1.4% American Indian alone 22,779 0.4% Native Hawaiian and Other 11,989 0.2% Other race alone
4,941,456 63.5% White alone 1,093,313 14.0% Hispanic 755,832 9.7% Asian alone 523,448 6.7% Two or more races 299,537 3.8% Black alone 69,024 0.9% American Indian alone 52,231 0.7% Native Hawaiian and Other 50,945 0.7% Other race alone
Income and house value in Moses Lake North Median household income in 2022 $47,956 White non-Hispanic householders$72,155 American Indian and Alaska Native householders$25,458 Some other race householders$58,803 Two or more races householdersMedian 2022 house value $241,013 White Non-Hispanic householders$231,150 American Indian or Alaska Native householders $115,575 Asian householders$254,265 Some other race householders$261,970 Two or more races householders$253,957 Hispanic or Latino householders
Median age by race in Moses Lake North
29.3 Median age for White residents30.6 25.8 12.4 Median age for Black or African American residents-684,418,145.3 12.7 87.3 Median age for American Indian / Alaska Native residents109.2 -721,227,620.8 22.7 Median age for Asian residents23.6 -536,945,812.3 -681,388,011.9 Median age for Native Hawaiian / Pacific Islander residents-666,666,666.0 -666,666,666.0 24.1 Median age for Other race residents24.5 24.6 18.7 Median age for Two or more races residents22.5 17.7 41.6 Median age for White alone residents47.3 35.0 20.0 Median age for Hispanic or Latino residents21.9 16.5
Owner/renter occupied households by race in Moses Lake North
House owners and renters - White residents 512 44.1% Owner occupied649 55.9% Renter occupiedHouse owners and renters - American Indian / Alaska Native residents 81 100.0% Renter occupiedHouse owners and renters - Other race residents 27 19.3% Owner occupied115 80.7% Renter occupiedHouse owners and renters - Two or more races residents 32 72.1% Owner occupied12 27.9% Renter occupiedHouse owners and renters - White alone residents 421 43.6% Owner occupied544 56.4% Renter occupiedHouse owners and renters - Hispanic or Latino residents 138 34.8% Owner occupied260 65.2% Renter occupied
Language usage in Moses Lake North
English speakers - Total 77.2% of residents of Moses Lake North speak English at home.
23.6% of residents speak Spanish at home 824 78.9% Speak English very well221 21.1% Speak English less than very well1.2% of residents speak other language at home 37 72.5% Speak English very well14 27.5% Speak English less than very well
English speakers - Born in the United States 72.3% of residents of Moses Lake North speak English at home.
30.4% of residents speak Spanish at home 414 97.0% Speak English very well13 3.0% Speak English less than very well
English speakers - Native, born elsewhere 14.3% of residents of Moses Lake North speak English at home.
71.4% of residents speak other language at home 5 100.0% Speak English less than very well
English speakers - Foreign-born 0.0% of residents of Moses Lake North speak English at home.
87.6% of residents speak Spanish at home 168 44.1% Speak English very well213 55.9% Speak English less than very well5.7% of residents speak other language at home 14 56.0% Speak English very well11 44.0% Speak English less than very well
White (Caucasian) - Speak another language Native:
7.9% (256)Foreign-born:
77.5% (95)
Asian - Speak another language Native:
92.3% (10)Foreign-born:
99.2% (16)
Other race - Speak another language Native:
52.7% (146)Foreign-born:
98.9% (232)
White alone - Speak another language Native:
1.7% (38)Foreign-born:
100.0% (24)
Hispanic or Latino - Speak another language Native:
43.4% (629)Foreign-born:
97.3% (394)
Foreign-born residents in Moses Lake North 476 residents are foreign born (8.3% Latin America ).
This city:
9.4%Washington:
14.9%
Marital status for residents in Moses Lake North Marital status - White (Caucasian) population 15 years and over
Males 46.4% Never married32.3% Now married0.0% Separated6.6% Widowed14.8% DivorcedFemales 31.6% Never married41.1% Now married7.3% Separated8.3% Widowed11.7% DivorcedWomen who gave birth in the past 12 months Now married:
65.7% (65)Unmarried:
34.3% (34)
Women who did not give birth in the past 12 months Now married:
43.8% (360)Unmarried:
56.2% (462)
Marital status - American Indian / Alaska Native population 15 years and over
Males 12.7% Never married0.0% Now married0.0% Separated67.6% Widowed19.7% DivorcedFemales 100.0% Never married0.0% Now married0.0% Separated0.0% Widowed0.0% DivorcedWomen who gave birth in the past 12 months Now married:
0.0% (0)Unmarried:
100.0% (21)
Marital status - Other race population 15 years and over
Males 49.4% Never married44.8% Now married0.0% Separated0.0% Widowed5.8% DivorcedFemales 39.9% Never married33.3% Now married0.0% Separated17.1% Widowed9.7% DivorcedWomen who did not give birth in the past 12 months Now married:
32.2% (47)Unmarried:
67.8% (99)
Marital status - Two or more races population 15 years and over
Males 44.4% Never married55.6% Now married0.0% Separated0.0% Widowed0.0% DivorcedFemales 83.9% Never married0.0% Now married0.0% Separated0.0% Widowed16.1% DivorcedWomen who did not give birth in the past 12 months Now married:
0.0% (0)Unmarried:
100.0% (83)
Marital status - White alone, not Hispanic / Latino population 15 years and over
Males 38.8% Never married35.5% Now married0.0% Separated8.7% Widowed16.9% DivorcedFemales 21.4% Never married57.0% Now married2.7% Separated4.8% Widowed14.0% DivorcedWomen who gave birth in the past 12 months Now married:
65.7% (70)Unmarried:
34.3% (36)
Women who did not give birth in the past 12 months Now married:
56.3% (266)Unmarried:
43.7% (206)
Marital status - Hispanic or Latino population 15 years and over
Males 61.1% Never married31.7% Now married0.0% Separated0.0% Widowed7.3% DivorcedFemales 49.7% Never married17.4% Now married10.1% Separated15.1% Widowed7.7% DivorcedWomen who did not give birth in the past 12 months Now married:
28.5% (176)Unmarried:
71.5% (440)
Ancestries in Moses Lake North
172 8.7% German129 6.5% English77 3.9% Irish49 2.5% American35 1.8% European20 1.0% French Canadian20 1.0% Norwegian17 0.9% Scandinavian10 0.5% Romanian9 0.5% British7 0.4% Northern European5 0.3% Italian4 0.2% Czech4 0.2% Danish1 0.05% Scottish
Children Nativity (place of birth) in Moses Lake North
Children under 6 years - Living with two parents Both parents native 258 100.0% NativeChildren under 6 years - Living with one parent Native parent 218 100.0% NativeForeign-born parent 53 100.0% NativeChildren 6 to 17 years - Living with two parents Both parents native 270 100.0% NativeBoth parents foreign-born 22 100.0% NativeOne native, one foreign-born parent 17 100.0% NativeChildren 6 to 17 years - Living with one parent Native parent 190 100.0% NativeForeign-born parent 166 47.7% Native182 52.3% Foreign-born
Place of birth for residents in Moses Lake North 428 Americas428 Latin America428 Central America35 Asia32 South Eastern Asia12 Europe12 Eastern Europe3 Eastern Asia3 China
Grandparents responsible for own grandchildren in Moses Lake North
Grandparents (30 to 59 years) White / Caucasian 8 100.0% Responsible for grandchildrenTwo or more races 13 100.0% Responsible for grandchildrenWhite alone, not Hispanic / Latino 8 100.0% Responsible for grandchildrenGrandparents (60 years and over) White / Caucasian 12 19.5% Responsible for grandchildren49 80.5% Not responsible for grandchildrenWhite alone, not Hispanic / Latino 12 46.3% Responsible for grandchildren14 53.7% Not responsible for grandchildren