Races in Mount Airy, North Carolina (NC) Detailed Stats
Data:
Races - White alone (%)
Races - White alone (% change since 2000)
Races - Black alone (%)
Races - Black alone (% change since 2000)
Races - American Indian alone (%)
Races - American Indian alone (% change since 2000)
Races - Asian alone (%)
Races - Asian alone (% change since 2000)
Races - Hispanic (%)
Races - Hispanic (% change since 2000)
Races - Native Hawaiian and Other Pacific Islander alone (%)
Races - Native Hawaiian and Other Pacific Islander alone (% change since 2000)
Races - Two or more races(%)
Races - Two or more races(% change since 2000)
Races - Other race alone (%)
Races - Other race alone (% change since 2000)
Racial diversity
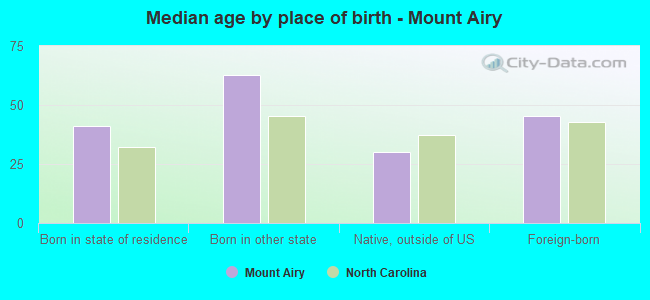
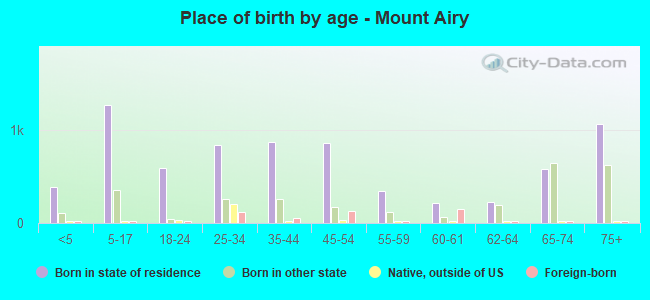
Place of birth - Born in state of residence (%)
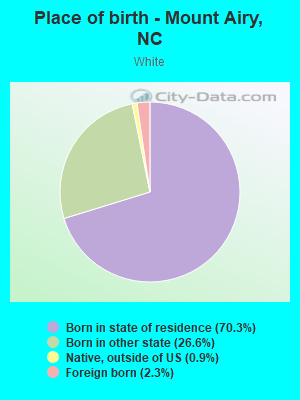
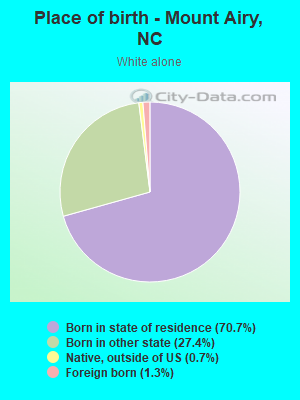
Place of birth - Born in state of residence (%) - White
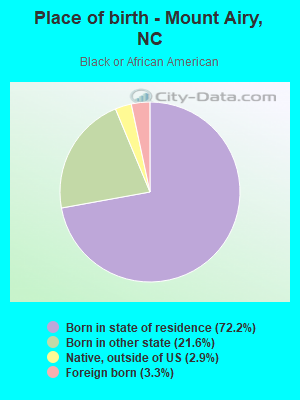
Place of birth - Born in state of residence (%) - Black or African American
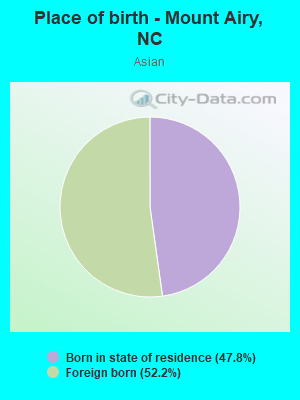
Place of birth - Born in state of residence (%) - Asian
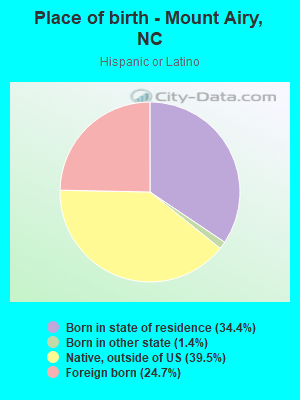
Place of birth - Born in state of residence (%) - Hispanic or Latino
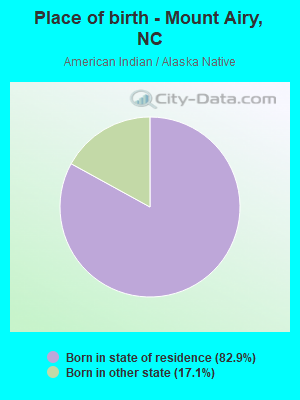
Place of birth - Born in state of residence (%) - American Indian and Alaska Native
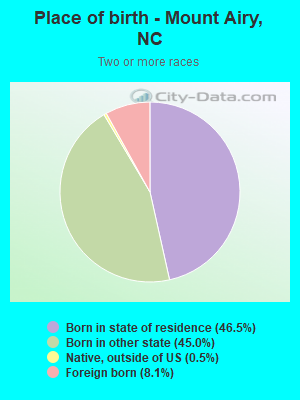
Place of birth - Born in state of residence (%) - Multirace
Place of birth - Born in state of residence (%) - Other Race
Place of birth - Born in other state (%)
Place of birth - Born in other state (%) - White
Place of birth - Born in other state (%) - Black or African American
Place of birth - Born in other state (%) - Asian
Place of birth - Born in other state (%) - Hispanic or Latino
Place of birth - Born in other state (%) - American Indian and Alaska Native
Place of birth - Born in other state (%) - Multirace
Place of birth - Born in other state (%) - Other Race
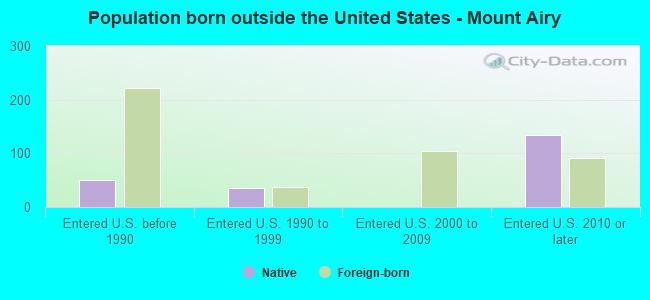
Place of birth - Native, outside of US (%)
Place of birth - Native, outside of US (%) - White
Place of birth - Native, outside of US (%) - Black or African American
Place of birth - Native, outside of US (%) - Asian
Place of birth - Native, outside of US (%) - Hispanic or Latino
Place of birth - Native, outside of US (%) - American Indian and Alaska Native
Place of birth - Native, outside of US (%) - Multirace
Place of birth - Native, outside of US (%) - Other Race
Place of birth - Foreign born (%)
Place of birth - Foreign born (%) - White
Place of birth - Foreign born (%) - Black or African American
Place of birth - Foreign born (%) - Asian
Place of birth - Foreign born (%) - Hispanic or Latino
Place of birth - Foreign born (%) - American Indian and Alaska Native
Place of birth - Foreign born (%) - Multirace
Place of birth - Foreign born (%) - Other Race
Residents speaking English at home (%)
Residents speaking English at home - Born in the United States (%)
Residents speaking English at home - Native, born elsewhere (%)
Residents speaking English at home - Foreign born (%)
Residents speaking Spanish at home (%)
Residents speaking Spanish at home - Born in the United States (%)
Residents speaking Spanish at home - Native, born elsewhere (%)
Residents speaking Spanish at home - Foreign born (%)
Residents speaking other language at home (%)
Residents speaking other language at home - Born in the United States (%)
Residents speaking other language at home - Native, born elsewhere (%)
Residents speaking other language at home - Foreign born (%)
Marital status - Never married (%)
Marital status - Now married (%)
Marital status - Separated (%)
Marital status - Widowed (%)
Marital status - Divorced (%)
Ancestries Reported - Arab (%)
Ancestries Reported - Czech (%)
Ancestries Reported - Danish (%)
Ancestries Reported - Dutch (%)
Ancestries Reported - English (%)
Ancestries Reported - French (%)
Ancestries Reported - French Canadian (%)
Ancestries Reported - German (%)
Ancestries Reported - Greek (%)
Ancestries Reported - Hungarian (%)
Ancestries Reported - Irish (%)
Ancestries Reported - Italian (%)
Ancestries Reported - Lithuanian (%)
Ancestries Reported - Norwegian (%)
Ancestries Reported - Polish (%)
Ancestries Reported - Portuguese (%)
Ancestries Reported - Russian (%)
Ancestries Reported - Scotch-Irish (%)
Ancestries Reported - Scottish (%)
Ancestries Reported - Slovak (%)
Ancestries Reported - Subsaharan African (%)
Ancestries Reported - Swedish (%)
Ancestries Reported - Swiss (%)
Ancestries Reported - Ukrainian (%)
Ancestries Reported - United States (%)
Ancestries Reported - Welsh (%)
Ancestries Reported - West Indian (%)
Ancestries Reported - Other (%)
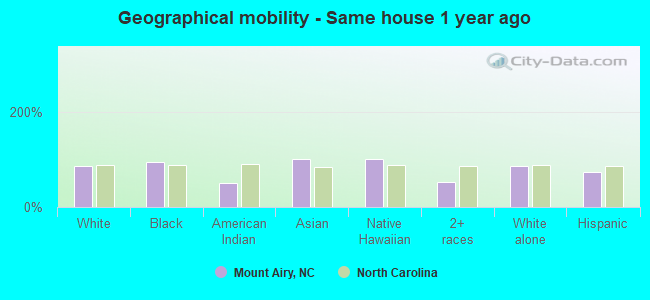
Geographical mobility - Same house 1 year ago (%)
Geographical mobility - Same house 1 year ago (%) - White
Geographical mobility - Same house 1 year ago (%) - Black or African American
Geographical mobility - Same house 1 year ago (%) - Asian
Geographical mobility - Same house 1 year ago (%) - Hispanic or Latino
Geographical mobility - Same house 1 year ago (%) - American Indian and Alaska Native
Geographical mobility - Same house 1 year ago (%) - Multirace
Geographical mobility - Same house 1 year ago (%) - Other Race
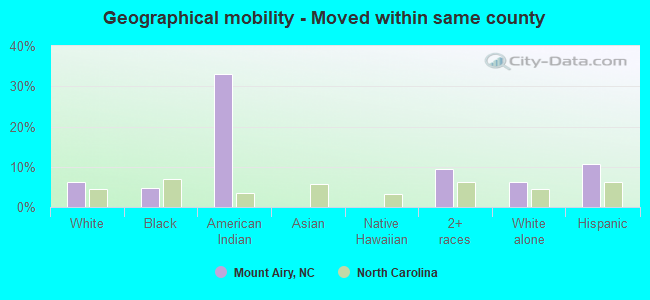
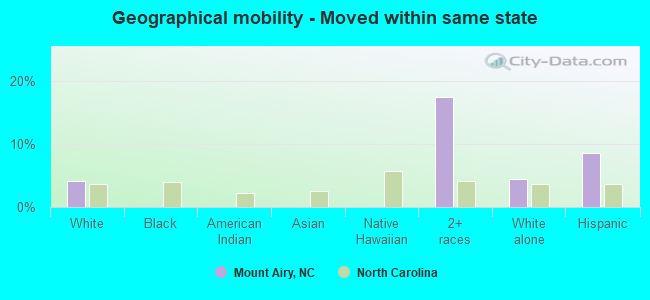
Geographical mobility - Moved within same county (%)
Geographical mobility - Moved within same county (%) - White
Geographical mobility - Moved within same county (%) - Black or African American
Geographical mobility - Moved within same county (%) - Asian
Geographical mobility - Moved within same county (%) - Hispanic or Latino
Geographical mobility - Moved within same county (%) - American Indian and Alaska Native
Geographical mobility - Moved within same county (%) - Multirace
Geographical mobility - Moved within same county (%) - Other Race
Geographical mobility - Moved from different county within same state (%)
Geographical mobility - Moved from different county within same state (%) - White
Geographical mobility - Moved from different county within same state (%) - Black or African American
Geographical mobility - Moved from different county within same state (%) - Asian
Geographical mobility - Moved from different county within same state (%) - Hispanic or Latino
Geographical mobility - Moved from different county within same state (%) - American Indian and Alaska Native
Geographical mobility - Moved from different county within same state (%) - Multirace
Geographical mobility - Moved from different county within same state (%) - Other Race
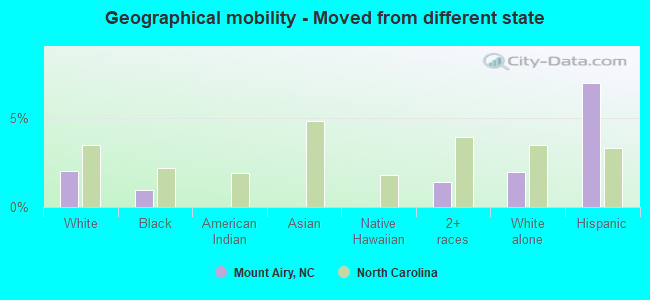
Geographical mobility - Moved from different state (%)
Geographical mobility - Moved from different state (%) - White
Geographical mobility - Moved from different state (%) - Black or African American
Geographical mobility - Moved from different state (%) - Asian
Geographical mobility - Moved from different state (%) - Hispanic or Latino
Geographical mobility - Moved from different state (%) - American Indian and Alaska Native
Geographical mobility - Moved from different state (%) - Multirace
Geographical mobility - Moved from different state (%) - Other Race
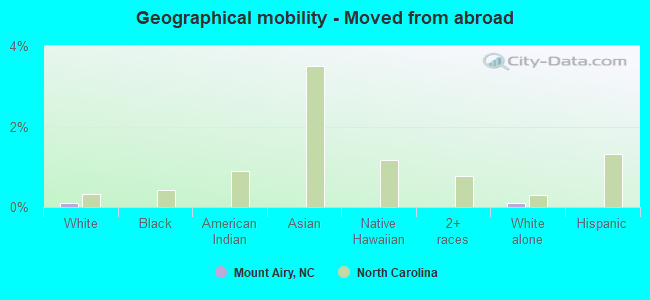
Geographical mobility - Moved from abroad (%)
Geographical mobility - Moved from abroad (%) - White
Geographical mobility - Moved from abroad (%) - Black or African American
Geographical mobility - Moved from abroad (%) - Asian
Geographical mobility - Moved from abroad (%) - Hispanic or Latino
Geographical mobility - Moved from abroad (%) - American Indian and Alaska Native
Geographical mobility - Moved from abroad (%) - Multirace
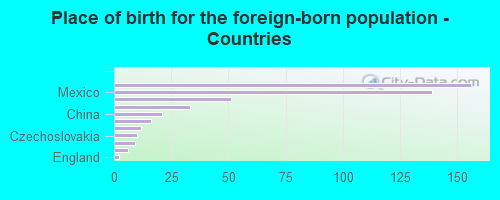
Geographical mobility - Moved from abroad (%) - Other Race
Place of birth for the foreign-born population - Ireland (%)
Place of birth for the foreign-born population - Denmark (%)
Place of birth for the foreign-born population - Norway (%)
Place of birth for the foreign-born population - Sweden (%)
Place of birth for the foreign-born population - United Kingdom (%)
Place of birth for the foreign-born population - England (%)
Place of birth for the foreign-born population - Scotland (%)
Place of birth for the foreign-born population - Other Northern Europe (%)
Place of birth for the foreign-born population - Austria (%)
Place of birth for the foreign-born population - Belgium (%)
Place of birth for the foreign-born population - France (%)
Place of birth for the foreign-born population - Germany (%)
Place of birth for the foreign-born population - Netherlands (%)
Place of birth for the foreign-born population - Switzerland (%)
Place of birth for the foreign-born population - Other Western Europe (%)
Place of birth for the foreign-born population - Greece (%)
Place of birth for the foreign-born population - Italy (%)
Place of birth for the foreign-born population - Portugal (%)
Place of birth for the foreign-born population - Spain (%)
Place of birth for the foreign-born population - Other Southern Europe (%)
Place of birth for the foreign-born population - Albania (%)
Place of birth for the foreign-born population - Belarus (%)
Place of birth for the foreign-born population - Bosnia and Herzegovina (%)
Place of birth for the foreign-born population - Bulgaria (%)
Place of birth for the foreign-born population - Croatia (%)
Place of birth for the foreign-born population - Czechoslovakia (%)
Place of birth for the foreign-born population - Hungary (%)
Place of birth for the foreign-born population - Latvia (%)
Place of birth for the foreign-born population - Lithuania (%)
Place of birth for the foreign-born population - North Macedonia (Macedonia) (%)
Place of birth for the foreign-born population - Moldova (%)
Place of birth for the foreign-born population - Poland (%)
Place of birth for the foreign-born population - Romania (%)
Place of birth for the foreign-born population - Russia (%)
Place of birth for the foreign-born population - Serbia (%)
Place of birth for the foreign-born population - Ukraine (%)
Place of birth for the foreign-born population - Other Eastern Europe (%)
Place of birth for the foreign-born population - China (%)
Place of birth for the foreign-born population - Hong Kong (%)
Place of birth for the foreign-born population - Taiwan (%)
Place of birth for the foreign-born population - Japan (%)
Place of birth for the foreign-born population - Korea (%)
Place of birth for the foreign-born population - Other Eastern Asia (%)
Place of birth for the foreign-born population - Afghanistan (%)
Place of birth for the foreign-born population - Bangladesh (%)
Place of birth for the foreign-born population - India (%)
Place of birth for the foreign-born population - Iran (%)
Place of birth for the foreign-born population - Kazakhstan (%)
Place of birth for the foreign-born population - Nepal (%)
Place of birth for the foreign-born population - Pakistan (%)
Place of birth for the foreign-born population - Sri Lanka (%)
Place of birth for the foreign-born population - Uzbekistan (%)
Place of birth for the foreign-born population - Other South Central Asia (%)
Place of birth for the foreign-born population - Burma (%)
Place of birth for the foreign-born population - Cambodia (%)
Place of birth for the foreign-born population - Indonesia (%)
Place of birth for the foreign-born population - Laos (%)
Place of birth for the foreign-born population - Malaysia (%)
Place of birth for the foreign-born population - Philippines (%)
Place of birth for the foreign-born population - Singapore (%)
Place of birth for the foreign-born population - Thailand (%)
Place of birth for the foreign-born population - Vietnam (%)
Place of birth for the foreign-born population - Other South Eastern Asia (%)
Place of birth for the foreign-born population - Armenia (%)
Place of birth for the foreign-born population - Iraq (%)
Place of birth for the foreign-born population - Israel (%)
Place of birth for the foreign-born population - Jordan (%)
Place of birth for the foreign-born population - Kuwait (%)
Place of birth for the foreign-born population - Lebanon (%)
Place of birth for the foreign-born population - Saudi Arabia (%)
Place of birth for the foreign-born population - Syria (%)
Place of birth for the foreign-born population - Turkey (%)
Place of birth for the foreign-born population - Yemen (%)
Place of birth for the foreign-born population - Other Western Asia (%)
Place of birth for the foreign-born population - Eritrea (%)
Place of birth for the foreign-born population - Ethiopia (%)
Place of birth for the foreign-born population - Kenya (%)
Place of birth for the foreign-born population - Somalia (%)
Place of birth for the foreign-born population - Uganda (%)
Place of birth for the foreign-born population - Zimbabwe (%)
Place of birth for the foreign-born population - Other Eastern Africa (%)
Place of birth for the foreign-born population - Cameroon (%)
Place of birth for the foreign-born population - Congo (%)
Place of birth for the foreign-born population - Democratic Republic of Congo (Zaire) (%)
Place of birth for the foreign-born population - Other Middle Africa (%)
Place of birth for the foreign-born population - Egypt (%)
Place of birth for the foreign-born population - Morocco (%)
Place of birth for the foreign-born population - Sudan (%)
Place of birth for the foreign-born population - Other Northern Africa (%)
Place of birth for the foreign-born population - South Africa (%)
Place of birth for the foreign-born population - Other Southern Africa (%)
Place of birth for the foreign-born population - Cabo Verde (%)
Place of birth for the foreign-born population - Ghana (%)
Place of birth for the foreign-born population - Liberia (%)
Place of birth for the foreign-born population - Nigeria (%)
Place of birth for the foreign-born population - Senegal (%)
Place of birth for the foreign-born population - Sierra Leone (%)
Place of birth for the foreign-born population - Other Western Africa (%)
Place of birth for the foreign-born population - Australia (%)
Place of birth for the foreign-born population - New Zealand (%)
Place of birth for the foreign-born population - Fiji (%)
Place of birth for the foreign-born population - Micronesia (%)
Place of birth for the foreign-born population - Bahamas (%)
Place of birth for the foreign-born population - Barbados (%)
Place of birth for the foreign-born population - Cuba (%)
Place of birth for the foreign-born population - Dominica (%)
Place of birth for the foreign-born population - Dominican Republic (%)
Place of birth for the foreign-born population - Grenada (%)
Place of birth for the foreign-born population - Haiti (%)
Place of birth for the foreign-born population - Jamaica (%)
Place of birth for the foreign-born population - St. Vincent and the Grenadines (%)
Place of birth for the foreign-born population - Trinidad and Tobago (%)
Place of birth for the foreign-born population - West Indies (%)
Place of birth for the foreign-born population - Other Caribbean (%)
Place of birth for the foreign-born population - Belize (%)
Place of birth for the foreign-born population - Costa Rica (%)
Place of birth for the foreign-born population - El Salvador (%)
Place of birth for the foreign-born population - Guatemala (%)
Place of birth for the foreign-born population - Honduras (%)
Place of birth for the foreign-born population - Mexico (%)
Place of birth for the foreign-born population - Nicaragua (%)
Place of birth for the foreign-born population - Panama (%)
Place of birth for the foreign-born population - Other Central America (%)
Place of birth for the foreign-born population - Argentina (%)
Place of birth for the foreign-born population - Bolivia (%)
Place of birth for the foreign-born population - Brazil (%)
Place of birth for the foreign-born population - Chile (%)
Place of birth for the foreign-born population - Colombia (%)
Place of birth for the foreign-born population - Ecuador (%)
Place of birth for the foreign-born population - Guyana (%)
Place of birth for the foreign-born population - Peru (%)
Place of birth for the foreign-born population - Uruguay (%)
Place of birth for the foreign-born population - Venezuela (%)
Place of birth for the foreign-born population - Other South America (%)
Place of birth for the foreign-born population - Canada (%)
Place of birth for the foreign-born population - Other Northern America (%)
Place of birth for the foreign-born population - Other (%)
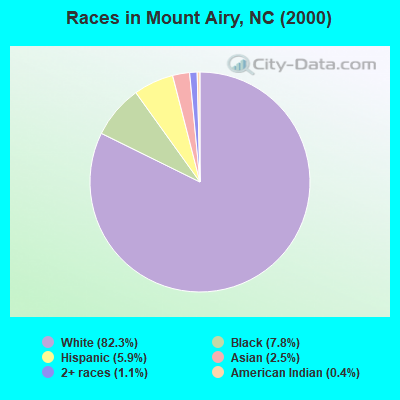
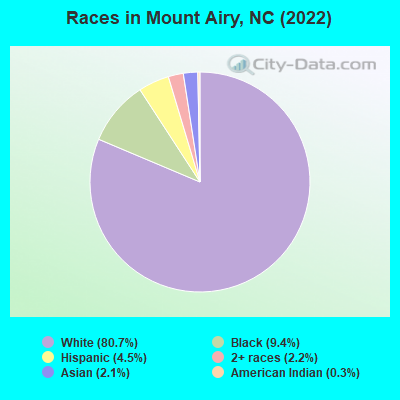
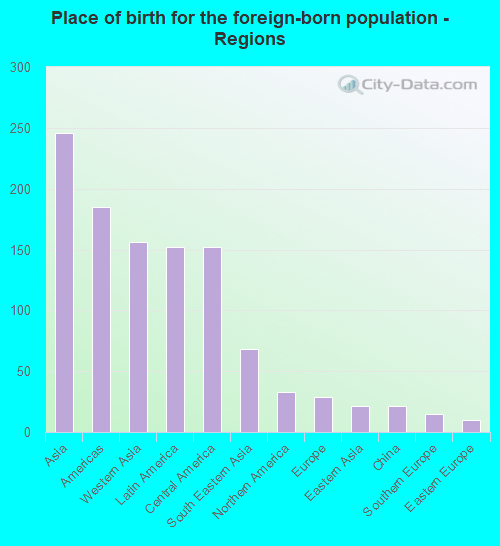
According to 2022 data, the most numerous races in Mount Airy, NC are White alone (8,756 residents), Black alone (1,020 residents), and Hispanic (485 residents). 91.9% of Mount Airy residents speak English at home. 4.3% of Mount Airy, NC residents are foreign-born (2.2% born in Asia, 1.3% born in Latin America), which is 84.2% less than the foreign-born rate of 8.0% across the entire state of North Carolina.
Race distribution in Mount Airy
2000 2022
5,647,155 70.2% White alone 1,723,301 21.4% Black alone 378,963 4.7% Hispanic 112,416 1.4% Asian alone 95,333 1.2% American Indian alone 79,965 1.0% Two or more races 9,015 0.1% Other race alone 3,165 0.04% Native Hawaiian and Other
6,497,519 60.7% White alone 2,155,650 20.1% Black alone 1,114,799 10.4% Hispanic 438,061 4.1% Two or more races 341,052 3.2% Asian alone 91,758 0.9% American Indian alone 50,180 0.5% Other race alone 9,954 0.09% Native Hawaiian and Other
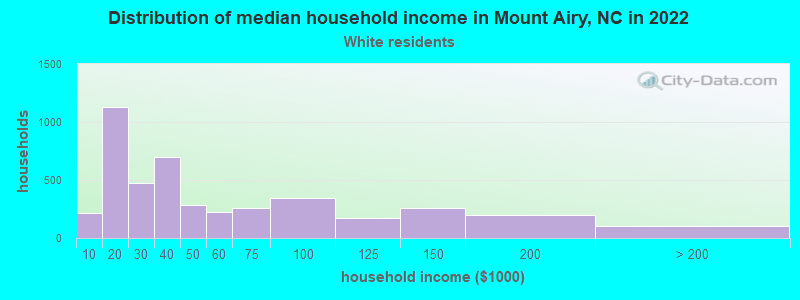
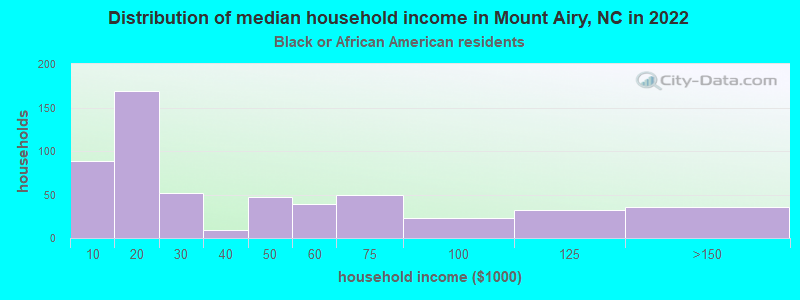
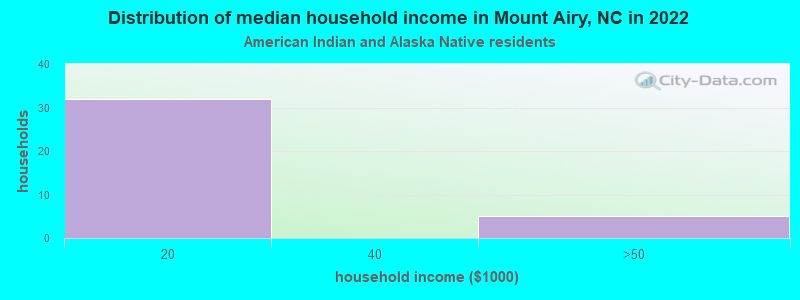
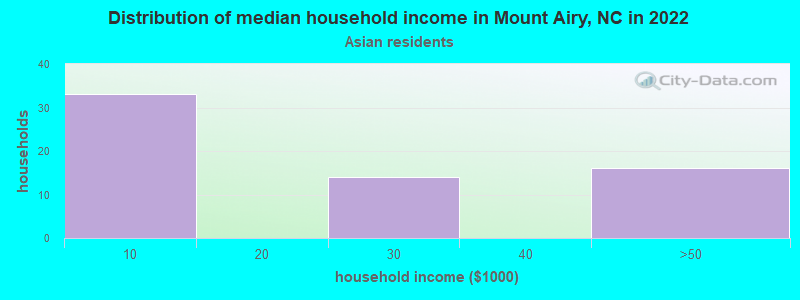
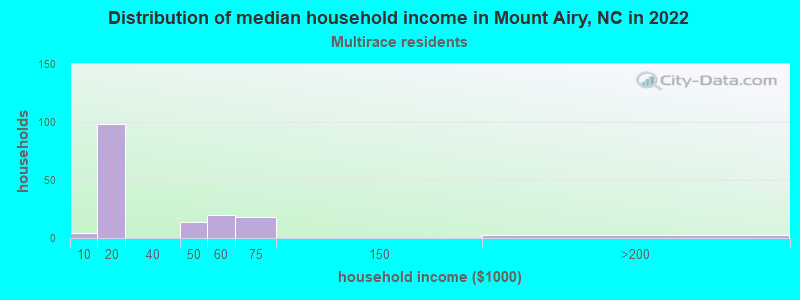
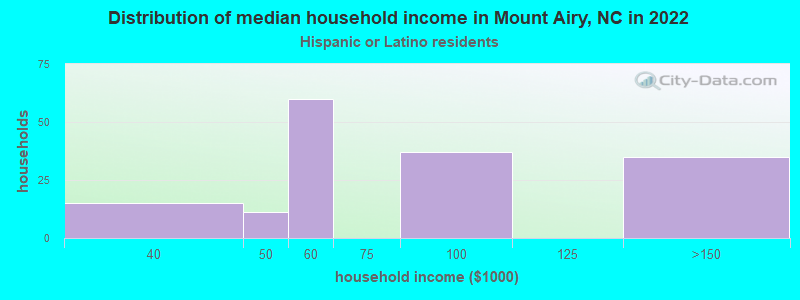
Income and house value in Mount Airy Median household income in 2022 $31,370 White non-Hispanic householders$13,416 American Indian and Alaska Native householders$2,499 Asian householders$39,660 Hispanic or Latino race householdersMedian 2022 house value $191,712 White Non-Hispanic householders$204,543 Black or African American householders$81,767 American Indian or Alaska Native householders$255,616 Two or more races householders$94,346 Hispanic or Latino householders
Median age by race in Mount Airy
48.5 Median age for White residents42.4 51.6 54.9 Median age for Black or African American residents38.3 62.8 69.7 Median age for American Indian / Alaska Native residents-668,604,650.5 60.4 26.9 Median age for Asian residents13.3 27.4 -609,884,331.7 Median age for Native Hawaiian / Pacific Islander residents-611,708,482.1 -612,403,100.2 -961,702,126.7 Median age for Other race residents-741,312,740.6 -1,592,841,161.7 31.2 Median age for Two or more races residents22.9 46.5 49.1 Median age for White alone residents43.7 50.0 32.1 Median age for Hispanic or Latino residents26.8 40.0
Owner/renter occupied households by race in Mount Airy
House owners and renters - White residents 2,415 58.3% Owner occupied1,728 41.7% Renter occupiedHouse owners and renters - Black or African American residents 224 35.3% Owner occupied412 64.7% Renter occupiedHouse owners and renters - American Indian / Alaska Native residents 5 15.8% Owner occupied29 84.2% Renter occupiedHouse owners and renters - Asian residents 15 25.4% Owner occupied43 74.6% Renter occupiedHouse owners and renters - Two or more races residents 69 42.9% Owner occupied91 57.1% Renter occupiedHouse owners and renters - White alone residents 2,410 58.0% Owner occupied1,743 42.0% Renter occupiedHouse owners and renters - Hispanic or Latino residents 102 54.1% Owner occupied87 45.9% Renter occupied
Language usage in Mount Airy
English speakers - Total 91.9% of residents of Mount Airy speak English at home.
4.6% of residents speak Spanish at home 352 74.1% Speak English very well123 25.9% Speak English less than very well3.4% of residents speak other language at home 278 79.9% Speak English very well70 20.1% Speak English less than very well
English speakers - Born in the United States 98.3% of residents of Mount Airy speak English at home.
1.5% of residents speak Spanish at home 44 100.0% Speak English very well
English speakers - Native, born elsewhere 46.4% of residents of Mount Airy speak English at home.
58.4% of residents speak Spanish at home 40 32.8% Speak English very well82 67.2% Speak English less than very well
English speakers - Foreign-born 11.5% of residents of Mount Airy speak English at home.
31.5% of residents speak Spanish at home 104 71.7% Speak English very well41 28.3% Speak English less than very well57.5% of residents speak other language at home 196 74.0% Speak English very well69 26.0% Speak English less than very well
White (Caucasian) - Speak only English Native:
98.6% (7,962)Foreign-born:
7.6% (15)
White (Caucasian) - Speak another language Native:
2.6% (212)Foreign-born:
78.1% (155)
Black or African American - Speak another language Native:
2.0% (20)Foreign-born:
99.2% (35)
Asian - Speak only English Native:
28.0% (32)Foreign-born:
26.9% (33)
Asian - Speak another language Native:
72.3% (82)Foreign-born:
72.9% (89)
White alone - Speak only English Native:
98.9% (7,932)Foreign-born:
25.1% (27)
White alone - Speak another language Native:
1.1% (87)Foreign-born:
100.0% (107)
Hispanic or Latino - Speak another language Native:
76.7% (272)Foreign-born:
94.2% (148)
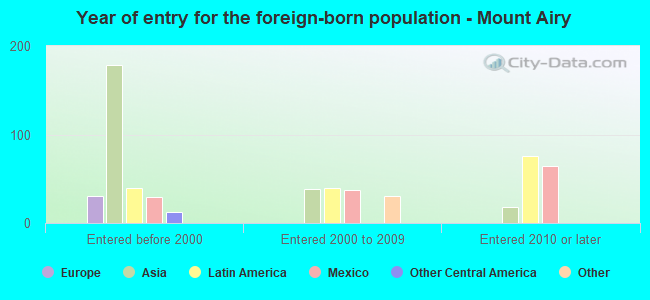
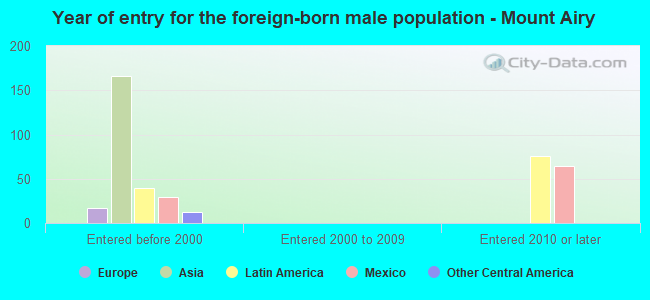
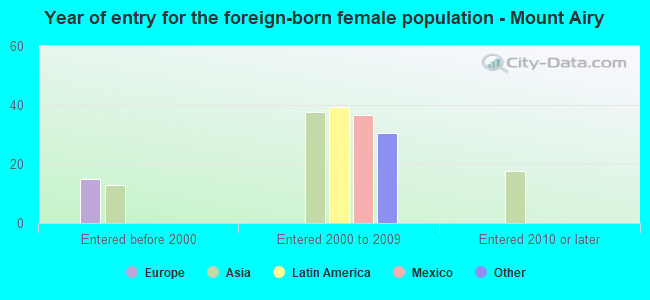
Foreign-born residents in Mount Airy 461 residents are foreign born (2.2% Asia , 1.3% Latin America ).
This city:
4.3%North Carolina:
8.3%
Marital status for residents in Mount Airy Marital status - White (Caucasian) population 15 years and over
Males 34.4% Never married42.2% Now married6.4% Separated5.0% Widowed12.1% DivorcedFemales 17.9% Never married34.6% Now married4.2% Separated24.8% Widowed18.5% DivorcedWomen who gave birth in the past 12 months Now married:
40.1% (72)Unmarried:
59.9% (108)
Women who did not give birth in the past 12 months Now married:
39.1% (562)Unmarried:
60.9% (875)
Marital status - Black or African American population 15 years and over
Males 31.1% Never married43.0% Now married0.0% Separated5.5% Widowed20.4% DivorcedFemales 37.9% Never married21.0% Now married0.2% Separated30.7% Widowed10.2% DivorcedWomen who gave birth in the past 12 months Now married:
100.0% (2)Unmarried:
0.0% (0)
Women who did not give birth in the past 12 months Now married:
27.7% (69)Unmarried:
72.3% (180)
Marital status - American Indian / Alaska Native population 15 years and over
Males 0.0% Never married0.0% Now married0.0% Separated0.0% Widowed100.0% DivorcedFemales 0.0% Never married25.0% Now married0.0% Separated0.0% Widowed75.0% DivorcedMarital status - Asian population 15 years and over
Males 76.7% Never married23.3% Now married0.0% Separated0.0% Widowed0.0% DivorcedFemales 39.6% Never married60.4% Now married0.0% Separated0.0% Widowed0.0% DivorcedWomen who did not give birth in the past 12 months Now married:
60.4% (64)Unmarried:
39.6% (42)
Marital status - Two or more races population 15 years and over
Males 53.6% Never married46.4% Now married0.0% Separated0.0% Widowed0.0% DivorcedFemales 39.5% Never married54.3% Now married0.0% Separated0.0% Widowed6.2% DivorcedWomen who did not give birth in the past 12 months Now married:
0.0% (0)Unmarried:
100.0% (62)
Marital status - White alone, not Hispanic / Latino population 15 years and over
Males 32.5% Never married42.8% Now married6.7% Separated5.3% Widowed12.7% DivorcedFemales 17.3% Never married33.8% Now married4.3% Separated25.5% Widowed19.1% DivorcedWomen who gave birth in the past 12 months Now married:
40.1% (77)Unmarried:
59.9% (115)
Women who did not give birth in the past 12 months Now married:
37.3% (529)Unmarried:
62.7% (890)
Marital status - Hispanic or Latino population 15 years and over
Males 55.6% Never married44.4% Now married0.0% Separated0.0% Widowed0.0% DivorcedFemales 32.8% Never married63.4% Now married0.0% Separated3.8% Widowed0.0% DivorcedWomen who did not give birth in the past 12 months Now married:
62.9% (79)Unmarried:
37.1% (46)
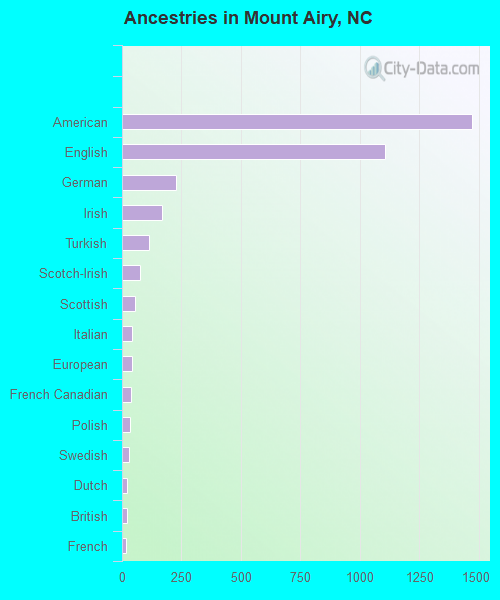
Ancestries in Mount Airy
1,469 26.6% American1,104 20.0% English229 4.2% German167 3.0% Irish113 2.0% Turkish75 1.4% Scotch-Irish54 1.0% Scottish41 0.7% Italian40 0.7% European39 0.7% French Canadian34 0.6% Polish31 0.6% Swedish21 0.4% Dutch19 0.3% British15 0.3% French11 0.2% Canadian10 0.2% Scandinavian8 0.1% Portuguese7 0.1% Czech4 0.07% Russian3 0.05% Estonian
Children Nativity (place of birth) in Mount Airy
Children under 6 years - Living with two parents Both parents native 202 100.0% NativeOne native, one foreign-born parent 35 100.0% NativeChildren under 6 years - Living with one parent Native parent 336 100.0% NativeChildren 6 to 17 years - Living with two parents Both parents native 400 100.0% NativeBoth parents foreign-born 73 100.0% NativeOne native, one foreign-born parent 29 100.0% NativeChildren 6 to 17 years - Living with one parent Native parent 827 100.0% NativeForeign-born parent 87 51.0% Native84 49.0% Foreign-born
Grandparents responsible for own grandchildren in Mount Airy
Grandparents (30 to 59 years) White / Caucasian 27 100.0% Not responsible for grandchildrenBlack or African American 11 100.0% Not responsible for grandchildrenWhite alone, not Hispanic / Latino 27 100.0% Not responsible for grandchildrenGrandparents (60 years and over) White / Caucasian 29 33.7% Responsible for grandchildren58 66.3% Not responsible for grandchildrenBlack or African American 27 100.0% Not responsible for grandchildrenWhite alone, not Hispanic / Latino 29 25.6% Responsible for grandchildren86 74.4% Not responsible for grandchildren