Races in Mount Arlington, New Jersey (NJ) Detailed Stats
Data:
Races - White alone (%)
Races - White alone (% change since 2000)
Races - Black alone (%)
Races - Black alone (% change since 2000)
Races - American Indian alone (%)
Races - American Indian alone (% change since 2000)
Races - Asian alone (%)
Races - Asian alone (% change since 2000)
Races - Hispanic (%)
Races - Hispanic (% change since 2000)
Races - Native Hawaiian and Other Pacific Islander alone (%)
Races - Native Hawaiian and Other Pacific Islander alone (% change since 2000)
Races - Two or more races(%)
Races - Two or more races(% change since 2000)
Races - Other race alone (%)
Races - Other race alone (% change since 2000)
Racial diversity
Place of birth - Born in state of residence (%)
Place of birth - Born in state of residence (%) - White
Place of birth - Born in state of residence (%) - Black or African American
Place of birth - Born in state of residence (%) - Asian
Place of birth - Born in state of residence (%) - Hispanic or Latino
Place of birth - Born in state of residence (%) - American Indian and Alaska Native
Place of birth - Born in state of residence (%) - Multirace
Place of birth - Born in state of residence (%) - Other Race
Place of birth - Born in other state (%)
Place of birth - Born in other state (%) - White
Place of birth - Born in other state (%) - Black or African American
Place of birth - Born in other state (%) - Asian
Place of birth - Born in other state (%) - Hispanic or Latino
Place of birth - Born in other state (%) - American Indian and Alaska Native
Place of birth - Born in other state (%) - Multirace
Place of birth - Born in other state (%) - Other Race
Place of birth - Native, outside of US (%)
Place of birth - Native, outside of US (%) - White
Place of birth - Native, outside of US (%) - Black or African American
Place of birth - Native, outside of US (%) - Asian
Place of birth - Native, outside of US (%) - Hispanic or Latino
Place of birth - Native, outside of US (%) - American Indian and Alaska Native
Place of birth - Native, outside of US (%) - Multirace
Place of birth - Native, outside of US (%) - Other Race
Place of birth - Foreign born (%)
Place of birth - Foreign born (%) - White
Place of birth - Foreign born (%) - Black or African American
Place of birth - Foreign born (%) - Asian
Place of birth - Foreign born (%) - Hispanic or Latino
Place of birth - Foreign born (%) - American Indian and Alaska Native
Place of birth - Foreign born (%) - Multirace
Place of birth - Foreign born (%) - Other Race
Residents speaking English at home (%)
Residents speaking English at home - Born in the United States (%)
Residents speaking English at home - Native, born elsewhere (%)
Residents speaking English at home - Foreign born (%)
Residents speaking Spanish at home (%)
Residents speaking Spanish at home - Born in the United States (%)
Residents speaking Spanish at home - Native, born elsewhere (%)
Residents speaking Spanish at home - Foreign born (%)
Residents speaking other language at home (%)
Residents speaking other language at home - Born in the United States (%)
Residents speaking other language at home - Native, born elsewhere (%)
Residents speaking other language at home - Foreign born (%)
Marital status - Never married (%)
Marital status - Now married (%)
Marital status - Separated (%)
Marital status - Widowed (%)
Marital status - Divorced (%)
Ancestries Reported - Arab (%)
Ancestries Reported - Czech (%)
Ancestries Reported - Danish (%)
Ancestries Reported - Dutch (%)
Ancestries Reported - English (%)
Ancestries Reported - French (%)
Ancestries Reported - French Canadian (%)
Ancestries Reported - German (%)
Ancestries Reported - Greek (%)
Ancestries Reported - Hungarian (%)
Ancestries Reported - Irish (%)
Ancestries Reported - Italian (%)
Ancestries Reported - Lithuanian (%)
Ancestries Reported - Norwegian (%)
Ancestries Reported - Polish (%)
Ancestries Reported - Portuguese (%)
Ancestries Reported - Russian (%)
Ancestries Reported - Scotch-Irish (%)
Ancestries Reported - Scottish (%)
Ancestries Reported - Slovak (%)
Ancestries Reported - Subsaharan African (%)
Ancestries Reported - Swedish (%)
Ancestries Reported - Swiss (%)
Ancestries Reported - Ukrainian (%)
Ancestries Reported - United States (%)
Ancestries Reported - Welsh (%)
Ancestries Reported - West Indian (%)
Ancestries Reported - Other (%)
Geographical mobility - Same house 1 year ago (%)
Geographical mobility - Same house 1 year ago (%) - White
Geographical mobility - Same house 1 year ago (%) - Black or African American
Geographical mobility - Same house 1 year ago (%) - Asian
Geographical mobility - Same house 1 year ago (%) - Hispanic or Latino
Geographical mobility - Same house 1 year ago (%) - American Indian and Alaska Native
Geographical mobility - Same house 1 year ago (%) - Multirace
Geographical mobility - Same house 1 year ago (%) - Other Race
Geographical mobility - Moved within same county (%)
Geographical mobility - Moved within same county (%) - White
Geographical mobility - Moved within same county (%) - Black or African American
Geographical mobility - Moved within same county (%) - Asian
Geographical mobility - Moved within same county (%) - Hispanic or Latino
Geographical mobility - Moved within same county (%) - American Indian and Alaska Native
Geographical mobility - Moved within same county (%) - Multirace
Geographical mobility - Moved within same county (%) - Other Race
Geographical mobility - Moved from different county within same state (%)
Geographical mobility - Moved from different county within same state (%) - White
Geographical mobility - Moved from different county within same state (%) - Black or African American
Geographical mobility - Moved from different county within same state (%) - Asian
Geographical mobility - Moved from different county within same state (%) - Hispanic or Latino
Geographical mobility - Moved from different county within same state (%) - American Indian and Alaska Native
Geographical mobility - Moved from different county within same state (%) - Multirace
Geographical mobility - Moved from different county within same state (%) - Other Race
Geographical mobility - Moved from different state (%)
Geographical mobility - Moved from different state (%) - White
Geographical mobility - Moved from different state (%) - Black or African American
Geographical mobility - Moved from different state (%) - Asian
Geographical mobility - Moved from different state (%) - Hispanic or Latino
Geographical mobility - Moved from different state (%) - American Indian and Alaska Native
Geographical mobility - Moved from different state (%) - Multirace
Geographical mobility - Moved from different state (%) - Other Race
Geographical mobility - Moved from abroad (%)
Geographical mobility - Moved from abroad (%) - White
Geographical mobility - Moved from abroad (%) - Black or African American
Geographical mobility - Moved from abroad (%) - Asian
Geographical mobility - Moved from abroad (%) - Hispanic or Latino
Geographical mobility - Moved from abroad (%) - American Indian and Alaska Native
Geographical mobility - Moved from abroad (%) - Multirace
Geographical mobility - Moved from abroad (%) - Other Race
Place of birth for the foreign-born population - Ireland (%)
Place of birth for the foreign-born population - Denmark (%)
Place of birth for the foreign-born population - Norway (%)
Place of birth for the foreign-born population - Sweden (%)
Place of birth for the foreign-born population - United Kingdom (%)
Place of birth for the foreign-born population - England (%)
Place of birth for the foreign-born population - Scotland (%)
Place of birth for the foreign-born population - Other Northern Europe (%)
Place of birth for the foreign-born population - Austria (%)
Place of birth for the foreign-born population - Belgium (%)
Place of birth for the foreign-born population - France (%)
Place of birth for the foreign-born population - Germany (%)
Place of birth for the foreign-born population - Netherlands (%)
Place of birth for the foreign-born population - Switzerland (%)
Place of birth for the foreign-born population - Other Western Europe (%)
Place of birth for the foreign-born population - Greece (%)
Place of birth for the foreign-born population - Italy (%)
Place of birth for the foreign-born population - Portugal (%)
Place of birth for the foreign-born population - Spain (%)
Place of birth for the foreign-born population - Other Southern Europe (%)
Place of birth for the foreign-born population - Albania (%)
Place of birth for the foreign-born population - Belarus (%)
Place of birth for the foreign-born population - Bosnia and Herzegovina (%)
Place of birth for the foreign-born population - Bulgaria (%)
Place of birth for the foreign-born population - Croatia (%)
Place of birth for the foreign-born population - Czechoslovakia (%)
Place of birth for the foreign-born population - Hungary (%)
Place of birth for the foreign-born population - Latvia (%)
Place of birth for the foreign-born population - Lithuania (%)
Place of birth for the foreign-born population - North Macedonia (Macedonia) (%)
Place of birth for the foreign-born population - Moldova (%)
Place of birth for the foreign-born population - Poland (%)
Place of birth for the foreign-born population - Romania (%)
Place of birth for the foreign-born population - Russia (%)
Place of birth for the foreign-born population - Serbia (%)
Place of birth for the foreign-born population - Ukraine (%)
Place of birth for the foreign-born population - Other Eastern Europe (%)
Place of birth for the foreign-born population - China (%)
Place of birth for the foreign-born population - Hong Kong (%)
Place of birth for the foreign-born population - Taiwan (%)
Place of birth for the foreign-born population - Japan (%)
Place of birth for the foreign-born population - Korea (%)
Place of birth for the foreign-born population - Other Eastern Asia (%)
Place of birth for the foreign-born population - Afghanistan (%)
Place of birth for the foreign-born population - Bangladesh (%)
Place of birth for the foreign-born population - India (%)
Place of birth for the foreign-born population - Iran (%)
Place of birth for the foreign-born population - Kazakhstan (%)
Place of birth for the foreign-born population - Nepal (%)
Place of birth for the foreign-born population - Pakistan (%)
Place of birth for the foreign-born population - Sri Lanka (%)
Place of birth for the foreign-born population - Uzbekistan (%)
Place of birth for the foreign-born population - Other South Central Asia (%)
Place of birth for the foreign-born population - Burma (%)
Place of birth for the foreign-born population - Cambodia (%)
Place of birth for the foreign-born population - Indonesia (%)
Place of birth for the foreign-born population - Laos (%)
Place of birth for the foreign-born population - Malaysia (%)
Place of birth for the foreign-born population - Philippines (%)
Place of birth for the foreign-born population - Singapore (%)
Place of birth for the foreign-born population - Thailand (%)
Place of birth for the foreign-born population - Vietnam (%)
Place of birth for the foreign-born population - Other South Eastern Asia (%)
Place of birth for the foreign-born population - Armenia (%)
Place of birth for the foreign-born population - Iraq (%)
Place of birth for the foreign-born population - Israel (%)
Place of birth for the foreign-born population - Jordan (%)
Place of birth for the foreign-born population - Kuwait (%)
Place of birth for the foreign-born population - Lebanon (%)
Place of birth for the foreign-born population - Saudi Arabia (%)
Place of birth for the foreign-born population - Syria (%)
Place of birth for the foreign-born population - Turkey (%)
Place of birth for the foreign-born population - Yemen (%)
Place of birth for the foreign-born population - Other Western Asia (%)
Place of birth for the foreign-born population - Eritrea (%)
Place of birth for the foreign-born population - Ethiopia (%)
Place of birth for the foreign-born population - Kenya (%)
Place of birth for the foreign-born population - Somalia (%)
Place of birth for the foreign-born population - Uganda (%)
Place of birth for the foreign-born population - Zimbabwe (%)
Place of birth for the foreign-born population - Other Eastern Africa (%)
Place of birth for the foreign-born population - Cameroon (%)
Place of birth for the foreign-born population - Congo (%)
Place of birth for the foreign-born population - Democratic Republic of Congo (Zaire) (%)
Place of birth for the foreign-born population - Other Middle Africa (%)
Place of birth for the foreign-born population - Egypt (%)
Place of birth for the foreign-born population - Morocco (%)
Place of birth for the foreign-born population - Sudan (%)
Place of birth for the foreign-born population - Other Northern Africa (%)
Place of birth for the foreign-born population - South Africa (%)
Place of birth for the foreign-born population - Other Southern Africa (%)
Place of birth for the foreign-born population - Cabo Verde (%)
Place of birth for the foreign-born population - Ghana (%)
Place of birth for the foreign-born population - Liberia (%)
Place of birth for the foreign-born population - Nigeria (%)
Place of birth for the foreign-born population - Senegal (%)
Place of birth for the foreign-born population - Sierra Leone (%)
Place of birth for the foreign-born population - Other Western Africa (%)
Place of birth for the foreign-born population - Australia (%)
Place of birth for the foreign-born population - New Zealand (%)
Place of birth for the foreign-born population - Fiji (%)
Place of birth for the foreign-born population - Micronesia (%)
Place of birth for the foreign-born population - Bahamas (%)
Place of birth for the foreign-born population - Barbados (%)
Place of birth for the foreign-born population - Cuba (%)
Place of birth for the foreign-born population - Dominica (%)
Place of birth for the foreign-born population - Dominican Republic (%)
Place of birth for the foreign-born population - Grenada (%)
Place of birth for the foreign-born population - Haiti (%)
Place of birth for the foreign-born population - Jamaica (%)
Place of birth for the foreign-born population - St. Vincent and the Grenadines (%)
Place of birth for the foreign-born population - Trinidad and Tobago (%)
Place of birth for the foreign-born population - West Indies (%)
Place of birth for the foreign-born population - Other Caribbean (%)
Place of birth for the foreign-born population - Belize (%)
Place of birth for the foreign-born population - Costa Rica (%)
Place of birth for the foreign-born population - El Salvador (%)
Place of birth for the foreign-born population - Guatemala (%)
Place of birth for the foreign-born population - Honduras (%)
Place of birth for the foreign-born population - Mexico (%)
Place of birth for the foreign-born population - Nicaragua (%)
Place of birth for the foreign-born population - Panama (%)
Place of birth for the foreign-born population - Other Central America (%)
Place of birth for the foreign-born population - Argentina (%)
Place of birth for the foreign-born population - Bolivia (%)
Place of birth for the foreign-born population - Brazil (%)
Place of birth for the foreign-born population - Chile (%)
Place of birth for the foreign-born population - Colombia (%)
Place of birth for the foreign-born population - Ecuador (%)
Place of birth for the foreign-born population - Guyana (%)
Place of birth for the foreign-born population - Peru (%)
Place of birth for the foreign-born population - Uruguay (%)
Place of birth for the foreign-born population - Venezuela (%)
Place of birth for the foreign-born population - Other South America (%)
Place of birth for the foreign-born population - Canada (%)
Place of birth for the foreign-born population - Other Northern America (%)
Place of birth for the foreign-born population - Other (%)
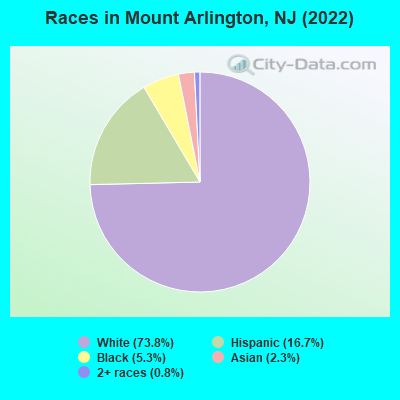
According to 2022 data, the most numerous races in Mount Arlington, NJ are White alone (4,347 residents), Hispanic (981 residents), and Black alone (310 residents). 81.3% of Mount Arlington residents speak English at home. 10.9% of Mount Arlington, NJ residents are foreign-born (4.7% born in Latin America, 2.3% born in Africa, 2.1% born in Asia, 1.6% born in Europe), which is 111.3% less than the foreign-born rate of 23.0% across the entire state of New Jersey.
Race distribution in Mount Arlington
2000 2022
5,557,209 66.0% White alone 1,117,191 13.3% Hispanic 1,096,171 13.0% Black alone 477,012 5.7% Asian alone 133,689 1.6% Two or more races 19,565 0.2% Other race alone 11,338 0.1% American Indian alone 2,175 0.03% Native Hawaiian and Other
4,766,476 51.5% White alone 2,028,470 21.9% Hispanic 1,111,632 12.0% Black alone 923,546 10.0% Asian alone 332,237 3.6% Two or more races 89,847 1.0% Other race alone 8,557 0.09% American Indian alone 934 0.01% Native Hawaiian and Other
Income and house value in Mount Arlington Median household income in 2022 $91,438 White non-Hispanic householders$137,830 Asian householders$112,653 Hispanic or Latino race householdersMedian 2022 house value $405,243 White Non-Hispanic householders$434,599 Black or African American householders $373,239 Asian householders$459,761 Some other race householders$326,446 Two or more races householders$472,122 Hispanic or Latino householders
Median age by race in Mount Arlington
47.7 Median age for White residents47.5 47.5 34.3 Median age for Black or African American residents12.6 46.4 7.5 Median age for American Indian / Alaska Native residents-707,246,376.1 -671,264,367.1 35.4 Median age for Asian residents32.8 35.4 -804,177,544.9 Median age for Native Hawaiian / Pacific Islander residents-666,666,666.0 -713,070,378.3 55.4 Median age for Other race residents33.4 -567,708,332.8 35.8 Median age for Two or more races residents41.9 24.5 47.8 Median age for White alone residents47.9 47.5 29.7 Median age for Hispanic or Latino residents30.1 21.1
Owner/renter occupied households by race in Mount Arlington
House owners and renters - White residents 1,460 75.3% Owner occupied478 24.7% Renter occupiedHouse owners and renters - Black or African American residents 115 100.0% Renter occupiedHouse owners and renters - Asian residents 66 100.0% Owner occupiedHouse owners and renters - Other race residents 86 100.0% Renter occupiedHouse owners and renters - Two or more races residents 160 65.4% Owner occupied85 34.6% Renter occupiedHouse owners and renters - White alone residents 1,444 74.6% Owner occupied491 25.4% Renter occupiedHouse owners and renters - Hispanic or Latino residents 120 44.1% Owner occupied152 55.9% Renter occupied
Language usage in Mount Arlington
English speakers - Total 81.3% of residents of Mount Arlington speak English at home.
9.5% of residents speak Spanish at home 296 56.4% Speak English very well229 43.6% Speak English less than very well8.9% of residents speak other language at home 431 86.9% Speak English very well65 13.1% Speak English less than very well
English speakers - Born in the United States 88.4% of residents of Mount Arlington speak English at home.
3.8% of residents speak Spanish at home 6 13.0% Speak English very well40 87.0% Speak English less than very well7.6% of residents speak other language at home 91 100.0% Speak English very well
English speakers - Native, born elsewhere 75.0% of residents of Mount Arlington speak English at home.
21.4% of residents speak Spanish at home 6 100.0% Speak English very well
English speakers - Foreign-born 3.4% of residents of Mount Arlington speak English at home.
44.7% of residents speak Spanish at home 88 31.8% Speak English very well189 68.2% Speak English less than very well52.6% of residents speak other language at home 263 80.7% Speak English very well63 19.3% Speak English less than very well
White (Caucasian) - Speak only English Native:
97.0% (3,857)Foreign-born:
6.8% (19)
White (Caucasian) - Speak another language Native:
3.4% (135)Foreign-born:
86.7% (247)
American Indian / Alaska Native - Speak another language Native:
59.4% (34)Foreign-born:
97.6% (22)
Asian - Speak another language Native:
24.6% (13)Foreign-born:
100.0% (85)
Other race - Speak another language Native:
48.5% (64)Foreign-born:
99.6% (28)
Two or more races - Speak another language Native:
49.7% (188)Foreign-born:
97.9% (149)
White alone - Speak only English Native:
96.2% (3,757)Foreign-born:
8.0% (20)
White alone - Speak another language Native:
3.8% (148)Foreign-born:
95.3% (242)
Hispanic or Latino - Speak another language Native:
40.2% (228)Foreign-born:
97.5% (283)
Foreign-born residents in Mount Arlington 641 residents are foreign born (4.7% Latin America , 2.3% Africa , 2.1% Asia , 1.6% Europe ).
This city:
10.9%New Jersey:
23.2%
Marital status for residents in Mount Arlington Marital status - White (Caucasian) population 15 years and over
Males 32.6% Never married53.3% Now married1.7% Separated1.8% Widowed10.5% DivorcedFemales 32.2% Never married41.7% Now married0.0% Separated12.9% Widowed13.2% DivorcedWomen who gave birth in the past 12 months Now married:
74.7% (56)Unmarried:
25.3% (19)
Women who did not give birth in the past 12 months Now married:
36.4% (351)Unmarried:
63.6% (613)
Marital status - Black or African American population 15 years and over
Males 37.2% Never married31.9% Now married24.5% Separated0.0% Widowed6.4% DivorcedFemales 70.7% Never married0.0% Now married0.0% Separated0.0% Widowed29.3% DivorcedWomen who did not give birth in the past 12 months Now married:
0.0% (0)Unmarried:
100.0% (77)
Marital status - Asian population 15 years and over
Males 0.0% Never married100.0% Now married0.0% Separated0.0% Widowed0.0% DivorcedFemales 35.7% Never married52.9% Now married0.0% Separated11.4% Widowed0.0% DivorcedWomen who did not give birth in the past 12 months Now married:
59.7% (40)Unmarried:
40.3% (27)
Marital status - Other race population 15 years and over
Males 55.0% Never married0.0% Now married0.0% Separated0.0% Widowed45.0% DivorcedFemales 74.4% Never married25.6% Now married0.0% Separated0.0% Widowed0.0% DivorcedMarital status - Two or more races population 15 years and over
Males 30.0% Never married41.5% Now married0.0% Separated0.0% Widowed28.5% DivorcedFemales 25.2% Never married44.6% Now married0.0% Separated12.2% Widowed18.0% DivorcedWomen who gave birth in the past 12 months Now married:
0.0% (0)Unmarried:
100.0% (35)
Women who did not give birth in the past 12 months Now married:
14.8% (12)Unmarried:
85.2% (72)
Marital status - White alone, not Hispanic / Latino population 15 years and over
Males 32.5% Never married54.1% Now married1.8% Separated2.0% Widowed9.6% DivorcedFemales 31.0% Never married41.7% Now married0.0% Separated13.2% Widowed14.1% DivorcedWomen who gave birth in the past 12 months Now married:
74.7% (59)Unmarried:
25.3% (20)
Women who did not give birth in the past 12 months Now married:
35.3% (314)Unmarried:
64.7% (577)
Marital status - Hispanic or Latino population 15 years and over
Males 33.5% Never married34.5% Now married0.0% Separated0.0% Widowed32.0% DivorcedFemales 46.0% Never married38.1% Now married0.0% Separated8.8% Widowed7.1% DivorcedWomen who gave birth in the past 12 months Now married:
0.0% (0)Unmarried:
100.0% (26)
Women who did not give birth in the past 12 months Now married:
36.8% (90)Unmarried:
63.2% (154)
Ancestries in Mount Arlington
768 29.6% Italian253 9.8% Irish210 8.1% Egyptian163 6.3% English147 5.7% American123 4.7% German97 3.7% Polish85 3.3% Ukrainian44 1.7% Dutch35 1.4% Norwegian34 1.3% Turkish16 0.6% Slavic11 0.4% Russian9 0.3% Lebanese9 0.3% Greek3 0.1% Celtic
Children Nativity (place of birth) in Mount Arlington
Children under 6 years - Living with two parents Both parents native 105 100.0% NativeBoth parents foreign-born 102 100.0% NativeOne native, one foreign-born parent 64 100.0% NativeChildren under 6 years - Living with one parent Native parent 135 100.0% NativeChildren 6 to 17 years - Living with two parents Both parents native 303 100.0% NativeBoth parents foreign-born 84 72.8% Native31 27.2% Foreign-bornOne native, one foreign-born parent 50 100.0% NativeChildren 6 to 17 years - Living with one parent Native parent 154 100.0% Native
Grandparents responsible for own grandchildren in Mount Arlington
Grandparents (30 to 59 years) White / Caucasian 19 100.0% Responsible for grandchildrenWhite alone, not Hispanic / Latino 19 100.0% Responsible for grandchildrenGrandparents (60 years and over) White / Caucasian 53 48.5% Responsible for grandchildren56 51.5% Not responsible for grandchildrenWhite alone, not Hispanic / Latino 60 49.2% Responsible for grandchildren62 50.8% Not responsible for grandchildren