Races in Mount Clemens, Michigan (MI) Detailed Stats
Ancestries, Foreign-born residents, place of birth
Settings
X


Recent posts about races in Mount Clemens, Michigan on our local forum with over 2,400,000 registered users:
 | Thoughts on Mount Clemens (4 replies) |
| Buying a home in Mount Clemens? (9 replies) |
| Where would you rather live? - Metro Detroit Edition (66 replies) |
| Likes and Dislikes about Metro Detroit (131 replies) |
| Which suburb is most stereotypical of Metro Detroit? (42 replies) |
| Colorado to Michigan (75 replies) |
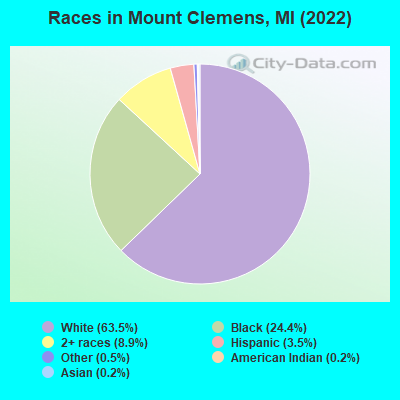
According to 2022 data, the most numerous races in Mount Clemens, MI are White alone (9,904 residents), Black alone (3,806 residents), and Hispanic (550 residents). 96.0% of Mount Clemens residents speak English at home. 1.8% of Mount Clemens, MI residents are foreign-born , which is 232.0% less than the foreign-born rate of 6.0% across the entire state of Michigan.
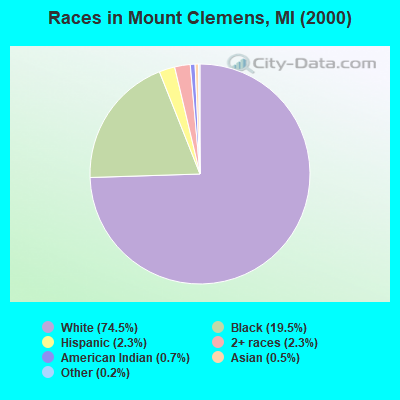
Race distribution in Mount Clemens
2000
2022

- 12,89774.5%White alone
- 3,37519.5%Black alone
- 4042.3%Hispanic
- 3942.3%Two or more races
- 1130.7%American Indian alone
- 850.5%Asian alone
- 410.2%Other race alone
- 30.02%Native Hawaiian and Other
Pacific Islander alone
-
- 9,90463.5%White alone
- 3,80624.4%Black alone
- 1,3918.9%Two or more races
- 5503.5%Hispanic
- 800.5%Other race alone
- 260.2%Asian alone
- 280.2%American Indian alone
2000
2022
-
- 7,806,69178.6%White alone
- 1,402,04714.1%Black alone
- 323,8773.3%Hispanic
- 175,3111.8%Asian alone
- 163,4871.6%Two or more races
- 53,4210.5%American Indian alone
- 11,4650.1%Other race alone
- 2,1450.02%Native Hawaiian and Other
Pacific Islander alone

-
- 7,289,05172.6%White alone
- 1,310,46413.1%Black alone
- 572,4055.7%Hispanic
- 450,0314.5%Two or more races
- 335,7323.3%Asian alone
- 45,2170.5%Other race alone
- 29,0110.3%American Indian alone
- 2,2070.02%Native Hawaiian and Other
Pacific Islander alone

Income and house value in Mount Clemens
- Median household income in 2022
- $66,330White non-Hispanic householders
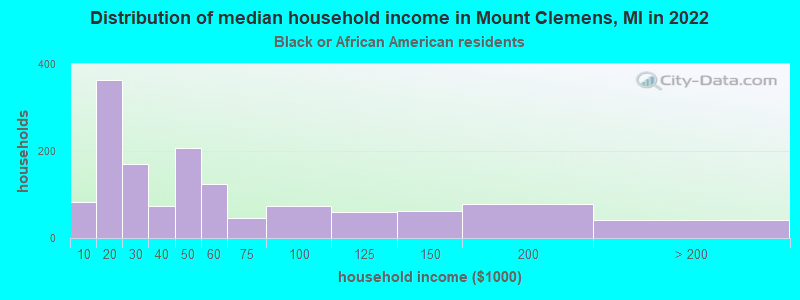
- $31,144Black householders
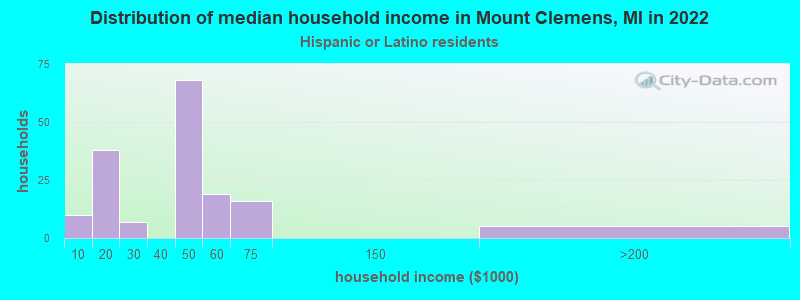
- $42,456Hispanic or Latino race householders
- Median 2022 house value
- $173,435White Non-Hispanic householders
- $158,725Black or African American householders
- $350,633Asian householders
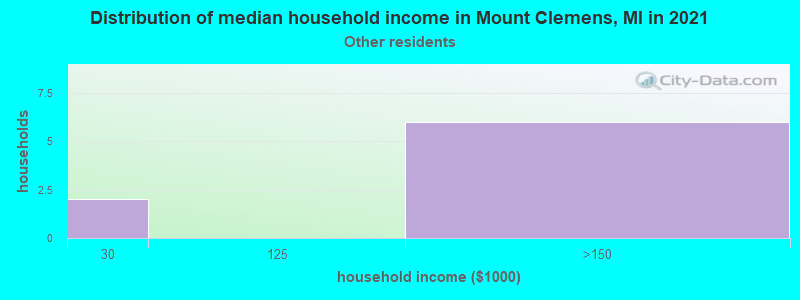
- $128,280Some other race householders
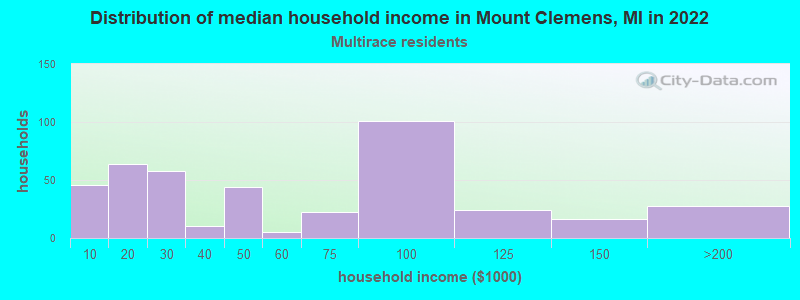
- $158,896Two or more races householders
- $135,635Hispanic or Latino householders
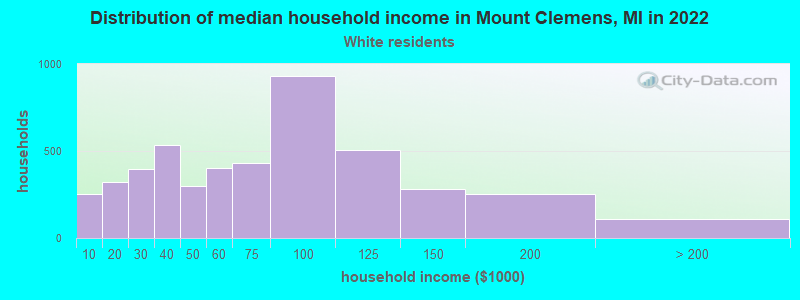
Household income for White non-Hispanic householders
Household income for Black householders
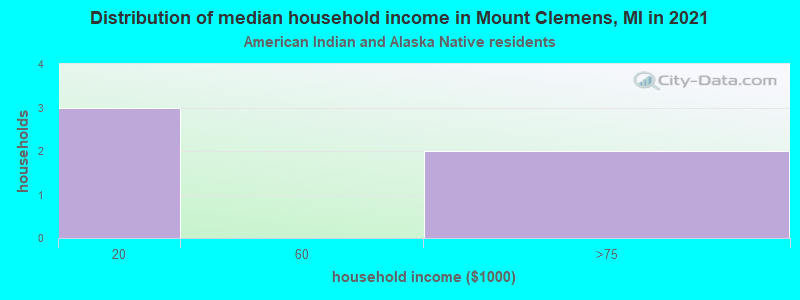
Household income for American Indian and Alaska Native householders
Household income for Some other race householders
Household income for Two or more races householders
Household income for Hispanic or Latino race householders
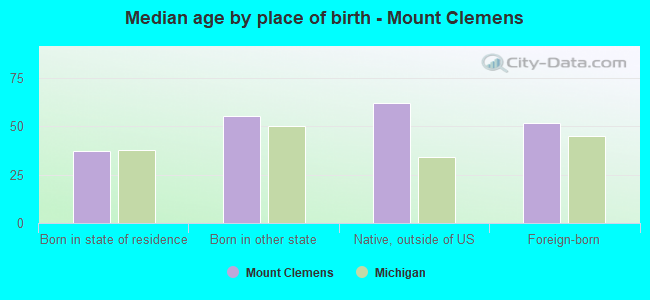
Median age by race in Mount Clemens
- 41.7Median age for White residents
- 40.2Males
- 43.7Females
- 43.5Median age for Black or African American residents
- 42.7Males
- 44.8Females
- 61.0Median age for American Indian / Alaska Native residents
- -553,963,705.3Males
- 74.2Females
- 82.0Median age for Asian residents
- -683,127,571.3Males
- 81.3Females
- -670,531,400.3Median age for Native Hawaiian / Pacific Islander residents
- -674,772,035.8Males
- -699,588,476.7Females
- 29.3Median age for Other race residents
- 36.4Males
- 18.5Females
- 26.8Median age for Two or more races residents
- 28.1Males
- 24.9Females
- 41.8Median age for White alone residents
- 40.4Males
- 43.9Females
- 33.7Median age for Hispanic or Latino residents
- 35.6Males
- 36.2Females
Owner/renter occupied households by race in Mount Clemens
- House owners and renters - White residents
- 3,24968.7%Owner occupied
- 1,48231.3%Renter occupied
- House owners and renters - Black or African American residents
- 49833.5%Owner occupied
- 98866.5%Renter occupied
- House owners and renters - American Indian / Alaska Native residents
- 350.1%Owner occupied
- 349.9%Renter occupied
- House owners and renters - Asian residents
- 15100.0%Owner occupied
- House owners and renters - Other race residents
- 10100.0%Owner occupied
- House owners and renters - Two or more races residents
- 21850.0%Owner occupied
- 21850.0%Renter occupied
- House owners and renters - White alone residents
- 3,21269.1%Owner occupied
- 1,43830.9%Renter occupied
- House owners and renters - Hispanic or Latino residents
- 9152.9%Owner occupied
- 8147.1%Renter occupied
Language usage in Mount Clemens
- English speakers - Total
- 96.0% of residents of Mount Clemens speak English at home.
- 2.0% of residents speak Spanish at home
- 13345.9%Speak English very well
- 15754.1%Speak English less than very well
- 1.7% of residents speak other language at home
- 17368.1%Speak English very well
- 8131.9%Speak English less than very well
- English speakers - Born in the United States
- 96.5% of residents of Mount Clemens speak English at home.
- 2.2% of residents speak Spanish at home
- 2747.4%Speak English very well
- 3052.6%Speak English less than very well
- 0.6% of residents speak other language at home
- 956.2%Speak English very well
- 743.8%Speak English less than very well
- English speakers - Native, born elsewhere
- 73.5% of residents of Mount Clemens speak English at home.
- 29.4% of residents speak other language at home
- 10100.0%Speak English very well
- English speakers - Foreign-born
- 26.4% of residents of Mount Clemens speak English at home.
- 27.4% of residents speak Spanish at home
- 1114.5%Speak English very well
- 6585.5%Speak English less than very well
- 38.6% of residents speak other language at home
- 7469.2%Speak English very well
- 3330.8%Speak English less than very well
White (Caucasian) - Speak only English
| Native: | 98.5% (9,384) |
| Foreign-born: | 35.8% (43) |
White (Caucasian) - Speak another language
| Native: | 1.5% (143) |
| Foreign-born: | 63.3% (76) |
Black or African American - Speak another language
| Native: | 1.3% (45) |
| Foreign-born: | 100.0% (8) |
American Indian / Alaska Native - Speak only English
| Native: | 92.4% (30) |
| Foreign-born: | 91.6% (4) |
Two or more races - Speak only English
| Native: | 87.2% (1,189) |
| Foreign-born: | 5.0% (6) |
Two or more races - Speak another language
| Native: | 13.4% (183) |
| Foreign-born: | 96.7% (125) |
White alone - Speak only English
| Native: | 98.3% (9,247) |
| Foreign-born: | 40.5% (44) |
White alone - Speak another language
| Native: | 1.5% (140) |
| Foreign-born: | 58.3% (63) |
Hispanic or Latino - Speak another language
| Native: | 22.6% (105) |
| Foreign-born: | 100.0% (76) |
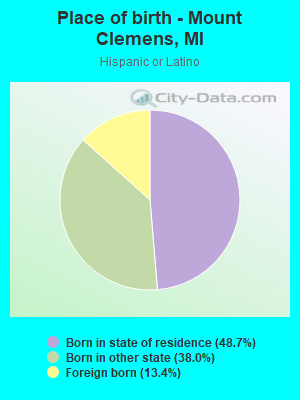
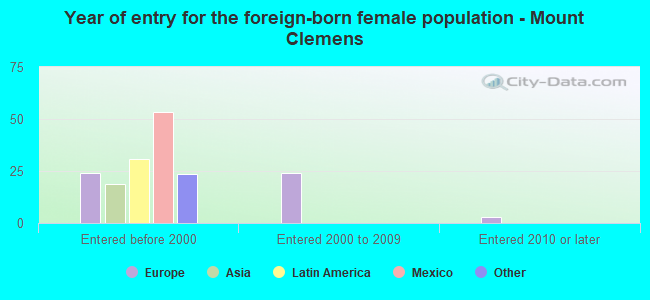
Foreign-born residents in Mount Clemens
282 residents are foreign born
| This city: | 1.8% |
| Michigan: | 6.9% |
Marital status for residents in Mount Clemens
Marital status - White (Caucasian) population 15 years and over
- Males
- 39.2%Never married
- 37.3%Now married
- 2.0%Separated
- 4.9%Widowed
- 16.6%Divorced
- Females
- 28.8%Never married
- 39.6%Now married
- 0.5%Separated
- 13.3%Widowed
- 17.8%Divorced
Women who gave birth in the past 12 months
| Now married: | 92.4% (105) |
| Unmarried: | 7.6% (9) |
Women who did not give birth in the past 12 months
| Now married: | 37.0% (746) |
| Unmarried: | 63.0% (1,269) |
Marital status - Black or African American population 15 years and over
- Males
- 44.8%Never married
- 26.6%Now married
- 0.0%Separated
- 1.2%Widowed
- 27.4%Divorced
- Females
- 48.2%Never married
- 23.2%Now married
- 4.1%Separated
- 8.9%Widowed
- 15.5%Divorced
Women who gave birth in the past 12 months
| Now married: | 95.8% (42) |
| Unmarried: | 4.2% (2) |
Women who did not give birth in the past 12 months
| Now married: | 21.0% (188) |
| Unmarried: | 79.0% (705) |
Marital status - American Indian / Alaska Native population 15 years and over
- Males
- 100.0%Never married
- 0.0%Now married
- 0.0%Separated
- 0.0%Widowed
- 0.0%Divorced
- Females
- 0.0%Never married
- 79.3%Now married
- 0.0%Separated
- 0.0%Widowed
- 20.7%Divorced
Marital status - Asian population 15 years and over
- Males
- 100.0%Never married
- 0.0%Now married
- 0.0%Separated
- 0.0%Widowed
- 0.0%Divorced
- Females
- 0.0%Never married
- 13.6%Now married
- 0.0%Separated
- 86.4%Widowed
- 0.0%Divorced
Marital status - Other race population 15 years and over
- Males
- 33.7%Never married
- 8.1%Now married
- 58.1%Separated
- 0.0%Widowed
- 0.0%Divorced
- Females
- 100.0%Never married
- 0.0%Now married
- 0.0%Separated
- 0.0%Widowed
- 0.0%Divorced
Women who did not give birth in the past 12 months
| Now married: | 0.0% (0) |
| Unmarried: | 100.0% (30) |
Marital status - Two or more races population 15 years and over
- Males
- 55.0%Never married
- 32.0%Now married
- 1.7%Separated
- 4.2%Widowed
- 7.1%Divorced
- Females
- 52.4%Never married
- 27.3%Now married
- 0.6%Separated
- 5.2%Widowed
- 14.6%Divorced
Women who gave birth in the past 12 months
| Now married: | 70.6% (30) |
| Unmarried: | 29.4% (13) |
Women who did not give birth in the past 12 months
| Now married: | 18.8% (98) |
| Unmarried: | 81.2% (423) |
Marital status - White alone, not Hispanic / Latino population 15 years and over
- Males
- 39.2%Never married
- 37.0%Now married
- 2.0%Separated
- 5.1%Widowed
- 16.8%Divorced
- Females
- 28.6%Never married
- 39.8%Now married
- 0.5%Separated
- 13.4%Widowed
- 17.7%Divorced
Women who gave birth in the past 12 months
| Now married: | 92.4% (105) |
| Unmarried: | 7.6% (9) |
Women who did not give birth in the past 12 months
| Now married: | 37.3% (747) |
| Unmarried: | 62.7% (1,257) |
Marital status - Hispanic or Latino population 15 years and over
- Males
- 35.6%Never married
- 38.5%Now married
- 23.4%Separated
- 0.0%Widowed
- 2.5%Divorced
- Females
- 39.7%Never married
- 7.8%Now married
- 0.0%Separated
- 17.2%Widowed
- 35.3%Divorced
Women who did not give birth in the past 12 months
| Now married: | 0.0% (0) |
| Unmarried: | 100.0% (80) |
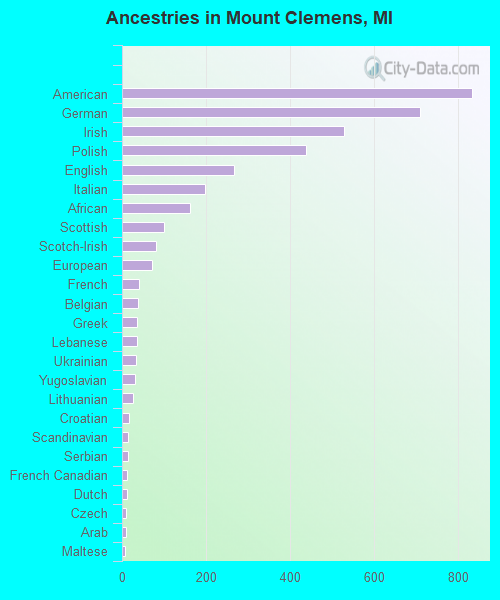
Ancestries in Mount Clemens

- 83312.3%American
- 71110.5%German
- 5307.8%Irish
- 4396.5%Polish
- 2673.9%English
- 1972.9%Italian
- 1622.4%African
- 1001.5%Scottish
- 801.2%Scotch-Irish
- 721.1%European
- 410.6%French
- 370.5%Belgian
- 360.5%Greek
- 350.5%Lebanese
- 330.5%Ukrainian
- 300.4%Yugoslavian
- 260.4%Lithuanian
- 160.2%Croatian
- 150.2%Scandinavian
- 140.2%Serbian
- 130.2%French Canadian
- 120.2%Dutch
- 100.1%Czech
- 90.1%Arab
- 80.1%Maltese
- 80.1%Canadian
- 70.1%Albanian
- 60.09%Egyptian
- 50.07%Finnish
- 50.07%Slovak
- 40.06%Eastern European
- 40.06%Romanian
- 40.06%Russian
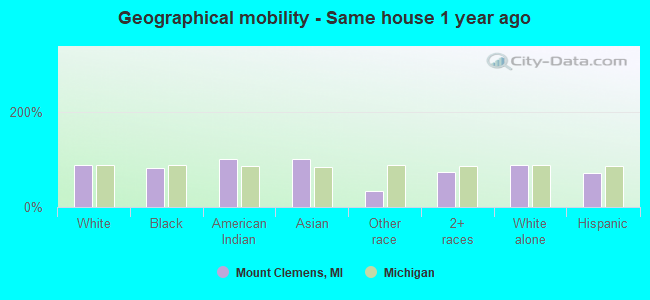
Geographical mobility in Mount Clemens

- Same house 1 year ago
- 8,65286.9%White (Caucasian)
- 3,05381.1%Black or African American
- 38100.0%American Indian / Alaska Native
- 2799.5%Asian
- 5533.2%Other race
- 1,22373.6%Two or more races
- 8,55987.2%White alone, not Hispanic / Latino
- 39170.6%Hispanic or Latino
-
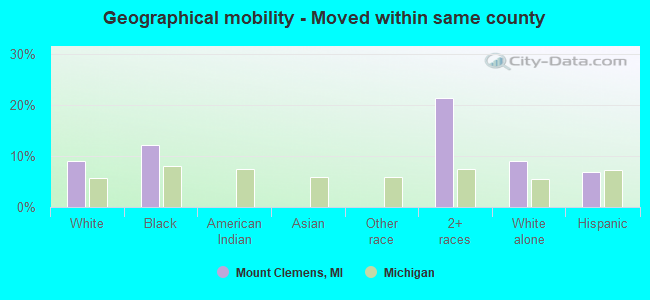
- Moved within same county
- 8888.9%White / Caucasian
- 45612.1%Black or African American
- 35321.3%Two or more races
- 8809.0%White alone, not Hispanic / Latino
- 386.8%Hispanic or Latino
-
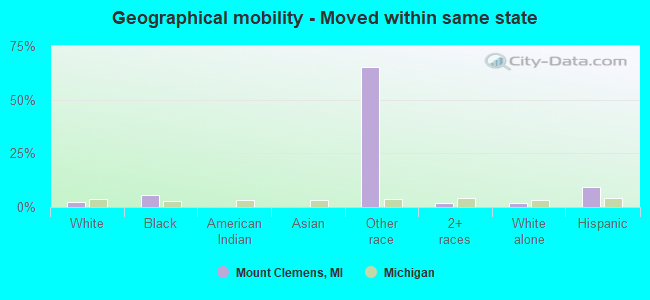
- Moved within same state
- 2142.1%White / Caucasian
- 2035.4%Black or African American
- 10865.3%Other race
- 291.7%Two or more races
- 1932.0%White alone, not Hispanic / Latino
- 519.2%Hispanic or Latino
-
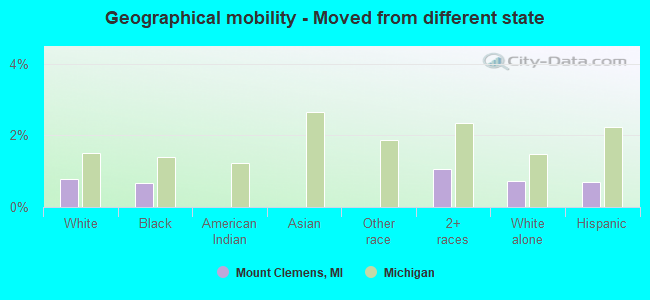
- Moved from different state
- 770.8%White / Caucasian
- 250.7%Black or African American
- 181.1%Two or more races
- 710.7%White alone, not Hispanic / Latino
- 40.7%Hispanic or Latino
-
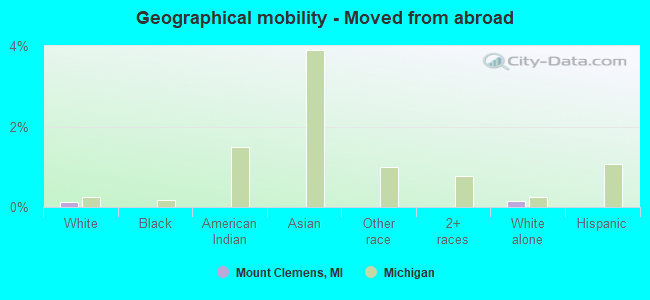
- Moved from abroad
- 130.1%White
- 140.1%White alone, not Hispanic / Latino
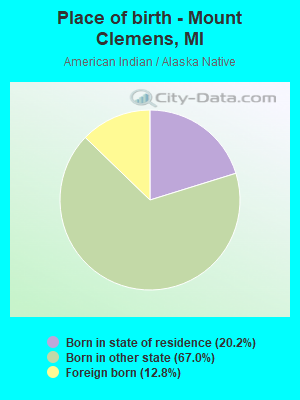
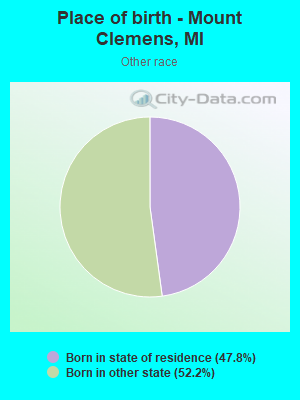
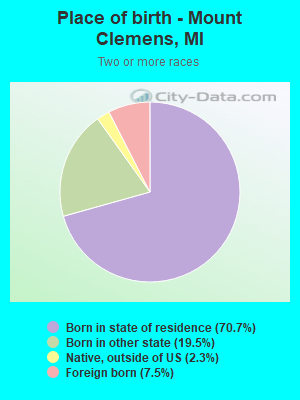
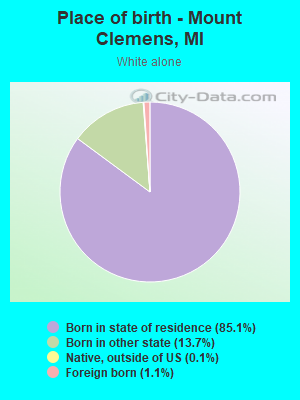
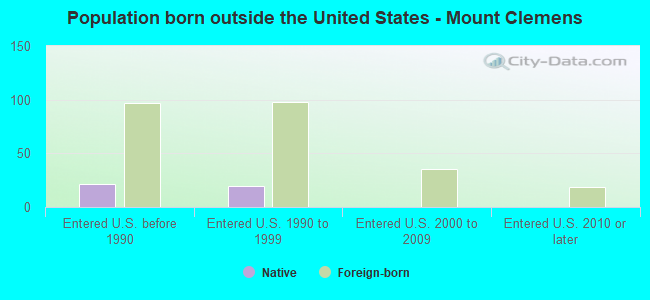
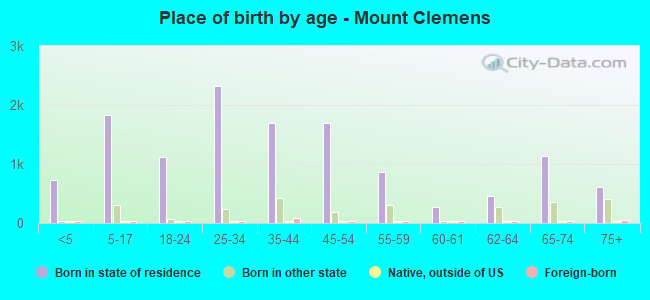
Children Nativity (place of birth) in Mount Clemens
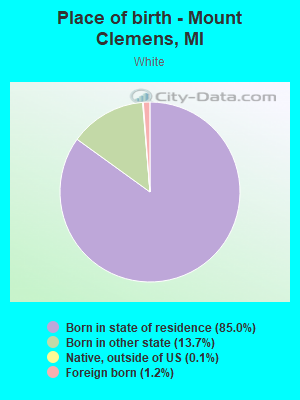
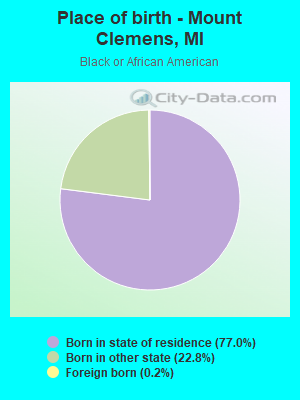
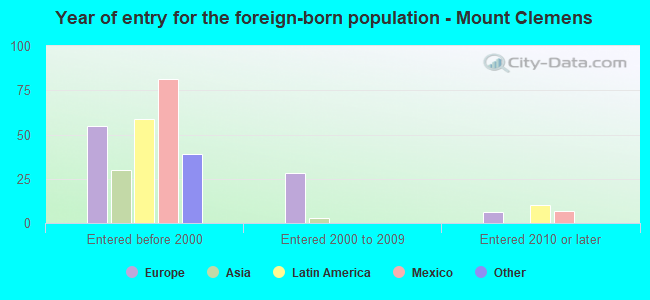
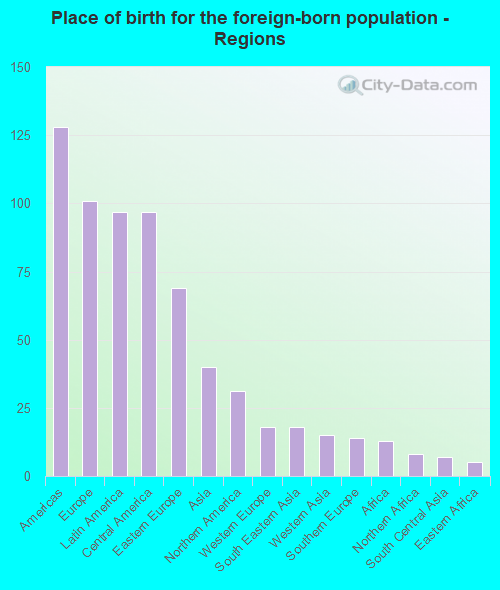
Place of birth for residents in Mount Clemens
![Place of birth for the foreign-born population - Regions]()
- 128Americas
- 101Europe
- 97Latin America
- 97Central America
- 69Eastern Europe
- 40Asia
- 31Northern America
- 18Western Europe
- 18South Eastern Asia
- 15Western Asia
- 14Southern Europe
- 13Africa
- 8Northern Africa
- 7South Central Asia
- 5Eastern Africa
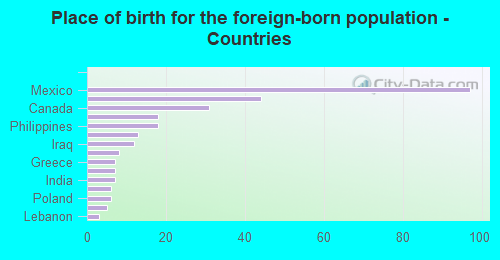
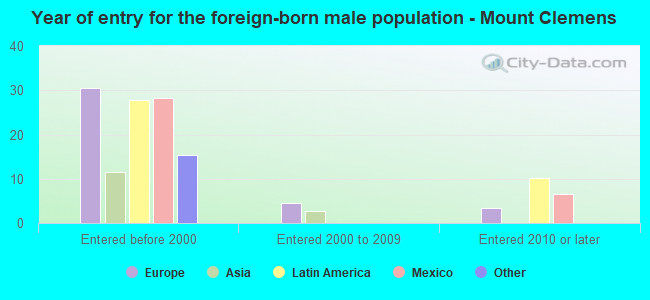
![Place of birth for the foreign-born population - Countries]()
- 97Mexico
- 44Bosnia and Herzegovina
- 31Canada
- 18Germany
- 18Philippines
- 13Russia
- 12Iraq
- 8Egypt
- 7Greece
- 7Italy
- 7India
- 6Albania
- 6Poland
- 5Ethiopia
- 3Lebanon