Races in Mount Ivy, New York (NY) Detailed Stats
Data:
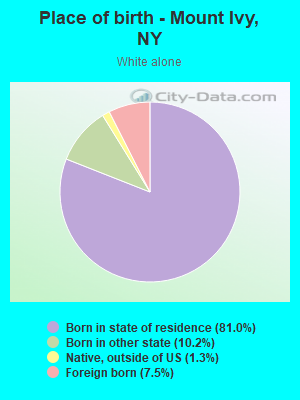
Races - White alone (%)
Races - White alone (% change since 2000)
Races - Black alone (%)
Races - Black alone (% change since 2000)
Races - American Indian alone (%)
Races - American Indian alone (% change since 2000)
Races - Asian alone (%)
Races - Asian alone (% change since 2000)
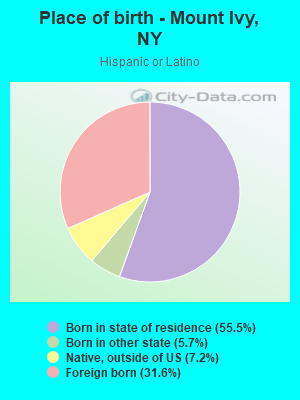
Races - Hispanic (%)
Races - Hispanic (% change since 2000)
Races - Native Hawaiian and Other Pacific Islander alone (%)
Races - Native Hawaiian and Other Pacific Islander alone (% change since 2000)
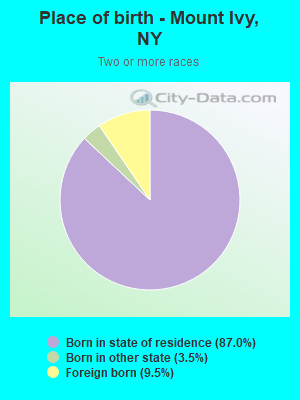
Races - Two or more races(%)
Races - Two or more races(% change since 2000)
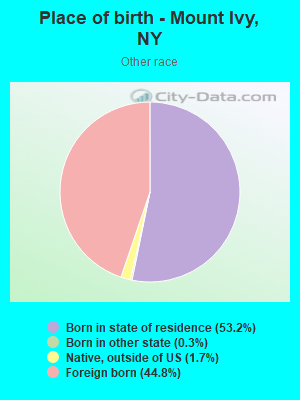
Races - Other race alone (%)
Races - Other race alone (% change since 2000)
Racial diversity
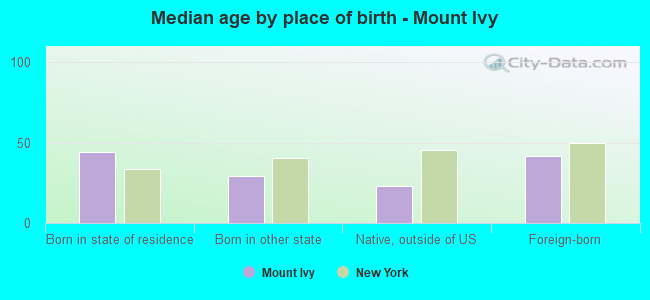
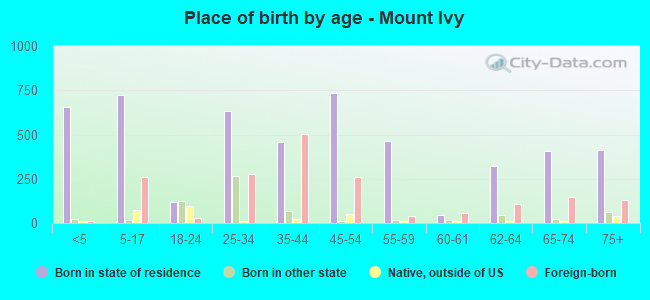
Place of birth - Born in state of residence (%)
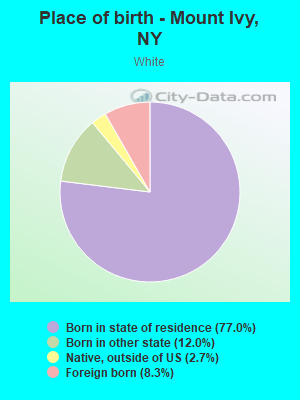
Place of birth - Born in state of residence (%) - White
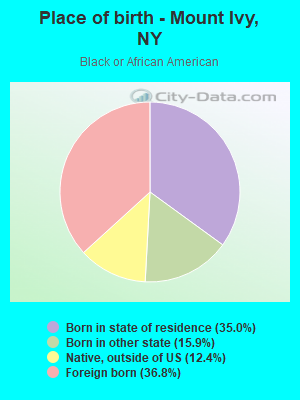
Place of birth - Born in state of residence (%) - Black or African American
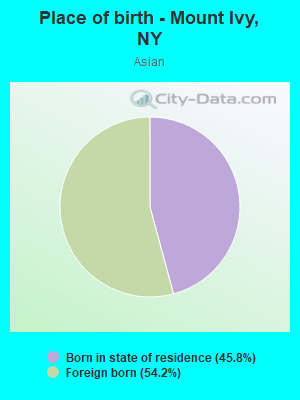
Place of birth - Born in state of residence (%) - Asian
Place of birth - Born in state of residence (%) - Hispanic or Latino
Place of birth - Born in state of residence (%) - American Indian and Alaska Native
Place of birth - Born in state of residence (%) - Multirace
Place of birth - Born in state of residence (%) - Other Race
Place of birth - Born in other state (%)
Place of birth - Born in other state (%) - White
Place of birth - Born in other state (%) - Black or African American
Place of birth - Born in other state (%) - Asian
Place of birth - Born in other state (%) - Hispanic or Latino
Place of birth - Born in other state (%) - American Indian and Alaska Native
Place of birth - Born in other state (%) - Multirace
Place of birth - Born in other state (%) - Other Race
Place of birth - Native, outside of US (%)
Place of birth - Native, outside of US (%) - White
Place of birth - Native, outside of US (%) - Black or African American
Place of birth - Native, outside of US (%) - Asian
Place of birth - Native, outside of US (%) - Hispanic or Latino
Place of birth - Native, outside of US (%) - American Indian and Alaska Native
Place of birth - Native, outside of US (%) - Multirace
Place of birth - Native, outside of US (%) - Other Race
Place of birth - Foreign born (%)
Place of birth - Foreign born (%) - White
Place of birth - Foreign born (%) - Black or African American
Place of birth - Foreign born (%) - Asian
Place of birth - Foreign born (%) - Hispanic or Latino
Place of birth - Foreign born (%) - American Indian and Alaska Native
Place of birth - Foreign born (%) - Multirace
Place of birth - Foreign born (%) - Other Race
Residents speaking English at home (%)
Residents speaking English at home - Born in the United States (%)
Residents speaking English at home - Native, born elsewhere (%)
Residents speaking English at home - Foreign born (%)
Residents speaking Spanish at home (%)
Residents speaking Spanish at home - Born in the United States (%)
Residents speaking Spanish at home - Native, born elsewhere (%)
Residents speaking Spanish at home - Foreign born (%)
Residents speaking other language at home (%)
Residents speaking other language at home - Born in the United States (%)
Residents speaking other language at home - Native, born elsewhere (%)
Residents speaking other language at home - Foreign born (%)
Marital status - Never married (%)
Marital status - Now married (%)
Marital status - Separated (%)
Marital status - Widowed (%)
Marital status - Divorced (%)
Ancestries Reported - Arab (%)
Ancestries Reported - Czech (%)
Ancestries Reported - Danish (%)
Ancestries Reported - Dutch (%)
Ancestries Reported - English (%)
Ancestries Reported - French (%)
Ancestries Reported - French Canadian (%)
Ancestries Reported - German (%)
Ancestries Reported - Greek (%)
Ancestries Reported - Hungarian (%)
Ancestries Reported - Irish (%)
Ancestries Reported - Italian (%)
Ancestries Reported - Lithuanian (%)
Ancestries Reported - Norwegian (%)
Ancestries Reported - Polish (%)
Ancestries Reported - Portuguese (%)
Ancestries Reported - Russian (%)
Ancestries Reported - Scotch-Irish (%)
Ancestries Reported - Scottish (%)
Ancestries Reported - Slovak (%)
Ancestries Reported - Subsaharan African (%)
Ancestries Reported - Swedish (%)
Ancestries Reported - Swiss (%)
Ancestries Reported - Ukrainian (%)
Ancestries Reported - United States (%)
Ancestries Reported - Welsh (%)
Ancestries Reported - West Indian (%)
Ancestries Reported - Other (%)
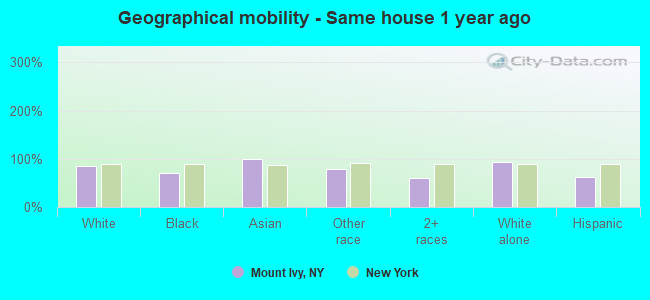
Geographical mobility - Same house 1 year ago (%)
Geographical mobility - Same house 1 year ago (%) - White
Geographical mobility - Same house 1 year ago (%) - Black or African American
Geographical mobility - Same house 1 year ago (%) - Asian
Geographical mobility - Same house 1 year ago (%) - Hispanic or Latino
Geographical mobility - Same house 1 year ago (%) - American Indian and Alaska Native
Geographical mobility - Same house 1 year ago (%) - Multirace
Geographical mobility - Same house 1 year ago (%) - Other Race
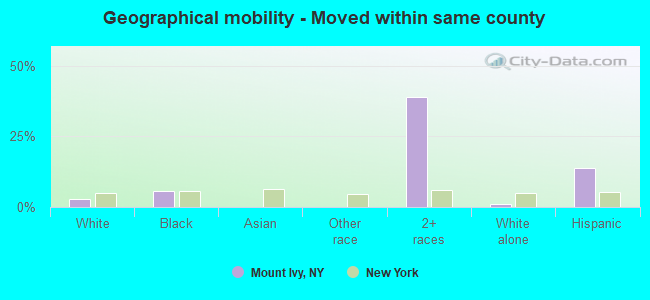
Geographical mobility - Moved within same county (%)
Geographical mobility - Moved within same county (%) - White
Geographical mobility - Moved within same county (%) - Black or African American
Geographical mobility - Moved within same county (%) - Asian
Geographical mobility - Moved within same county (%) - Hispanic or Latino
Geographical mobility - Moved within same county (%) - American Indian and Alaska Native
Geographical mobility - Moved within same county (%) - Multirace
Geographical mobility - Moved within same county (%) - Other Race
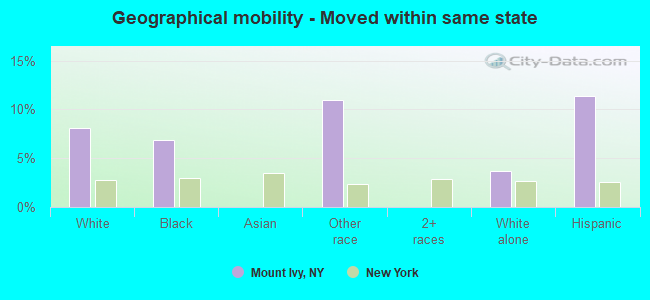
Geographical mobility - Moved from different county within same state (%)
Geographical mobility - Moved from different county within same state (%) - White
Geographical mobility - Moved from different county within same state (%) - Black or African American
Geographical mobility - Moved from different county within same state (%) - Asian
Geographical mobility - Moved from different county within same state (%) - Hispanic or Latino
Geographical mobility - Moved from different county within same state (%) - American Indian and Alaska Native
Geographical mobility - Moved from different county within same state (%) - Multirace
Geographical mobility - Moved from different county within same state (%) - Other Race
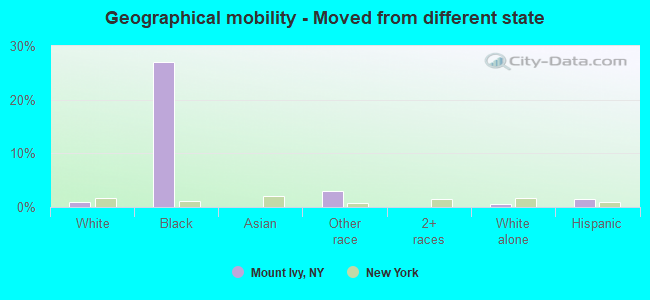
Geographical mobility - Moved from different state (%)
Geographical mobility - Moved from different state (%) - White
Geographical mobility - Moved from different state (%) - Black or African American
Geographical mobility - Moved from different state (%) - Asian
Geographical mobility - Moved from different state (%) - Hispanic or Latino
Geographical mobility - Moved from different state (%) - American Indian and Alaska Native
Geographical mobility - Moved from different state (%) - Multirace
Geographical mobility - Moved from different state (%) - Other Race
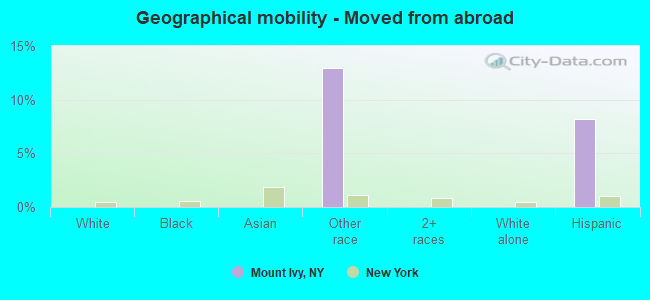
Geographical mobility - Moved from abroad (%)
Geographical mobility - Moved from abroad (%) - White
Geographical mobility - Moved from abroad (%) - Black or African American
Geographical mobility - Moved from abroad (%) - Asian
Geographical mobility - Moved from abroad (%) - Hispanic or Latino
Geographical mobility - Moved from abroad (%) - American Indian and Alaska Native
Geographical mobility - Moved from abroad (%) - Multirace
Geographical mobility - Moved from abroad (%) - Other Race
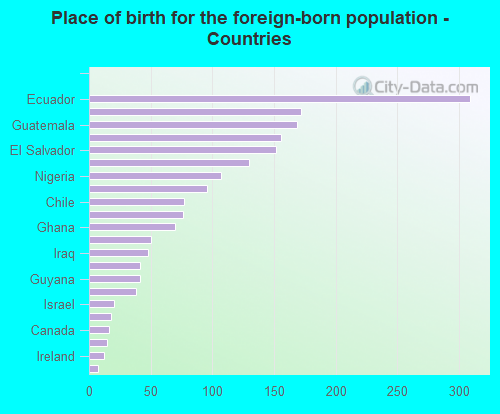
Place of birth for the foreign-born population - Ireland (%)
Place of birth for the foreign-born population - Denmark (%)
Place of birth for the foreign-born population - Norway (%)
Place of birth for the foreign-born population - Sweden (%)
Place of birth for the foreign-born population - United Kingdom (%)
Place of birth for the foreign-born population - England (%)
Place of birth for the foreign-born population - Scotland (%)
Place of birth for the foreign-born population - Other Northern Europe (%)
Place of birth for the foreign-born population - Austria (%)
Place of birth for the foreign-born population - Belgium (%)
Place of birth for the foreign-born population - France (%)
Place of birth for the foreign-born population - Germany (%)
Place of birth for the foreign-born population - Netherlands (%)
Place of birth for the foreign-born population - Switzerland (%)
Place of birth for the foreign-born population - Other Western Europe (%)
Place of birth for the foreign-born population - Greece (%)
Place of birth for the foreign-born population - Italy (%)
Place of birth for the foreign-born population - Portugal (%)
Place of birth for the foreign-born population - Spain (%)
Place of birth for the foreign-born population - Other Southern Europe (%)
Place of birth for the foreign-born population - Albania (%)
Place of birth for the foreign-born population - Belarus (%)
Place of birth for the foreign-born population - Bosnia and Herzegovina (%)
Place of birth for the foreign-born population - Bulgaria (%)
Place of birth for the foreign-born population - Croatia (%)
Place of birth for the foreign-born population - Czechoslovakia (%)
Place of birth for the foreign-born population - Hungary (%)
Place of birth for the foreign-born population - Latvia (%)
Place of birth for the foreign-born population - Lithuania (%)
Place of birth for the foreign-born population - North Macedonia (Macedonia) (%)
Place of birth for the foreign-born population - Moldova (%)
Place of birth for the foreign-born population - Poland (%)
Place of birth for the foreign-born population - Romania (%)
Place of birth for the foreign-born population - Russia (%)
Place of birth for the foreign-born population - Serbia (%)
Place of birth for the foreign-born population - Ukraine (%)
Place of birth for the foreign-born population - Other Eastern Europe (%)
Place of birth for the foreign-born population - China (%)
Place of birth for the foreign-born population - Hong Kong (%)
Place of birth for the foreign-born population - Taiwan (%)
Place of birth for the foreign-born population - Japan (%)
Place of birth for the foreign-born population - Korea (%)
Place of birth for the foreign-born population - Other Eastern Asia (%)
Place of birth for the foreign-born population - Afghanistan (%)
Place of birth for the foreign-born population - Bangladesh (%)
Place of birth for the foreign-born population - India (%)
Place of birth for the foreign-born population - Iran (%)
Place of birth for the foreign-born population - Kazakhstan (%)
Place of birth for the foreign-born population - Nepal (%)
Place of birth for the foreign-born population - Pakistan (%)
Place of birth for the foreign-born population - Sri Lanka (%)
Place of birth for the foreign-born population - Uzbekistan (%)
Place of birth for the foreign-born population - Other South Central Asia (%)
Place of birth for the foreign-born population - Burma (%)
Place of birth for the foreign-born population - Cambodia (%)
Place of birth for the foreign-born population - Indonesia (%)
Place of birth for the foreign-born population - Laos (%)
Place of birth for the foreign-born population - Malaysia (%)
Place of birth for the foreign-born population - Philippines (%)
Place of birth for the foreign-born population - Singapore (%)
Place of birth for the foreign-born population - Thailand (%)
Place of birth for the foreign-born population - Vietnam (%)
Place of birth for the foreign-born population - Other South Eastern Asia (%)
Place of birth for the foreign-born population - Armenia (%)
Place of birth for the foreign-born population - Iraq (%)
Place of birth for the foreign-born population - Israel (%)
Place of birth for the foreign-born population - Jordan (%)
Place of birth for the foreign-born population - Kuwait (%)
Place of birth for the foreign-born population - Lebanon (%)
Place of birth for the foreign-born population - Saudi Arabia (%)
Place of birth for the foreign-born population - Syria (%)
Place of birth for the foreign-born population - Turkey (%)
Place of birth for the foreign-born population - Yemen (%)
Place of birth for the foreign-born population - Other Western Asia (%)
Place of birth for the foreign-born population - Eritrea (%)
Place of birth for the foreign-born population - Ethiopia (%)
Place of birth for the foreign-born population - Kenya (%)
Place of birth for the foreign-born population - Somalia (%)
Place of birth for the foreign-born population - Uganda (%)
Place of birth for the foreign-born population - Zimbabwe (%)
Place of birth for the foreign-born population - Other Eastern Africa (%)
Place of birth for the foreign-born population - Cameroon (%)
Place of birth for the foreign-born population - Congo (%)
Place of birth for the foreign-born population - Democratic Republic of Congo (Zaire) (%)
Place of birth for the foreign-born population - Other Middle Africa (%)
Place of birth for the foreign-born population - Egypt (%)
Place of birth for the foreign-born population - Morocco (%)
Place of birth for the foreign-born population - Sudan (%)
Place of birth for the foreign-born population - Other Northern Africa (%)
Place of birth for the foreign-born population - South Africa (%)
Place of birth for the foreign-born population - Other Southern Africa (%)
Place of birth for the foreign-born population - Cabo Verde (%)
Place of birth for the foreign-born population - Ghana (%)
Place of birth for the foreign-born population - Liberia (%)
Place of birth for the foreign-born population - Nigeria (%)
Place of birth for the foreign-born population - Senegal (%)
Place of birth for the foreign-born population - Sierra Leone (%)
Place of birth for the foreign-born population - Other Western Africa (%)
Place of birth for the foreign-born population - Australia (%)
Place of birth for the foreign-born population - New Zealand (%)
Place of birth for the foreign-born population - Fiji (%)
Place of birth for the foreign-born population - Micronesia (%)
Place of birth for the foreign-born population - Bahamas (%)
Place of birth for the foreign-born population - Barbados (%)
Place of birth for the foreign-born population - Cuba (%)
Place of birth for the foreign-born population - Dominica (%)
Place of birth for the foreign-born population - Dominican Republic (%)
Place of birth for the foreign-born population - Grenada (%)
Place of birth for the foreign-born population - Haiti (%)
Place of birth for the foreign-born population - Jamaica (%)
Place of birth for the foreign-born population - St. Vincent and the Grenadines (%)
Place of birth for the foreign-born population - Trinidad and Tobago (%)
Place of birth for the foreign-born population - West Indies (%)
Place of birth for the foreign-born population - Other Caribbean (%)
Place of birth for the foreign-born population - Belize (%)
Place of birth for the foreign-born population - Costa Rica (%)
Place of birth for the foreign-born population - El Salvador (%)
Place of birth for the foreign-born population - Guatemala (%)
Place of birth for the foreign-born population - Honduras (%)
Place of birth for the foreign-born population - Mexico (%)
Place of birth for the foreign-born population - Nicaragua (%)
Place of birth for the foreign-born population - Panama (%)
Place of birth for the foreign-born population - Other Central America (%)
Place of birth for the foreign-born population - Argentina (%)
Place of birth for the foreign-born population - Bolivia (%)
Place of birth for the foreign-born population - Brazil (%)
Place of birth for the foreign-born population - Chile (%)
Place of birth for the foreign-born population - Colombia (%)
Place of birth for the foreign-born population - Ecuador (%)
Place of birth for the foreign-born population - Guyana (%)
Place of birth for the foreign-born population - Peru (%)
Place of birth for the foreign-born population - Uruguay (%)
Place of birth for the foreign-born population - Venezuela (%)
Place of birth for the foreign-born population - Other South America (%)
Place of birth for the foreign-born population - Canada (%)
Place of birth for the foreign-born population - Other Northern America (%)
Place of birth for the foreign-born population - Other (%)
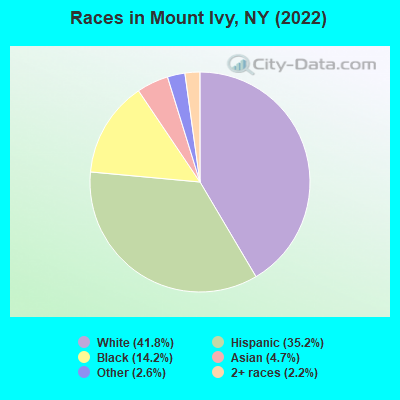
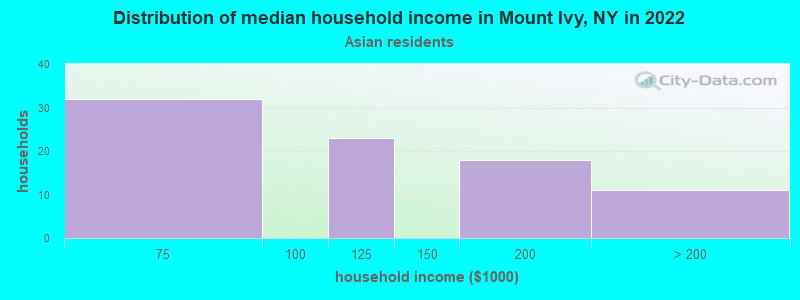
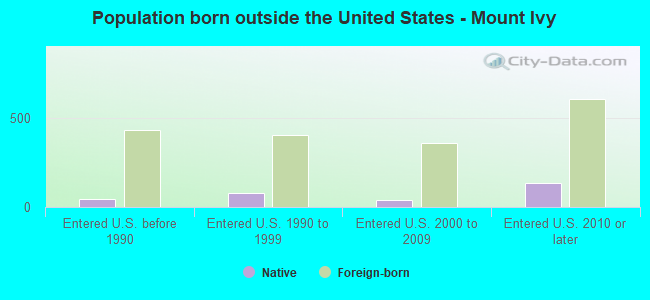
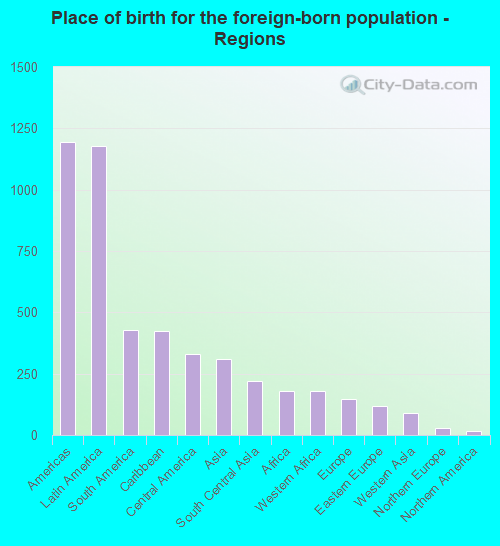
According to 2022 data, the most numerous races in Mount Ivy, NY are White alone (3,249 residents), Hispanic (2,735 residents), and Black alone (1,106 residents). 72.6% of Mount Ivy residents speak English at home. 23.6% of Mount Ivy, NY residents are foreign-born (15.4% born in Latin America, 4.1% born in Asia), which is 6.7% greater than the foreign-born rate of 22.0% across the entire state of New York.
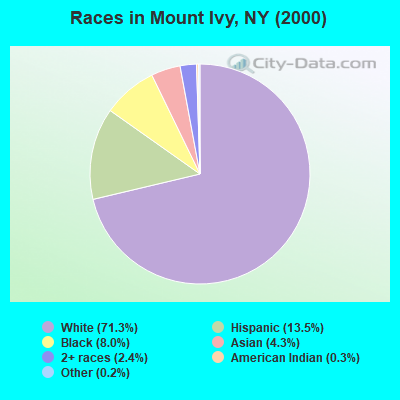
Race distribution in Mount Ivy
2000 2022
11,760,981 62.0% White alone 2,867,583 15.1% Hispanic 2,812,623 14.8% Black alone 1,035,926 5.5% Asian alone 366,116 1.9% Two or more races 75,499 0.4% Other race alone 52,499 0.3% American Indian alone 5,230 0.03% Native Hawaiian and Other
10,408,933 52.9% White alone 3,867,299 19.7% Hispanic 2,633,840 13.4% Black alone 1,776,286 9.0% Asian alone 732,670 3.7% Two or more races 216,110 1.1% Other race alone 35,082 0.2% American Indian alone 6,931 0.04% Native Hawaiian and Other
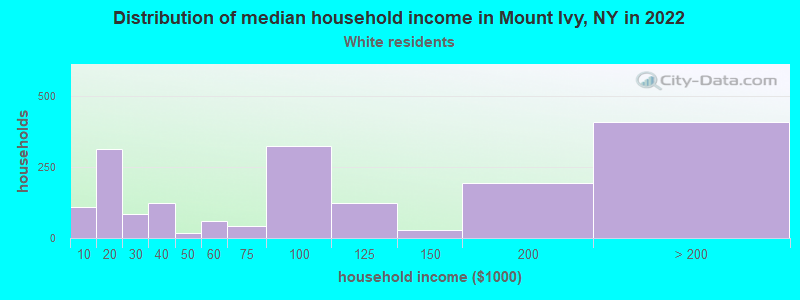
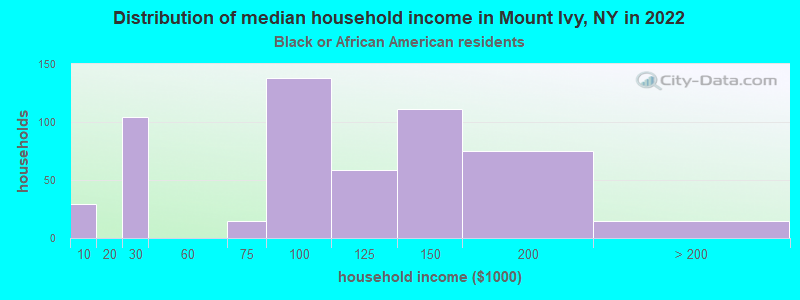
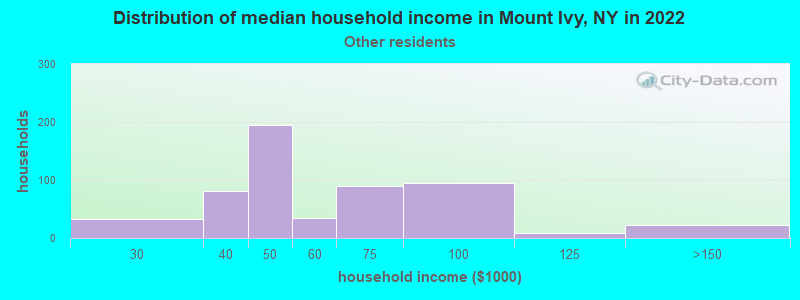
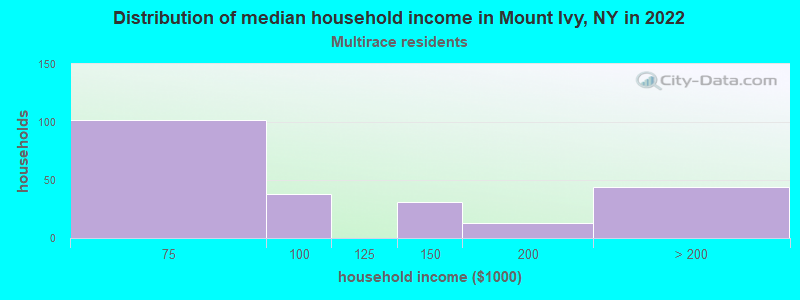
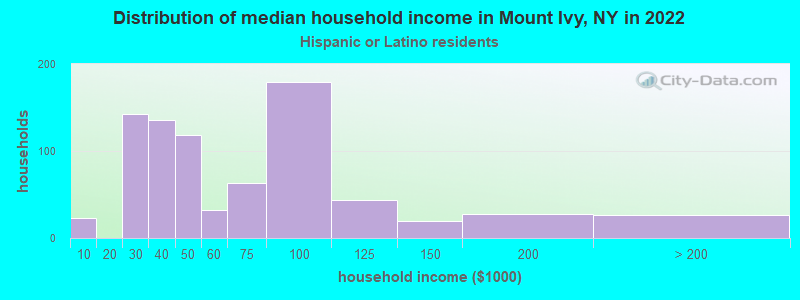
Income and house value in Mount Ivy Median household income in 2022 $76,704 White non-Hispanic householders$93,703 Black householders$91,824 Asian householders$48,772 Some other race householders$126,895 Two or more races householders$63,381 Hispanic or Latino race householdersMedian 2022 house value $478,358 White Non-Hispanic householders$351,876 Black or African American householders $839,665 Asian householders$392,988 Some other race householders$665,057 Two or more races householders$538,334 Hispanic or Latino householders
Median age by race in Mount Ivy
51.6 Median age for White residents50.7 55.6 30.2 Median age for Black or African American residents23.3 38.0 -666,666,666.0 Median age for American Indian / Alaska Native residents-750,656,167.2 -644,444,443.8 36.6 Median age for Asian residents33.9 48.7 -463,937,621.4 Median age for Native Hawaiian / Pacific Islander residents-649,572,648.9 -666,666,666.0 30.3 Median age for Other race residents30.7 31.1 5.0 Median age for Two or more races residents11.5 4.7 57.2 Median age for White alone residents52.2 58.3 25.7 Median age for Hispanic or Latino residents28.9 24.4
Owner/renter occupied households by race in Mount Ivy
House owners and renters - White residents 1,253 69.6% Owner occupied547 30.4% Renter occupiedHouse owners and renters - Black or African American residents 334 62.2% Owner occupied203 37.8% Renter occupiedHouse owners and renters - Asian residents 68 90.7% Owner occupied7 9.3% Renter occupiedHouse owners and renters - Other race residents 237 49.2% Owner occupied245 50.8% Renter occupiedHouse owners and renters - Two or more races residents 143 55.9% Owner occupied113 44.1% Renter occupiedHouse owners and renters - White alone residents 1,246 73.6% Owner occupied448 26.4% Renter occupiedHouse owners and renters - Hispanic or Latino residents 203 26.8% Owner occupied554 73.2% Renter occupied
Language usage in Mount Ivy
English speakers - Total 72.6% of residents of Mount Ivy speak English at home.
18.0% of residents speak Spanish at home 561 44.1% Speak English very well712 55.9% Speak English less than very well10.1% of residents speak other language at home 347 48.5% Speak English very well369 51.5% Speak English less than very well
English speakers - Born in the United States 89.1% of residents of Mount Ivy speak English at home.
9.8% of residents speak Spanish at home 27 42.9% Speak English very well36 57.1% Speak English less than very well3.4% of residents speak other language at home 22 100.0% Speak English very well
English speakers - Native, born elsewhere 43.0% of residents of Mount Ivy speak English at home.
58.4% of residents speak Spanish at home 94 56.3% Speak English very well73 43.7% Speak English less than very well
English speakers - Foreign-born 24.6% of residents of Mount Ivy speak English at home.
43.3% of residents speak Spanish at home 247 31.9% Speak English very well528 68.1% Speak English less than very well31.9% of residents speak other language at home 258 45.2% Speak English very well313 54.8% Speak English less than very well
White (Caucasian) - Speak only English Native:
95.5% (3,255)Foreign-born:
45.6% (143)
White (Caucasian) - Speak another language Native:
6.3% (214)Foreign-born:
57.1% (179)
Black or African American - Speak only English Native:
86.1% (577)Foreign-born:
54.5% (237)
Black or African American - Speak another language Native:
13.5% (91)Foreign-born:
42.0% (182)
Asian - Speak only English Native:
31.7% (32)Foreign-born:
10.1% (22)
Asian - Speak another language Native:
64.3% (65)Foreign-born:
89.0% (193)
Other race - Speak another language Native:
30.6% (220)Foreign-born:
100.0% (779)
Two or more races - Speak another language Native:
18.1% (58)Foreign-born:
96.2% (76)
White alone - Speak only English Native:
97.9% (2,899)Foreign-born:
39.4% (96)
White alone - Speak another language Native:
1.9% (57)Foreign-born:
60.9% (148)
Hispanic or Latino - Speak only English Native:
71.1% (936)Foreign-born:
6.3% (53)
Hispanic or Latino - Speak another language Native:
36.0% (473)Foreign-born:
93.8% (793)
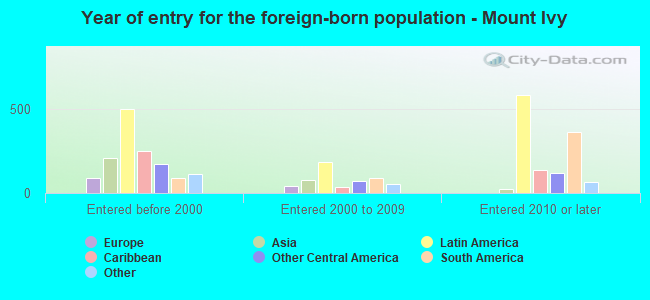
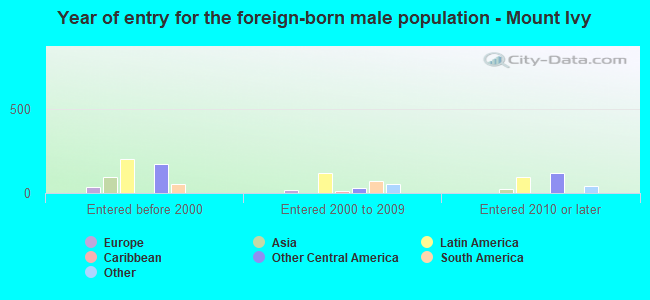
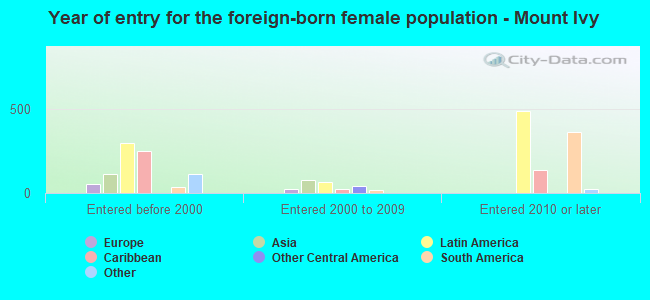
Foreign-born residents in Mount Ivy 1,831 residents are foreign born (15.4% Latin America , 4.1% Asia ).
This city:
23.6%New York:
22.6%
Marital status for residents in Mount Ivy Marital status - White (Caucasian) population 15 years and over
Males 31.2% Never married46.6% Now married2.4% Separated7.3% Widowed12.5% DivorcedFemales 24.2% Never married51.2% Now married0.0% Separated11.3% Widowed13.3% DivorcedWomen who did not give birth in the past 12 months Now married:
45.0% (292)Unmarried:
55.0% (357)
Marital status - Black or African American population 15 years and over
Males 62.3% Never married33.8% Now married0.0% Separated4.0% Widowed0.0% DivorcedFemales 8.4% Never married49.5% Now married0.0% Separated7.1% Widowed35.0% DivorcedWomen who did not give birth in the past 12 months Now married:
62.8% (232)Unmarried:
37.2% (137)
Marital status - Asian population 15 years and over
Males 43.4% Never married33.8% Now married0.0% Separated0.0% Widowed22.8% DivorcedFemales 20.7% Never married15.0% Now married0.0% Separated31.4% Widowed32.9% DivorcedWomen who did not give birth in the past 12 months Now married:
21.1% (20)Unmarried:
78.9% (75)
Marital status - Other race population 15 years and over
Males 17.5% Never married70.9% Now married0.0% Separated0.0% Widowed11.6% DivorcedFemales 21.2% Never married67.3% Now married0.0% Separated11.5% Widowed0.0% DivorcedWomen who gave birth in the past 12 months Now married:
100.0% (54)Unmarried:
0.0% (0)
Women who did not give birth in the past 12 months Now married:
72.8% (286)Unmarried:
27.2% (107)
Marital status - Two or more races population 15 years and over
Males 5.8% Never married61.2% Now married0.0% Separated33.1% Widowed0.0% DivorcedFemales 15.7% Never married38.6% Now married0.0% Separated7.1% Widowed38.6% DivorcedWomen who did not give birth in the past 12 months Now married:
87.1% (40)Unmarried:
12.9% (6)
Marital status - White alone, not Hispanic / Latino population 15 years and over
Males 33.8% Never married40.1% Now married2.9% Separated8.6% Widowed14.7% DivorcedFemales 20.3% Never married51.1% Now married0.0% Separated13.1% Widowed15.4% DivorcedWomen who did not give birth in the past 12 months Now married:
41.5% (180)Unmarried:
58.5% (253)
Marital status - Hispanic or Latino population 15 years and over
Males 17.5% Never married75.1% Now married0.0% Separated0.0% Widowed7.5% DivorcedFemales 20.2% Never married75.4% Now married0.0% Separated0.7% Widowed3.8% DivorcedWomen who gave birth in the past 12 months Now married:
100.0% (55)Unmarried:
0.0% (0)
Women who did not give birth in the past 12 months Now married:
77.1% (502)Unmarried:
22.9% (149)
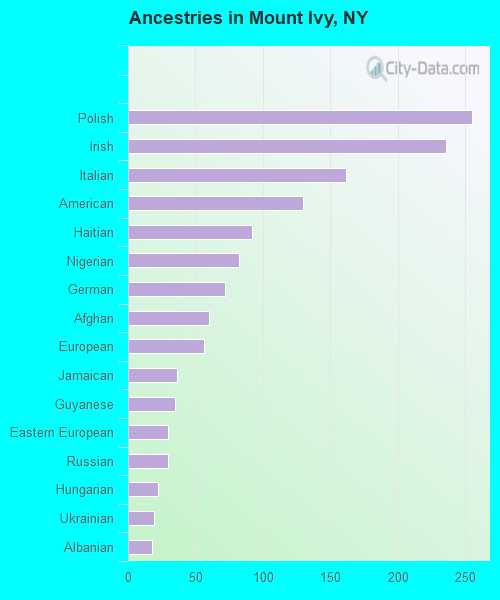
Ancestries in Mount Ivy
255 7.4% Polish236 6.8% Irish162 4.7% Italian130 3.8% American92 2.7% Haitian82 2.4% Nigerian72 2.1% German60 1.7% Afghan56 1.6% European36 1.0% Jamaican35 1.0% Guyanese30 0.9% Eastern European30 0.9% Russian22 0.6% Hungarian19 0.5% Ukrainian18 0.5% Albanian1 0.03% Croatian
Children Nativity (place of birth) in Mount Ivy
Children under 6 years - Living with two parents Both parents native 339 99.7% Native1 0.3% Foreign-bornBoth parents foreign-born 195 82.0% Native43 18.0% Foreign-bornOne native, one foreign-born parent 140 100.0% NativeChildren under 6 years - Living with one parent Native parent 4 100.0% NativeForeign-born parent 62 100.0% NativeChildren 6 to 17 years - Living with two parents Both parents native 189 89.6% Native22 10.4% Foreign-bornBoth parents foreign-born 44 18.2% Native197 81.8% Foreign-bornOne native, one foreign-born parent 192 85.1% Native34 14.9% Foreign-bornChildren 6 to 17 years - Living with one parent Native parent 224 100.0% NativeForeign-born parent 93 47.2% Native103 52.8% Foreign-born