Races in Mount Joy, Pennsylvania (PA) Detailed Stats
Data:
Races - White alone (%)
Races - White alone (% change since 2000)
Races - Black alone (%)
Races - Black alone (% change since 2000)
Races - American Indian alone (%)
Races - American Indian alone (% change since 2000)
Races - Asian alone (%)
Races - Asian alone (% change since 2000)
Races - Hispanic (%)
Races - Hispanic (% change since 2000)
Races - Native Hawaiian and Other Pacific Islander alone (%)
Races - Native Hawaiian and Other Pacific Islander alone (% change since 2000)
Races - Two or more races(%)
Races - Two or more races(% change since 2000)
Races - Other race alone (%)
Races - Other race alone (% change since 2000)
Racial diversity
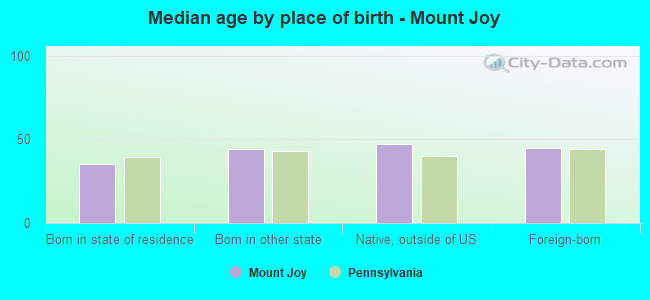
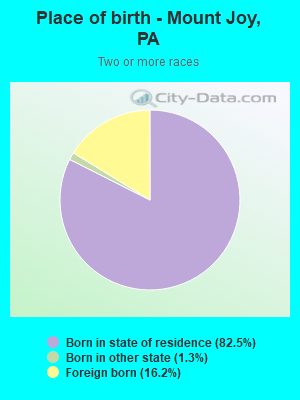
Place of birth - Born in state of residence (%)
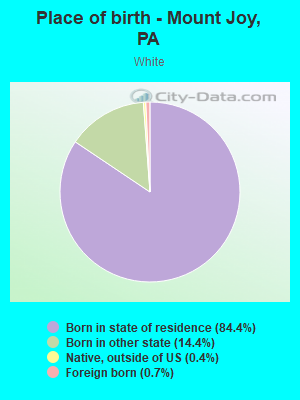
Place of birth - Born in state of residence (%) - White
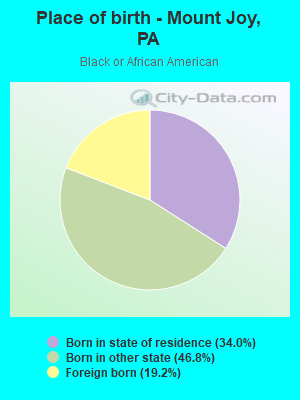
Place of birth - Born in state of residence (%) - Black or African American
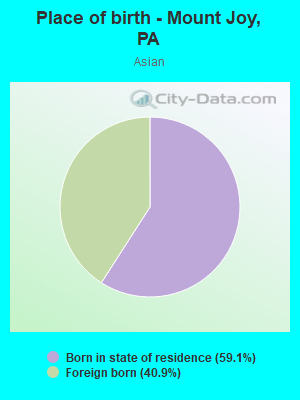
Place of birth - Born in state of residence (%) - Asian
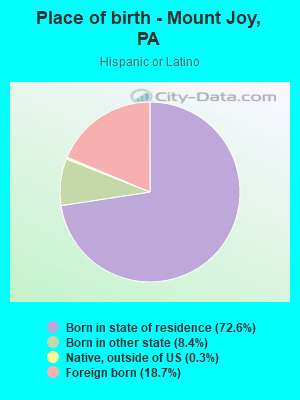
Place of birth - Born in state of residence (%) - Hispanic or Latino
Place of birth - Born in state of residence (%) - American Indian and Alaska Native
Place of birth - Born in state of residence (%) - Multirace
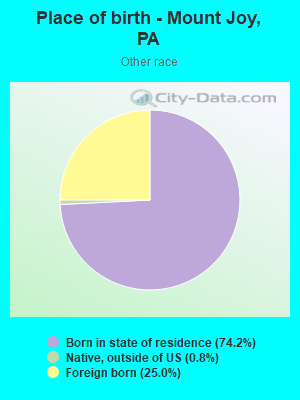
Place of birth - Born in state of residence (%) - Other Race
Place of birth - Born in other state (%)
Place of birth - Born in other state (%) - White
Place of birth - Born in other state (%) - Black or African American
Place of birth - Born in other state (%) - Asian
Place of birth - Born in other state (%) - Hispanic or Latino
Place of birth - Born in other state (%) - American Indian and Alaska Native
Place of birth - Born in other state (%) - Multirace
Place of birth - Born in other state (%) - Other Race
Place of birth - Native, outside of US (%)
Place of birth - Native, outside of US (%) - White
Place of birth - Native, outside of US (%) - Black or African American
Place of birth - Native, outside of US (%) - Asian
Place of birth - Native, outside of US (%) - Hispanic or Latino
Place of birth - Native, outside of US (%) - American Indian and Alaska Native
Place of birth - Native, outside of US (%) - Multirace
Place of birth - Native, outside of US (%) - Other Race
Place of birth - Foreign born (%)
Place of birth - Foreign born (%) - White
Place of birth - Foreign born (%) - Black or African American
Place of birth - Foreign born (%) - Asian
Place of birth - Foreign born (%) - Hispanic or Latino
Place of birth - Foreign born (%) - American Indian and Alaska Native
Place of birth - Foreign born (%) - Multirace
Place of birth - Foreign born (%) - Other Race
Residents speaking English at home (%)
Residents speaking English at home - Born in the United States (%)
Residents speaking English at home - Native, born elsewhere (%)
Residents speaking English at home - Foreign born (%)
Residents speaking Spanish at home (%)
Residents speaking Spanish at home - Born in the United States (%)
Residents speaking Spanish at home - Native, born elsewhere (%)
Residents speaking Spanish at home - Foreign born (%)
Residents speaking other language at home (%)
Residents speaking other language at home - Born in the United States (%)
Residents speaking other language at home - Native, born elsewhere (%)
Residents speaking other language at home - Foreign born (%)
Marital status - Never married (%)
Marital status - Now married (%)
Marital status - Separated (%)
Marital status - Widowed (%)
Marital status - Divorced (%)
Ancestries Reported - Arab (%)
Ancestries Reported - Czech (%)
Ancestries Reported - Danish (%)
Ancestries Reported - Dutch (%)
Ancestries Reported - English (%)
Ancestries Reported - French (%)
Ancestries Reported - French Canadian (%)
Ancestries Reported - German (%)
Ancestries Reported - Greek (%)
Ancestries Reported - Hungarian (%)
Ancestries Reported - Irish (%)
Ancestries Reported - Italian (%)
Ancestries Reported - Lithuanian (%)
Ancestries Reported - Norwegian (%)
Ancestries Reported - Polish (%)
Ancestries Reported - Portuguese (%)
Ancestries Reported - Russian (%)
Ancestries Reported - Scotch-Irish (%)
Ancestries Reported - Scottish (%)
Ancestries Reported - Slovak (%)
Ancestries Reported - Subsaharan African (%)
Ancestries Reported - Swedish (%)
Ancestries Reported - Swiss (%)
Ancestries Reported - Ukrainian (%)
Ancestries Reported - United States (%)
Ancestries Reported - Welsh (%)
Ancestries Reported - West Indian (%)
Ancestries Reported - Other (%)
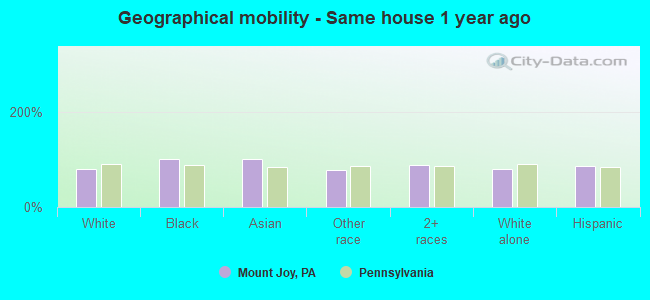
Geographical mobility - Same house 1 year ago (%)
Geographical mobility - Same house 1 year ago (%) - White
Geographical mobility - Same house 1 year ago (%) - Black or African American
Geographical mobility - Same house 1 year ago (%) - Asian
Geographical mobility - Same house 1 year ago (%) - Hispanic or Latino
Geographical mobility - Same house 1 year ago (%) - American Indian and Alaska Native
Geographical mobility - Same house 1 year ago (%) - Multirace
Geographical mobility - Same house 1 year ago (%) - Other Race
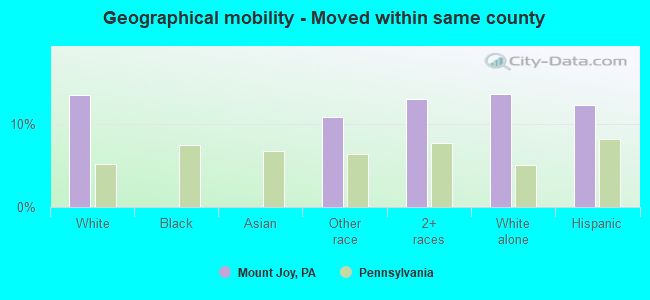
Geographical mobility - Moved within same county (%)
Geographical mobility - Moved within same county (%) - White
Geographical mobility - Moved within same county (%) - Black or African American
Geographical mobility - Moved within same county (%) - Asian
Geographical mobility - Moved within same county (%) - Hispanic or Latino
Geographical mobility - Moved within same county (%) - American Indian and Alaska Native
Geographical mobility - Moved within same county (%) - Multirace
Geographical mobility - Moved within same county (%) - Other Race
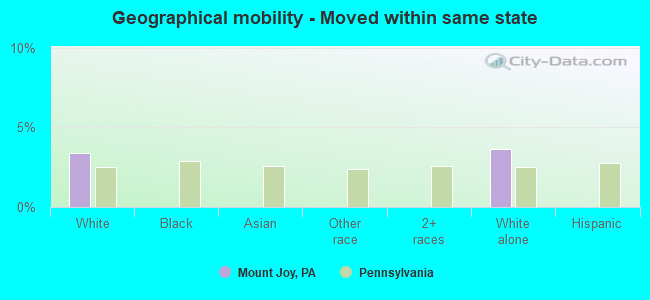
Geographical mobility - Moved from different county within same state (%)
Geographical mobility - Moved from different county within same state (%) - White
Geographical mobility - Moved from different county within same state (%) - Black or African American
Geographical mobility - Moved from different county within same state (%) - Asian
Geographical mobility - Moved from different county within same state (%) - Hispanic or Latino
Geographical mobility - Moved from different county within same state (%) - American Indian and Alaska Native
Geographical mobility - Moved from different county within same state (%) - Multirace
Geographical mobility - Moved from different county within same state (%) - Other Race
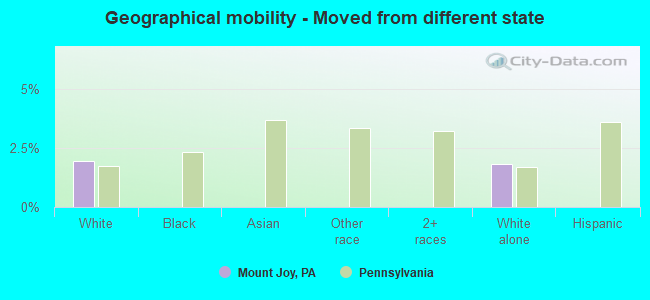
Geographical mobility - Moved from different state (%)
Geographical mobility - Moved from different state (%) - White
Geographical mobility - Moved from different state (%) - Black or African American
Geographical mobility - Moved from different state (%) - Asian
Geographical mobility - Moved from different state (%) - Hispanic or Latino
Geographical mobility - Moved from different state (%) - American Indian and Alaska Native
Geographical mobility - Moved from different state (%) - Multirace
Geographical mobility - Moved from different state (%) - Other Race
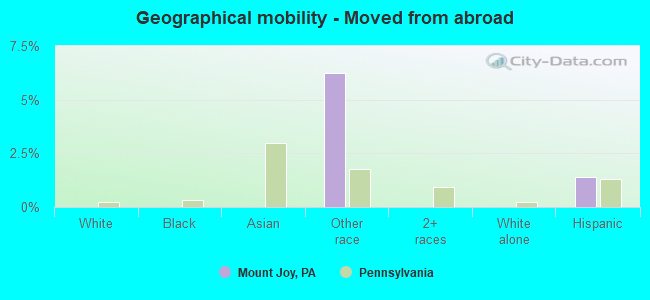
Geographical mobility - Moved from abroad (%)
Geographical mobility - Moved from abroad (%) - White
Geographical mobility - Moved from abroad (%) - Black or African American
Geographical mobility - Moved from abroad (%) - Asian
Geographical mobility - Moved from abroad (%) - Hispanic or Latino
Geographical mobility - Moved from abroad (%) - American Indian and Alaska Native
Geographical mobility - Moved from abroad (%) - Multirace
Geographical mobility - Moved from abroad (%) - Other Race
Place of birth for the foreign-born population - Ireland (%)
Place of birth for the foreign-born population - Denmark (%)
Place of birth for the foreign-born population - Norway (%)
Place of birth for the foreign-born population - Sweden (%)
Place of birth for the foreign-born population - United Kingdom (%)
Place of birth for the foreign-born population - England (%)
Place of birth for the foreign-born population - Scotland (%)
Place of birth for the foreign-born population - Other Northern Europe (%)
Place of birth for the foreign-born population - Austria (%)
Place of birth for the foreign-born population - Belgium (%)
Place of birth for the foreign-born population - France (%)
Place of birth for the foreign-born population - Germany (%)
Place of birth for the foreign-born population - Netherlands (%)
Place of birth for the foreign-born population - Switzerland (%)
Place of birth for the foreign-born population - Other Western Europe (%)
Place of birth for the foreign-born population - Greece (%)
Place of birth for the foreign-born population - Italy (%)
Place of birth for the foreign-born population - Portugal (%)
Place of birth for the foreign-born population - Spain (%)
Place of birth for the foreign-born population - Other Southern Europe (%)
Place of birth for the foreign-born population - Albania (%)
Place of birth for the foreign-born population - Belarus (%)
Place of birth for the foreign-born population - Bosnia and Herzegovina (%)
Place of birth for the foreign-born population - Bulgaria (%)
Place of birth for the foreign-born population - Croatia (%)
Place of birth for the foreign-born population - Czechoslovakia (%)
Place of birth for the foreign-born population - Hungary (%)
Place of birth for the foreign-born population - Latvia (%)
Place of birth for the foreign-born population - Lithuania (%)
Place of birth for the foreign-born population - North Macedonia (Macedonia) (%)
Place of birth for the foreign-born population - Moldova (%)
Place of birth for the foreign-born population - Poland (%)
Place of birth for the foreign-born population - Romania (%)
Place of birth for the foreign-born population - Russia (%)
Place of birth for the foreign-born population - Serbia (%)
Place of birth for the foreign-born population - Ukraine (%)
Place of birth for the foreign-born population - Other Eastern Europe (%)
Place of birth for the foreign-born population - China (%)
Place of birth for the foreign-born population - Hong Kong (%)
Place of birth for the foreign-born population - Taiwan (%)
Place of birth for the foreign-born population - Japan (%)
Place of birth for the foreign-born population - Korea (%)
Place of birth for the foreign-born population - Other Eastern Asia (%)
Place of birth for the foreign-born population - Afghanistan (%)
Place of birth for the foreign-born population - Bangladesh (%)
Place of birth for the foreign-born population - India (%)
Place of birth for the foreign-born population - Iran (%)
Place of birth for the foreign-born population - Kazakhstan (%)
Place of birth for the foreign-born population - Nepal (%)
Place of birth for the foreign-born population - Pakistan (%)
Place of birth for the foreign-born population - Sri Lanka (%)
Place of birth for the foreign-born population - Uzbekistan (%)
Place of birth for the foreign-born population - Other South Central Asia (%)
Place of birth for the foreign-born population - Burma (%)
Place of birth for the foreign-born population - Cambodia (%)
Place of birth for the foreign-born population - Indonesia (%)
Place of birth for the foreign-born population - Laos (%)
Place of birth for the foreign-born population - Malaysia (%)
Place of birth for the foreign-born population - Philippines (%)
Place of birth for the foreign-born population - Singapore (%)
Place of birth for the foreign-born population - Thailand (%)
Place of birth for the foreign-born population - Vietnam (%)
Place of birth for the foreign-born population - Other South Eastern Asia (%)
Place of birth for the foreign-born population - Armenia (%)
Place of birth for the foreign-born population - Iraq (%)
Place of birth for the foreign-born population - Israel (%)
Place of birth for the foreign-born population - Jordan (%)
Place of birth for the foreign-born population - Kuwait (%)
Place of birth for the foreign-born population - Lebanon (%)
Place of birth for the foreign-born population - Saudi Arabia (%)
Place of birth for the foreign-born population - Syria (%)
Place of birth for the foreign-born population - Turkey (%)
Place of birth for the foreign-born population - Yemen (%)
Place of birth for the foreign-born population - Other Western Asia (%)
Place of birth for the foreign-born population - Eritrea (%)
Place of birth for the foreign-born population - Ethiopia (%)
Place of birth for the foreign-born population - Kenya (%)
Place of birth for the foreign-born population - Somalia (%)
Place of birth for the foreign-born population - Uganda (%)
Place of birth for the foreign-born population - Zimbabwe (%)
Place of birth for the foreign-born population - Other Eastern Africa (%)
Place of birth for the foreign-born population - Cameroon (%)
Place of birth for the foreign-born population - Congo (%)
Place of birth for the foreign-born population - Democratic Republic of Congo (Zaire) (%)
Place of birth for the foreign-born population - Other Middle Africa (%)
Place of birth for the foreign-born population - Egypt (%)
Place of birth for the foreign-born population - Morocco (%)
Place of birth for the foreign-born population - Sudan (%)
Place of birth for the foreign-born population - Other Northern Africa (%)
Place of birth for the foreign-born population - South Africa (%)
Place of birth for the foreign-born population - Other Southern Africa (%)
Place of birth for the foreign-born population - Cabo Verde (%)
Place of birth for the foreign-born population - Ghana (%)
Place of birth for the foreign-born population - Liberia (%)
Place of birth for the foreign-born population - Nigeria (%)
Place of birth for the foreign-born population - Senegal (%)
Place of birth for the foreign-born population - Sierra Leone (%)
Place of birth for the foreign-born population - Other Western Africa (%)
Place of birth for the foreign-born population - Australia (%)
Place of birth for the foreign-born population - New Zealand (%)
Place of birth for the foreign-born population - Fiji (%)
Place of birth for the foreign-born population - Micronesia (%)
Place of birth for the foreign-born population - Bahamas (%)
Place of birth for the foreign-born population - Barbados (%)
Place of birth for the foreign-born population - Cuba (%)
Place of birth for the foreign-born population - Dominica (%)
Place of birth for the foreign-born population - Dominican Republic (%)
Place of birth for the foreign-born population - Grenada (%)
Place of birth for the foreign-born population - Haiti (%)
Place of birth for the foreign-born population - Jamaica (%)
Place of birth for the foreign-born population - St. Vincent and the Grenadines (%)
Place of birth for the foreign-born population - Trinidad and Tobago (%)
Place of birth for the foreign-born population - West Indies (%)
Place of birth for the foreign-born population - Other Caribbean (%)
Place of birth for the foreign-born population - Belize (%)
Place of birth for the foreign-born population - Costa Rica (%)
Place of birth for the foreign-born population - El Salvador (%)
Place of birth for the foreign-born population - Guatemala (%)
Place of birth for the foreign-born population - Honduras (%)
Place of birth for the foreign-born population - Mexico (%)
Place of birth for the foreign-born population - Nicaragua (%)
Place of birth for the foreign-born population - Panama (%)
Place of birth for the foreign-born population - Other Central America (%)
Place of birth for the foreign-born population - Argentina (%)
Place of birth for the foreign-born population - Bolivia (%)
Place of birth for the foreign-born population - Brazil (%)
Place of birth for the foreign-born population - Chile (%)
Place of birth for the foreign-born population - Colombia (%)
Place of birth for the foreign-born population - Ecuador (%)
Place of birth for the foreign-born population - Guyana (%)
Place of birth for the foreign-born population - Peru (%)
Place of birth for the foreign-born population - Uruguay (%)
Place of birth for the foreign-born population - Venezuela (%)
Place of birth for the foreign-born population - Other South America (%)
Place of birth for the foreign-born population - Canada (%)
Place of birth for the foreign-born population - Other Northern America (%)
Place of birth for the foreign-born population - Other (%)
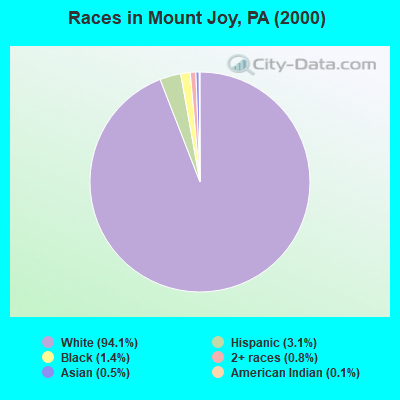
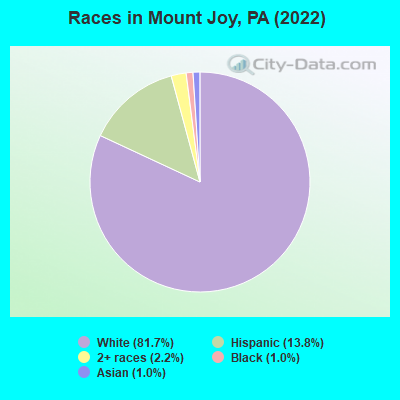
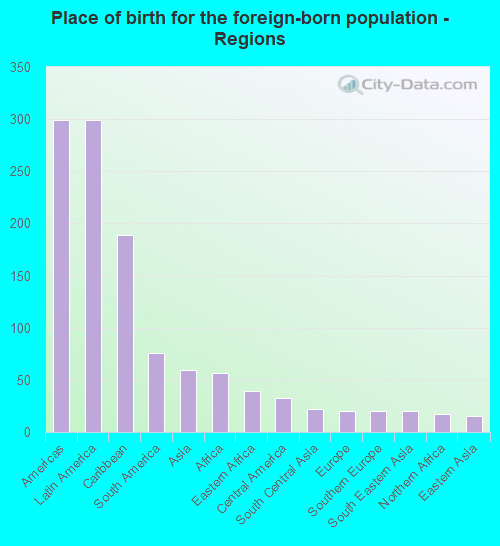
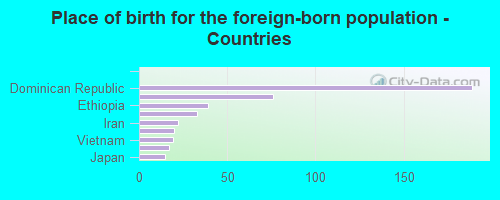
According to 2022 data, the most numerous races in Mount Joy, PA are White alone (6,799 residents), Black alone (87 residents), and Hispanic (1,149 residents). 90.5% of Mount Joy residents speak English at home. 5.2% of Mount Joy, PA residents are foreign-born (3.5% born in Latin America, 0.7% born in Asia, 0.7% born in Africa), which is 33.7% less than the foreign-born rate of 7.0% across the entire state of Pennsylvania.
Race distribution in Mount Joy
2000 2022
10,322,455 84.1% White alone 1,202,437 9.8% Black alone 394,088 3.2% Hispanic 218,296 1.8% Asian alone 113,097 0.9% Two or more races 13,086 0.1% Other race alone 14,904 0.1% American Indian alone 2,691 0.02% Native Hawaiian and Other
9,487,228 73.1% White alone 1,311,581 10.1% Black alone 1,115,997 8.6% Hispanic 493,942 3.8% Two or more races 487,124 3.8% Asian alone 63,582 0.5% Other race alone 10,130 0.08% American Indian alone 2,424 0.02% Native Hawaiian and Other
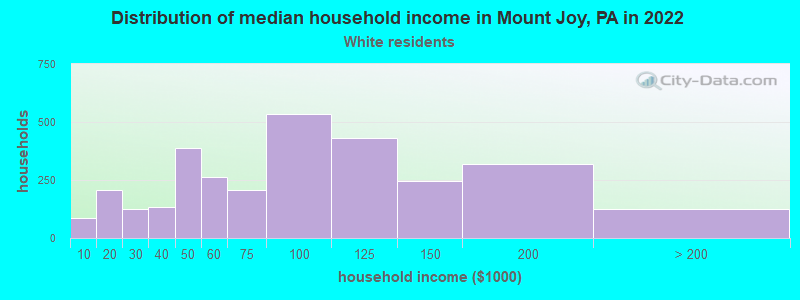
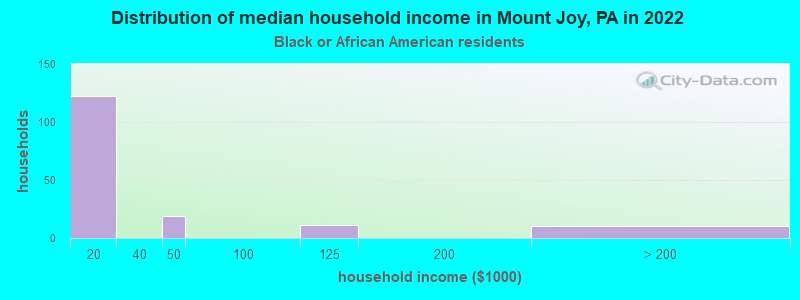
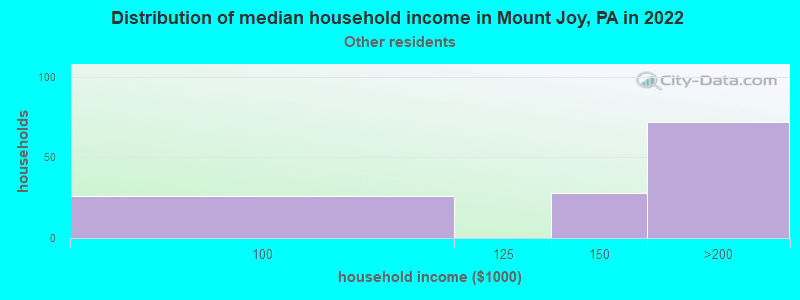
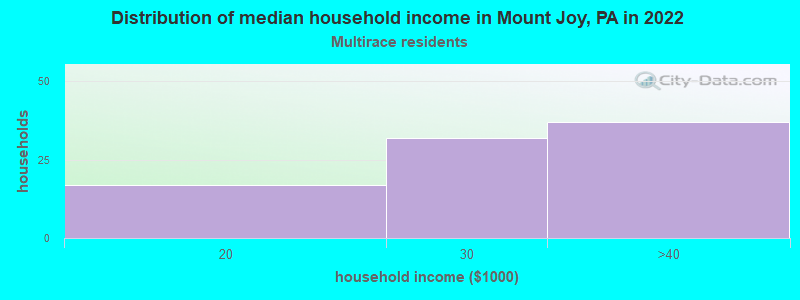
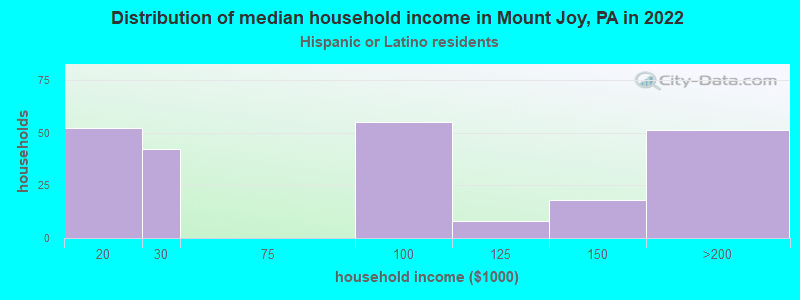
Income and house value in Mount Joy Median household income in 2022 $84,022 White non-Hispanic householdersover $200,000 Some other race householders$24,205 Two or more races householdersMedian 2022 house value $248,708 White Non-Hispanic householders$260,276 Black or African American householders$196,653 Hispanic or Latino householders
Median age by race in Mount Joy
43.1 Median age for White residents39.7 47.9 41.2 Median age for Black or African American residents57.9 41.7 -642,857,142.2 Median age for American Indian / Alaska Native residents-714,583,332.6 -577,519,379.3 29.3 Median age for Asian residents-683,026,584.2 38.8 -612,499,999.4 Median age for Native Hawaiian / Pacific Islander residents-760,416,665.9 -747,474,746.7 25.4 Median age for Other race residents24.7 31.9 15.5 Median age for Two or more races residents16.5 30.4 42.4 Median age for White alone residents39.3 46.9 19.6 Median age for Hispanic or Latino residents13.6 34.9
Owner/renter occupied households by race in Mount Joy
House owners and renters - White residents 1,955 63.7% Owner occupied1,113 36.3% Renter occupiedHouse owners and renters - Black or African American residents 72 54.5% Owner occupied60 45.5% Renter occupiedHouse owners and renters - Other race residents 91 100.0% Owner occupiedHouse owners and renters - Two or more races residents 24 14.1% Owner occupied145 85.9% Renter occupiedHouse owners and renters - White alone residents 1,977 63.7% Owner occupied1,128 36.3% Renter occupiedHouse owners and renters - Hispanic or Latino residents 87 33.9% Owner occupied171 66.1% Renter occupied
Language usage in Mount Joy
English speakers - Total 90.5% of residents of Mount Joy speak English at home.
5.9% of residents speak Spanish at home 285 61.6% Speak English very well178 38.4% Speak English less than very well3.4% of residents speak other language at home 200 74.9% Speak English very well67 25.1% Speak English less than very well
English speakers - Born in the United States 96.2% of residents of Mount Joy speak English at home.
0.2% of residents speak other language at home 2 100.0% Speak English very well
English speakers - Native, born elsewhere 87.0% of residents of Mount Joy speak English at home.
5.6% of residents speak Spanish at home 3 100.0% Speak English very well
English speakers - Foreign-born 5.8% of residents of Mount Joy speak English at home.
49.9% of residents speak Spanish at home 61 34.1% Speak English very well118 65.9% Speak English less than very well34.3% of residents speak other language at home 67 54.5% Speak English very well56 45.5% Speak English less than very well
White (Caucasian) - Speak another language Native:
2.9% (187)Foreign-born:
81.8% (41)
Black or African American - Speak only English Native:
100.0% (155)Foreign-born:
98.9% (31)
Other race - Speak another language Native:
72.2% (189)Foreign-born:
86.0% (99)
Two or more races - Speak another language Native:
5.1% (36)Foreign-born:
100.0% (154)
White alone - Speak another language Native:
3.1% (202)Foreign-born:
83.6% (33)
Hispanic or Latino - Speak another language Native:
23.3% (192)Foreign-born:
99.2% (221)
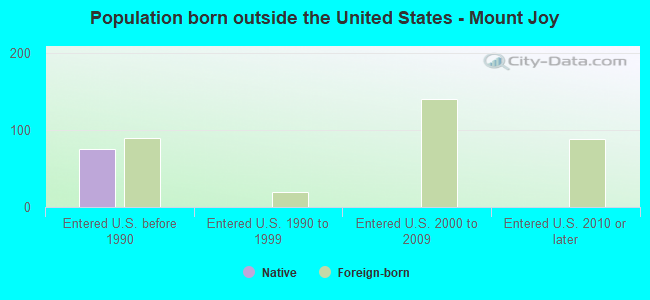
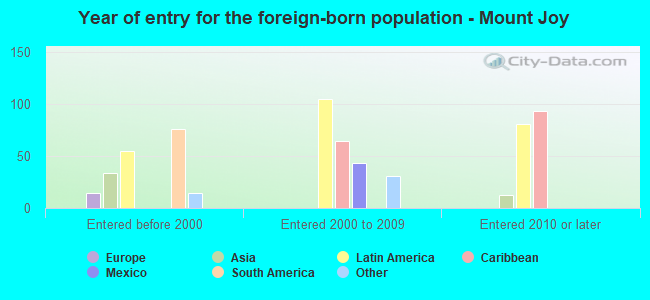
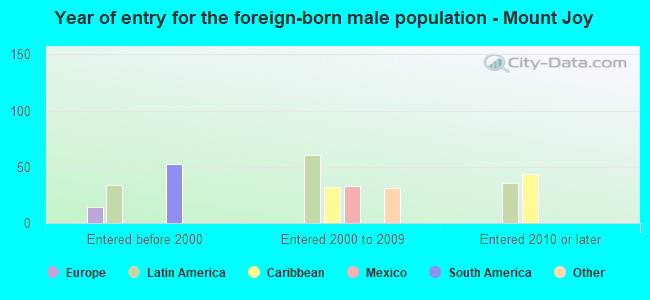
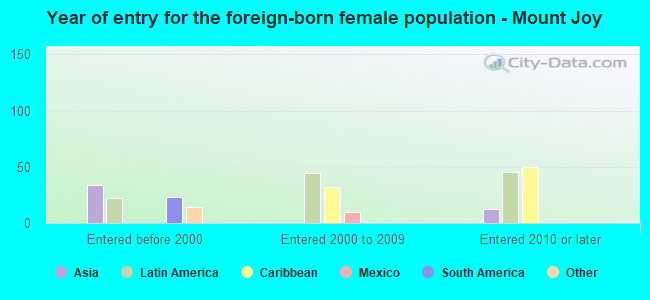
Foreign-born residents in Mount Joy 436 residents are foreign born (3.5% Latin America , 0.7% Asia , 0.7% Africa ).
This city:
5.2%Pennsylvania:
7.3%
Marital status for residents in Mount Joy Marital status - White (Caucasian) population 15 years and over
Males 30.2% Never married56.6% Now married0.4% Separated2.4% Widowed10.4% DivorcedFemales 17.1% Never married53.0% Now married4.5% Separated14.2% Widowed11.2% DivorcedWomen who gave birth in the past 12 months Now married:
56.6% (29)Unmarried:
43.4% (22)
Women who did not give birth in the past 12 months Now married:
60.3% (754)Unmarried:
39.7% (497)
Marital status - Black or African American population 15 years and over
Males 0.0% Never married80.4% Now married0.0% Separated0.0% Widowed19.6% DivorcedFemales 18.1% Never married0.0% Now married69.0% Separated12.9% Widowed0.0% DivorcedWomen who did not give birth in the past 12 months Now married:
79.2% (82)Unmarried:
20.8% (21)
Marital status - Asian population 15 years and over
Males 100.0% Never married0.0% Now married0.0% Separated0.0% Widowed0.0% DivorcedFemales 0.0% Never married100.0% Now married0.0% Separated0.0% Widowed0.0% DivorcedWomen who did not give birth in the past 12 months Now married:
100.0% (36)Unmarried:
0.0% (0)
Marital status - Other race population 15 years and over
Males 42.0% Never married36.1% Now married0.0% Separated21.9% Widowed0.0% DivorcedFemales 0.0% Never married86.1% Now married0.0% Separated4.1% Widowed9.8% DivorcedWomen who did not give birth in the past 12 months Now married:
85.2% (81)Unmarried:
14.8% (14)
Marital status - Two or more races population 15 years and over
Males 81.8% Never married0.0% Now married0.0% Separated0.0% Widowed18.2% DivorcedFemales 51.2% Never married0.0% Now married36.4% Separated0.0% Widowed12.4% DivorcedWomen who gave birth in the past 12 months Now married:
100.0% (64)Unmarried:
0.0% (0)
Women who did not give birth in the past 12 months Now married:
0.0% (0)Unmarried:
100.0% (90)
Marital status - White alone, not Hispanic / Latino population 15 years and over
Males 29.8% Never married56.8% Now married0.4% Separated2.4% Widowed10.6% DivorcedFemales 17.2% Never married52.8% Now married4.6% Separated14.3% Widowed11.1% DivorcedWomen who gave birth in the past 12 months Now married:
56.6% (30)Unmarried:
43.4% (23)
Women who did not give birth in the past 12 months Now married:
60.0% (766)Unmarried:
40.0% (511)
Marital status - Hispanic or Latino population 15 years and over
Males 57.3% Never married29.4% Now married0.0% Separated13.3% Widowed0.0% DivorcedFemales 19.3% Never married36.3% Now married38.5% Separated1.6% Widowed4.3% DivorcedWomen who gave birth in the past 12 months Now married:
100.0% (43)Unmarried:
0.0% (0)
Women who did not give birth in the past 12 months Now married:
67.9% (158)Unmarried:
32.1% (75)
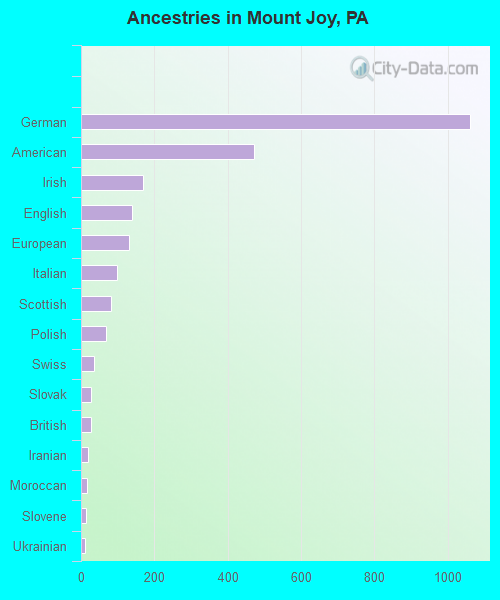
Ancestries in Mount Joy
1,060 34.7% German473 15.5% American169 5.5% Irish140 4.6% English132 4.3% European97 3.2% Italian81 2.7% Scottish69 2.3% Polish35 1.1% Swiss28 0.9% Slovak26 0.9% British20 0.7% Iranian16 0.5% Moroccan15 0.5% Slovene12 0.4% Ukrainian9 0.3% Carpatho Rusyn9 0.3% Greek
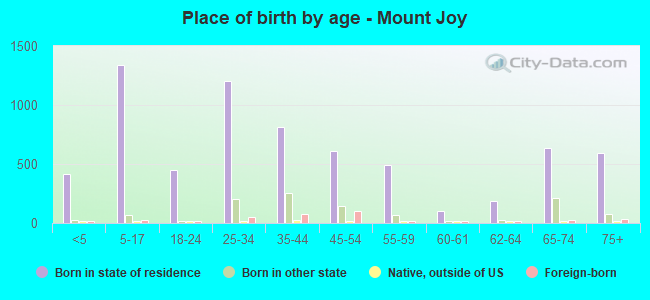
Children Nativity (place of birth) in Mount Joy
Children under 6 years - Living with two parents Both parents native 327 100.0% NativeOne native, one foreign-born parent 74 100.0% NativeChildren under 6 years - Living with one parent Native parent 81 100.0% NativeForeign-born parent 81 100.0% NativeChildren 6 to 17 years - Living with two parents Both parents native 622 100.0% NativeBoth parents foreign-born 98 100.0% NativeOne native, one foreign-born parent 47 100.0% NativeChildren 6 to 17 years - Living with one parent Native parent 401 89.5% Native47 10.5% Foreign-bornForeign-born parent 68 100.0% Native
Grandparents responsible for own grandchildren in Mount Joy
Grandparents (30 to 59 years) White / Caucasian 14 46.0% Responsible for grandchildren17 54.0% Not responsible for grandchildrenWhite alone, not Hispanic / Latino 15 43.2% Responsible for grandchildren19 56.8% Not responsible for grandchildrenGrandparents (60 years and over) White / Caucasian 7 13.5% Responsible for grandchildren48 86.5% Not responsible for grandchildrenWhite alone, not Hispanic / Latino 8 13.0% Responsible for grandchildren51 87.0% Not responsible for grandchildren