Races in Mount Vernon, Washington (WA) Detailed Stats
Data:
Races - White alone (%)
Races - White alone (% change since 2000)
Races - Black alone (%)
Races - Black alone (% change since 2000)
Races - American Indian alone (%)
Races - American Indian alone (% change since 2000)
Races - Asian alone (%)
Races - Asian alone (% change since 2000)
Races - Hispanic (%)
Races - Hispanic (% change since 2000)
Races - Native Hawaiian and Other Pacific Islander alone (%)
Races - Native Hawaiian and Other Pacific Islander alone (% change since 2000)
Races - Two or more races(%)
Races - Two or more races(% change since 2000)
Races - Other race alone (%)
Races - Other race alone (% change since 2000)
Racial diversity
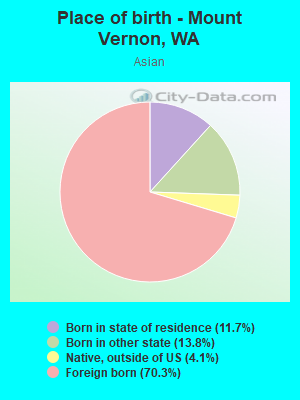
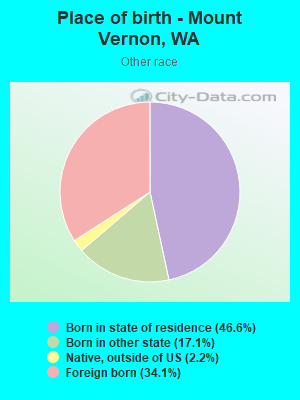
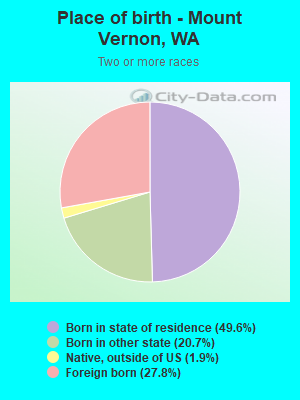
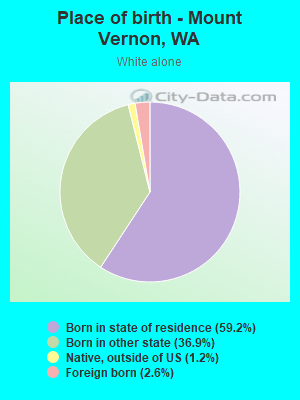
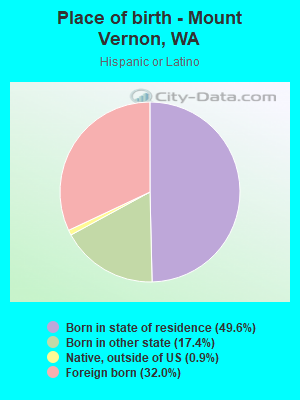
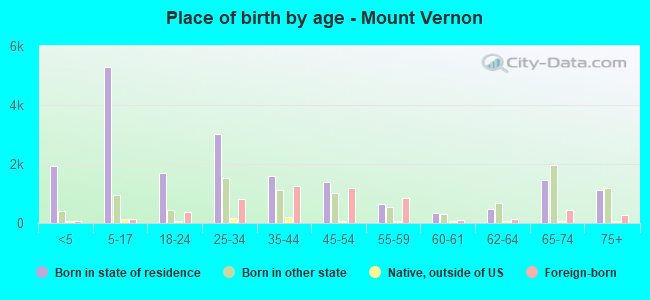
Place of birth - Born in state of residence (%)
Place of birth - Born in state of residence (%) - White
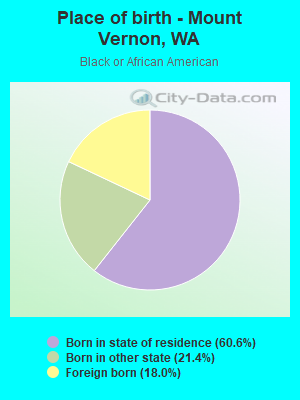
Place of birth - Born in state of residence (%) - Black or African American
Place of birth - Born in state of residence (%) - Asian
Place of birth - Born in state of residence (%) - Hispanic or Latino
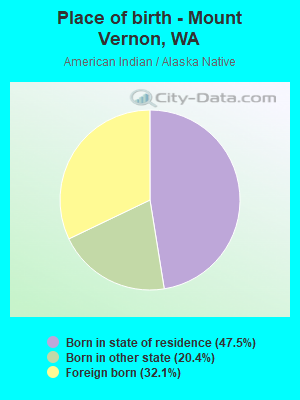
Place of birth - Born in state of residence (%) - American Indian and Alaska Native
Place of birth - Born in state of residence (%) - Multirace
Place of birth - Born in state of residence (%) - Other Race
Place of birth - Born in other state (%)
Place of birth - Born in other state (%) - White
Place of birth - Born in other state (%) - Black or African American
Place of birth - Born in other state (%) - Asian
Place of birth - Born in other state (%) - Hispanic or Latino
Place of birth - Born in other state (%) - American Indian and Alaska Native
Place of birth - Born in other state (%) - Multirace
Place of birth - Born in other state (%) - Other Race
Place of birth - Native, outside of US (%)
Place of birth - Native, outside of US (%) - White
Place of birth - Native, outside of US (%) - Black or African American
Place of birth - Native, outside of US (%) - Asian
Place of birth - Native, outside of US (%) - Hispanic or Latino
Place of birth - Native, outside of US (%) - American Indian and Alaska Native
Place of birth - Native, outside of US (%) - Multirace
Place of birth - Native, outside of US (%) - Other Race
Place of birth - Foreign born (%)
Place of birth - Foreign born (%) - White
Place of birth - Foreign born (%) - Black or African American
Place of birth - Foreign born (%) - Asian
Place of birth - Foreign born (%) - Hispanic or Latino
Place of birth - Foreign born (%) - American Indian and Alaska Native
Place of birth - Foreign born (%) - Multirace
Place of birth - Foreign born (%) - Other Race
Residents speaking English at home (%)
Residents speaking English at home - Born in the United States (%)
Residents speaking English at home - Native, born elsewhere (%)
Residents speaking English at home - Foreign born (%)
Residents speaking Spanish at home (%)
Residents speaking Spanish at home - Born in the United States (%)
Residents speaking Spanish at home - Native, born elsewhere (%)
Residents speaking Spanish at home - Foreign born (%)
Residents speaking other language at home (%)
Residents speaking other language at home - Born in the United States (%)
Residents speaking other language at home - Native, born elsewhere (%)
Residents speaking other language at home - Foreign born (%)
Marital status - Never married (%)
Marital status - Now married (%)
Marital status - Separated (%)
Marital status - Widowed (%)
Marital status - Divorced (%)
Ancestries Reported - Arab (%)
Ancestries Reported - Czech (%)
Ancestries Reported - Danish (%)
Ancestries Reported - Dutch (%)
Ancestries Reported - English (%)
Ancestries Reported - French (%)
Ancestries Reported - French Canadian (%)
Ancestries Reported - German (%)
Ancestries Reported - Greek (%)
Ancestries Reported - Hungarian (%)
Ancestries Reported - Irish (%)
Ancestries Reported - Italian (%)
Ancestries Reported - Lithuanian (%)
Ancestries Reported - Norwegian (%)
Ancestries Reported - Polish (%)
Ancestries Reported - Portuguese (%)
Ancestries Reported - Russian (%)
Ancestries Reported - Scotch-Irish (%)
Ancestries Reported - Scottish (%)
Ancestries Reported - Slovak (%)
Ancestries Reported - Subsaharan African (%)
Ancestries Reported - Swedish (%)
Ancestries Reported - Swiss (%)
Ancestries Reported - Ukrainian (%)
Ancestries Reported - United States (%)
Ancestries Reported - Welsh (%)
Ancestries Reported - West Indian (%)
Ancestries Reported - Other (%)
Geographical mobility - Same house 1 year ago (%)
Geographical mobility - Same house 1 year ago (%) - White
Geographical mobility - Same house 1 year ago (%) - Black or African American
Geographical mobility - Same house 1 year ago (%) - Asian
Geographical mobility - Same house 1 year ago (%) - Hispanic or Latino
Geographical mobility - Same house 1 year ago (%) - American Indian and Alaska Native
Geographical mobility - Same house 1 year ago (%) - Multirace
Geographical mobility - Same house 1 year ago (%) - Other Race
Geographical mobility - Moved within same county (%)
Geographical mobility - Moved within same county (%) - White
Geographical mobility - Moved within same county (%) - Black or African American
Geographical mobility - Moved within same county (%) - Asian
Geographical mobility - Moved within same county (%) - Hispanic or Latino
Geographical mobility - Moved within same county (%) - American Indian and Alaska Native
Geographical mobility - Moved within same county (%) - Multirace
Geographical mobility - Moved within same county (%) - Other Race
Geographical mobility - Moved from different county within same state (%)
Geographical mobility - Moved from different county within same state (%) - White
Geographical mobility - Moved from different county within same state (%) - Black or African American
Geographical mobility - Moved from different county within same state (%) - Asian
Geographical mobility - Moved from different county within same state (%) - Hispanic or Latino
Geographical mobility - Moved from different county within same state (%) - American Indian and Alaska Native
Geographical mobility - Moved from different county within same state (%) - Multirace
Geographical mobility - Moved from different county within same state (%) - Other Race
Geographical mobility - Moved from different state (%)
Geographical mobility - Moved from different state (%) - White
Geographical mobility - Moved from different state (%) - Black or African American
Geographical mobility - Moved from different state (%) - Asian
Geographical mobility - Moved from different state (%) - Hispanic or Latino
Geographical mobility - Moved from different state (%) - American Indian and Alaska Native
Geographical mobility - Moved from different state (%) - Multirace
Geographical mobility - Moved from different state (%) - Other Race
Geographical mobility - Moved from abroad (%)
Geographical mobility - Moved from abroad (%) - White
Geographical mobility - Moved from abroad (%) - Black or African American
Geographical mobility - Moved from abroad (%) - Asian
Geographical mobility - Moved from abroad (%) - Hispanic or Latino
Geographical mobility - Moved from abroad (%) - American Indian and Alaska Native
Geographical mobility - Moved from abroad (%) - Multirace
Geographical mobility - Moved from abroad (%) - Other Race
Place of birth for the foreign-born population - Ireland (%)
Place of birth for the foreign-born population - Denmark (%)
Place of birth for the foreign-born population - Norway (%)
Place of birth for the foreign-born population - Sweden (%)
Place of birth for the foreign-born population - United Kingdom (%)
Place of birth for the foreign-born population - England (%)
Place of birth for the foreign-born population - Scotland (%)
Place of birth for the foreign-born population - Other Northern Europe (%)
Place of birth for the foreign-born population - Austria (%)
Place of birth for the foreign-born population - Belgium (%)
Place of birth for the foreign-born population - France (%)
Place of birth for the foreign-born population - Germany (%)
Place of birth for the foreign-born population - Netherlands (%)
Place of birth for the foreign-born population - Switzerland (%)
Place of birth for the foreign-born population - Other Western Europe (%)
Place of birth for the foreign-born population - Greece (%)
Place of birth for the foreign-born population - Italy (%)
Place of birth for the foreign-born population - Portugal (%)
Place of birth for the foreign-born population - Spain (%)
Place of birth for the foreign-born population - Other Southern Europe (%)
Place of birth for the foreign-born population - Albania (%)
Place of birth for the foreign-born population - Belarus (%)
Place of birth for the foreign-born population - Bosnia and Herzegovina (%)
Place of birth for the foreign-born population - Bulgaria (%)
Place of birth for the foreign-born population - Croatia (%)
Place of birth for the foreign-born population - Czechoslovakia (%)
Place of birth for the foreign-born population - Hungary (%)
Place of birth for the foreign-born population - Latvia (%)
Place of birth for the foreign-born population - Lithuania (%)
Place of birth for the foreign-born population - North Macedonia (Macedonia) (%)
Place of birth for the foreign-born population - Moldova (%)
Place of birth for the foreign-born population - Poland (%)
Place of birth for the foreign-born population - Romania (%)
Place of birth for the foreign-born population - Russia (%)
Place of birth for the foreign-born population - Serbia (%)
Place of birth for the foreign-born population - Ukraine (%)
Place of birth for the foreign-born population - Other Eastern Europe (%)
Place of birth for the foreign-born population - China (%)
Place of birth for the foreign-born population - Hong Kong (%)
Place of birth for the foreign-born population - Taiwan (%)
Place of birth for the foreign-born population - Japan (%)
Place of birth for the foreign-born population - Korea (%)
Place of birth for the foreign-born population - Other Eastern Asia (%)
Place of birth for the foreign-born population - Afghanistan (%)
Place of birth for the foreign-born population - Bangladesh (%)
Place of birth for the foreign-born population - India (%)
Place of birth for the foreign-born population - Iran (%)
Place of birth for the foreign-born population - Kazakhstan (%)
Place of birth for the foreign-born population - Nepal (%)
Place of birth for the foreign-born population - Pakistan (%)
Place of birth for the foreign-born population - Sri Lanka (%)
Place of birth for the foreign-born population - Uzbekistan (%)
Place of birth for the foreign-born population - Other South Central Asia (%)
Place of birth for the foreign-born population - Burma (%)
Place of birth for the foreign-born population - Cambodia (%)
Place of birth for the foreign-born population - Indonesia (%)
Place of birth for the foreign-born population - Laos (%)
Place of birth for the foreign-born population - Malaysia (%)
Place of birth for the foreign-born population - Philippines (%)
Place of birth for the foreign-born population - Singapore (%)
Place of birth for the foreign-born population - Thailand (%)
Place of birth for the foreign-born population - Vietnam (%)
Place of birth for the foreign-born population - Other South Eastern Asia (%)
Place of birth for the foreign-born population - Armenia (%)
Place of birth for the foreign-born population - Iraq (%)
Place of birth for the foreign-born population - Israel (%)
Place of birth for the foreign-born population - Jordan (%)
Place of birth for the foreign-born population - Kuwait (%)
Place of birth for the foreign-born population - Lebanon (%)
Place of birth for the foreign-born population - Saudi Arabia (%)
Place of birth for the foreign-born population - Syria (%)
Place of birth for the foreign-born population - Turkey (%)
Place of birth for the foreign-born population - Yemen (%)
Place of birth for the foreign-born population - Other Western Asia (%)
Place of birth for the foreign-born population - Eritrea (%)
Place of birth for the foreign-born population - Ethiopia (%)
Place of birth for the foreign-born population - Kenya (%)
Place of birth for the foreign-born population - Somalia (%)
Place of birth for the foreign-born population - Uganda (%)
Place of birth for the foreign-born population - Zimbabwe (%)
Place of birth for the foreign-born population - Other Eastern Africa (%)
Place of birth for the foreign-born population - Cameroon (%)
Place of birth for the foreign-born population - Congo (%)
Place of birth for the foreign-born population - Democratic Republic of Congo (Zaire) (%)
Place of birth for the foreign-born population - Other Middle Africa (%)
Place of birth for the foreign-born population - Egypt (%)
Place of birth for the foreign-born population - Morocco (%)
Place of birth for the foreign-born population - Sudan (%)
Place of birth for the foreign-born population - Other Northern Africa (%)
Place of birth for the foreign-born population - South Africa (%)
Place of birth for the foreign-born population - Other Southern Africa (%)
Place of birth for the foreign-born population - Cabo Verde (%)
Place of birth for the foreign-born population - Ghana (%)
Place of birth for the foreign-born population - Liberia (%)
Place of birth for the foreign-born population - Nigeria (%)
Place of birth for the foreign-born population - Senegal (%)
Place of birth for the foreign-born population - Sierra Leone (%)
Place of birth for the foreign-born population - Other Western Africa (%)
Place of birth for the foreign-born population - Australia (%)
Place of birth for the foreign-born population - New Zealand (%)
Place of birth for the foreign-born population - Fiji (%)
Place of birth for the foreign-born population - Micronesia (%)
Place of birth for the foreign-born population - Bahamas (%)
Place of birth for the foreign-born population - Barbados (%)
Place of birth for the foreign-born population - Cuba (%)
Place of birth for the foreign-born population - Dominica (%)
Place of birth for the foreign-born population - Dominican Republic (%)
Place of birth for the foreign-born population - Grenada (%)
Place of birth for the foreign-born population - Haiti (%)
Place of birth for the foreign-born population - Jamaica (%)
Place of birth for the foreign-born population - St. Vincent and the Grenadines (%)
Place of birth for the foreign-born population - Trinidad and Tobago (%)
Place of birth for the foreign-born population - West Indies (%)
Place of birth for the foreign-born population - Other Caribbean (%)
Place of birth for the foreign-born population - Belize (%)
Place of birth for the foreign-born population - Costa Rica (%)
Place of birth for the foreign-born population - El Salvador (%)
Place of birth for the foreign-born population - Guatemala (%)
Place of birth for the foreign-born population - Honduras (%)
Place of birth for the foreign-born population - Mexico (%)
Place of birth for the foreign-born population - Nicaragua (%)
Place of birth for the foreign-born population - Panama (%)
Place of birth for the foreign-born population - Other Central America (%)
Place of birth for the foreign-born population - Argentina (%)
Place of birth for the foreign-born population - Bolivia (%)
Place of birth for the foreign-born population - Brazil (%)
Place of birth for the foreign-born population - Chile (%)
Place of birth for the foreign-born population - Colombia (%)
Place of birth for the foreign-born population - Ecuador (%)
Place of birth for the foreign-born population - Guyana (%)
Place of birth for the foreign-born population - Peru (%)
Place of birth for the foreign-born population - Uruguay (%)
Place of birth for the foreign-born population - Venezuela (%)
Place of birth for the foreign-born population - Other South America (%)
Place of birth for the foreign-born population - Canada (%)
Place of birth for the foreign-born population - Other Northern America (%)
Place of birth for the foreign-born population - Other (%)
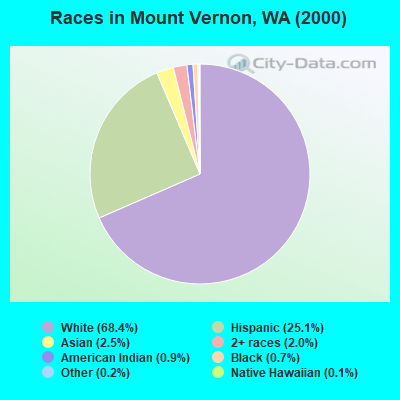
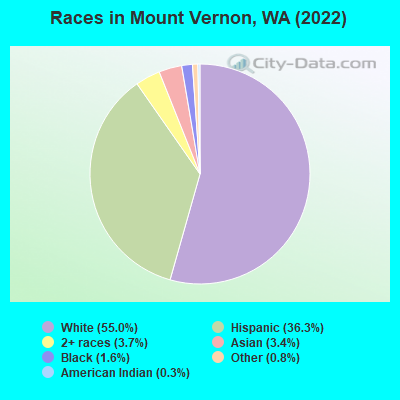
According to 2022 data, the most numerous races in Mount Vernon, WA are White alone (19,571 residents), Hispanic (12,911 residents), and Asian alone (1,226 residents). 68.4% of Mount Vernon residents speak English at home. 16.5% of Mount Vernon, WA residents are foreign-born (11.8% born in Latin America, 2.4% born in Asia), which is 9.2% greater than the foreign-born rate of 15.0% across the entire state of Washington.
Race distribution in Mount Vernon
2000 2022
4,652,490 78.9% White alone 441,509 7.5% Hispanic 319,401 5.4% Asian alone 184,631 3.1% Black alone 175,926 3.0% Two or more races 85,396 1.4% American Indian alone 22,779 0.4% Native Hawaiian and Other 11,989 0.2% Other race alone
4,941,456 63.5% White alone 1,093,313 14.0% Hispanic 755,832 9.7% Asian alone 523,448 6.7% Two or more races 299,537 3.8% Black alone 69,024 0.9% American Indian alone 52,231 0.7% Native Hawaiian and Other 50,945 0.7% Other race alone
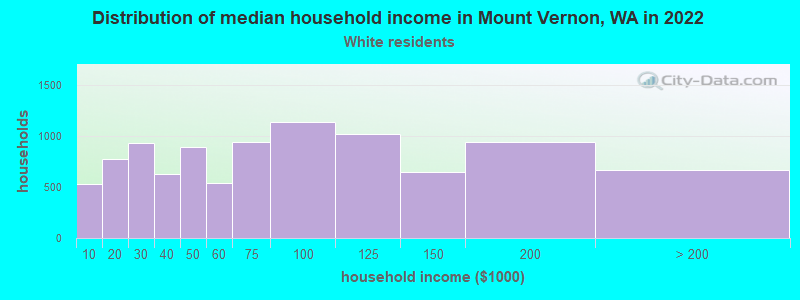
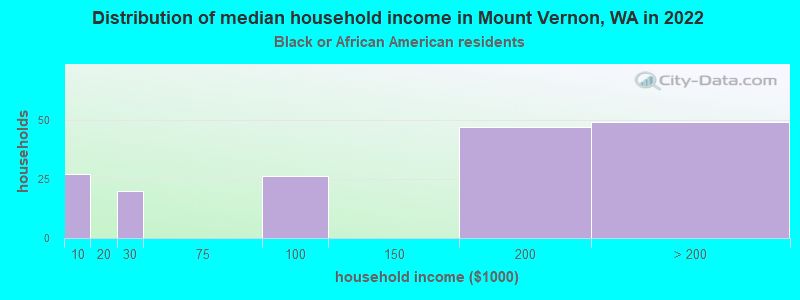
Income and house value in Mount Vernon Median household income in 2022 $66,458 White non-Hispanic householders$192,322 Black householders$105,191 American Indian and Alaska Native householders$61,357 Asian householders$61,851 Some other race householders$77,040 Two or more races householders$61,151 Hispanic or Latino race householdersMedian 2022 house value $478,488 White Non-Hispanic householders$502,711 Black or African American householders$590,976 American Indian or Alaska Native householders $607,899 Asian householders$368,655 Some other race householders$444,974 Two or more races householders$366,664 Hispanic or Latino householders
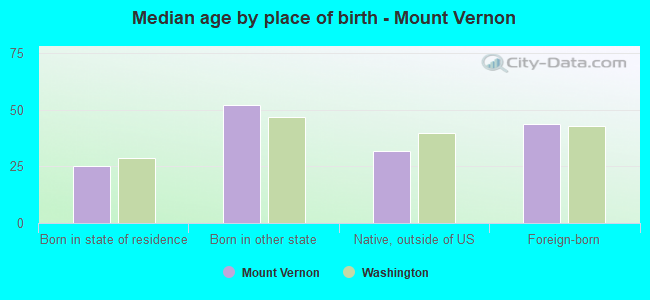
Median age by race in Mount Vernon
41.7 Median age for White residents37.9 46.3 37.1 Median age for Black or African American residents23.1 38.2 30.0 Median age for American Indian / Alaska Native residents30.4 14.8 34.4 Median age for Asian residents25.1 38.2 -681,388,011.9 Median age for Native Hawaiian / Pacific Islander residents-696,774,192.9 -666,666,666.0 26.4 Median age for Other race residents22.7 28.8 27.2 Median age for Two or more races residents26.9 31.6 48.3 Median age for White alone residents43.2 53.9 26.0 Median age for Hispanic or Latino residents21.6 28.6
Owner/renter occupied households by race in Mount Vernon
House owners and renters - White residents 6,730 69.5% Owner occupied2,953 30.5% Renter occupiedHouse owners and renters - Black or African American residents 84 35.5% Owner occupied152 64.5% Renter occupiedHouse owners and renters - American Indian / Alaska Native residents 102 66.6% Owner occupied51 33.4% Renter occupiedHouse owners and renters - Asian residents 152 53.8% Owner occupied130 46.2% Renter occupiedHouse owners and renters - Other race residents 827 51.3% Owner occupied784 48.7% Renter occupiedHouse owners and renters - Two or more races residents 621 62.3% Owner occupied376 37.7% Renter occupiedHouse owners and renters - White alone residents 6,413 71.0% Owner occupied2,616 29.0% Renter occupiedHouse owners and renters - Hispanic or Latino residents 1,381 50.8% Owner occupied1,337 49.2% Renter occupied
Language usage in Mount Vernon
English speakers - Total 68.4% of residents of Mount Vernon speak English at home.
27.7% of residents speak Spanish at home 5,626 61.1% Speak English very well3,578 38.9% Speak English less than very well4.4% of residents speak other language at home 809 55.0% Speak English very well662 45.0% Speak English less than very well
English speakers - Born in the United States 84.9% of residents of Mount Vernon speak English at home.
14.2% of residents speak Spanish at home 1,327 95.4% Speak English very well64 4.6% Speak English less than very well2.1% of residents speak other language at home 202 100.0% Speak English very well
English speakers - Native, born elsewhere 65.2% of residents of Mount Vernon speak English at home.
37.2% of residents speak Spanish at home 171 85.5% Speak English very well29 14.5% Speak English less than very well10.8% of residents speak other language at home 12 20.7% Speak English very well46 79.3% Speak English less than very well
English speakers - Foreign-born 12.2% of residents of Mount Vernon speak English at home.
71.0% of residents speak Spanish at home 823 19.9% Speak English very well3,306 80.1% Speak English less than very well18.1% of residents speak other language at home 504 47.9% Speak English very well549 52.1% Speak English less than very well
White (Caucasian) - Speak only English Native:
92.1% (18,590)Foreign-born:
27.6% (267)
White (Caucasian) - Speak another language Native:
7.0% (1,414)Foreign-born:
100.0% (967)
Black or African American - Speak only English Native:
100.0% (297)Foreign-born:
44.7% (30)
American Indian / Alaska Native - Speak only English Native:
45.1% (235)Foreign-born:
12.5% (51)
American Indian / Alaska Native - Speak another language Native:
62.2% (324)Foreign-born:
86.1% (351)
Asian - Speak only English Native:
75.4% (222)Foreign-born:
15.2% (144)
Asian - Speak another language Native:
24.5% (72)Foreign-born:
83.5% (789)
Other race - Speak only English Native:
28.9% (1,346)Foreign-born:
2.0% (57)
Other race - Speak another language Native:
68.3% (3,180)Foreign-born:
99.1% (2,788)
Two or more races - Speak only English Native:
77.7% (1,645)Foreign-born:
10.6% (112)
Two or more races - Speak another language Native:
25.1% (531)Foreign-born:
92.0% (974)
White alone - Speak only English Native:
97.0% (17,735)Foreign-born:
43.5% (225)
White alone - Speak another language Native:
3.2% (576)Foreign-born:
38.4% (199)
Hispanic or Latino - Speak only English Native:
33.8% (2,464)Foreign-born:
1.8% (73)
Hispanic or Latino - Speak another language Native:
64.9% (4,724)Foreign-born:
99.6% (4,108)
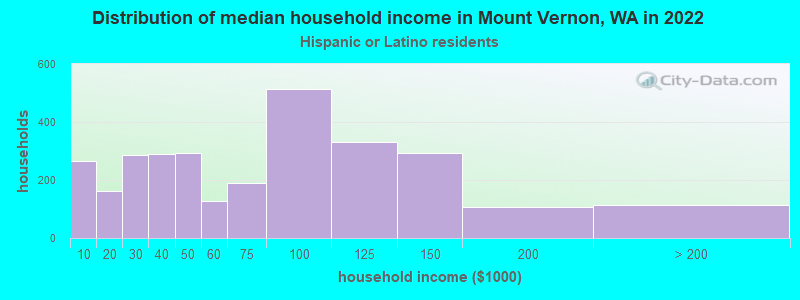
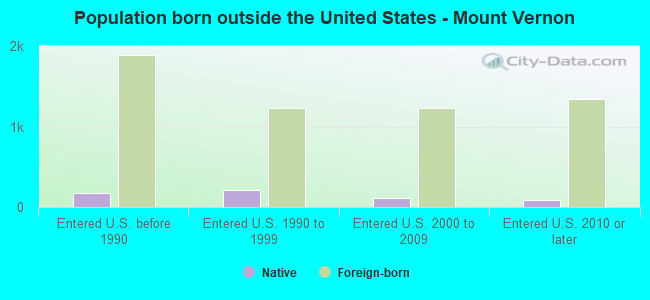
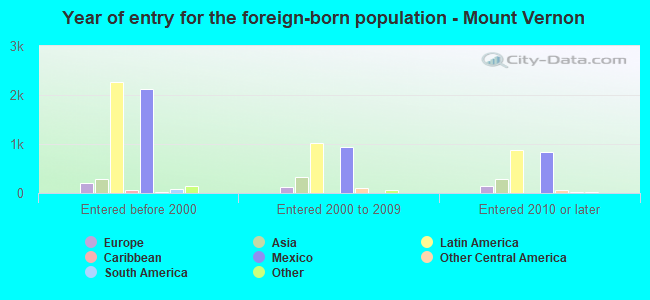
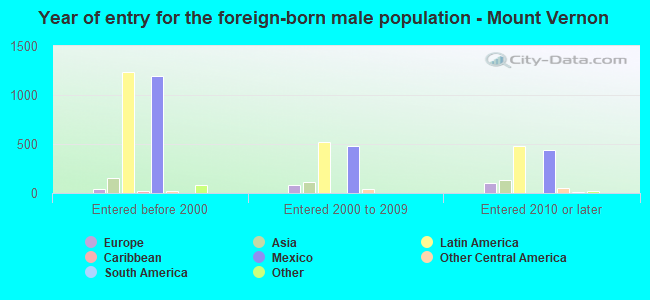
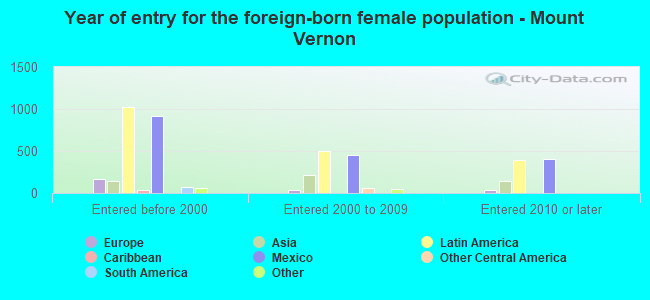
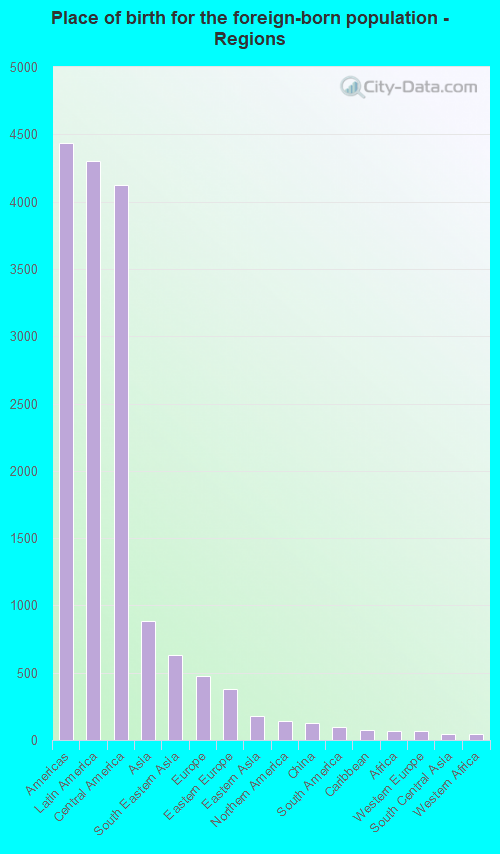
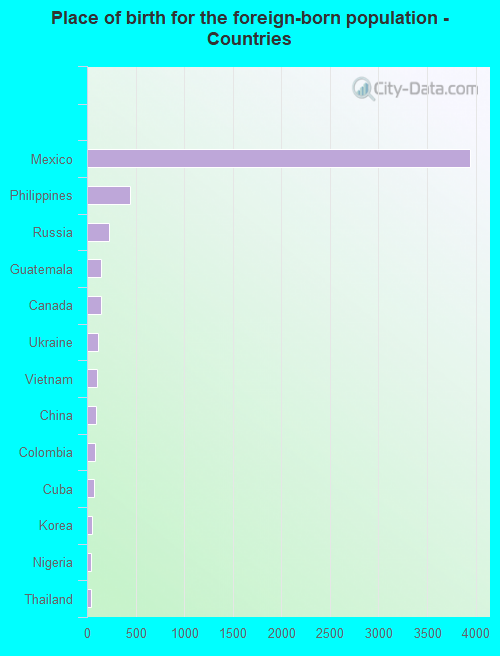
Foreign-born residents in Mount Vernon 5,880 residents are foreign born (11.8% Latin America , 2.4% Asia ).
This city:
16.5%Washington:
14.9%
Marital status for residents in Mount Vernon Marital status - White (Caucasian) population 15 years and over
Males 32.5% Never married51.9% Now married1.3% Separated2.4% Widowed11.9% DivorcedFemales 21.3% Never married48.3% Now married1.8% Separated11.7% Widowed16.9% DivorcedWomen who gave birth in the past 12 months Now married:
72.8% (179)Unmarried:
27.2% (67)
Women who did not give birth in the past 12 months Now married:
48.4% (1,909)Unmarried:
51.6% (2,032)
Marital status - Black or African American population 15 years and over
Males 51.7% Never married12.8% Now married0.0% Separated2.3% Widowed33.1% DivorcedFemales 10.6% Never married78.8% Now married0.0% Separated0.0% Widowed10.6% DivorcedWomen who gave birth in the past 12 months Now married:
100.0% (13)Unmarried:
0.0% (0)
Women who did not give birth in the past 12 months Now married:
85.9% (85)Unmarried:
14.1% (14)
Marital status - American Indian / Alaska Native population 15 years and over
Males 55.7% Never married41.1% Now married0.0% Separated0.0% Widowed3.2% DivorcedFemales 39.2% Never married55.1% Now married3.7% Separated2.0% Widowed0.0% DivorcedWomen who gave birth in the past 12 months Now married:
0.0% (0)Unmarried:
100.0% (1)
Women who did not give birth in the past 12 months Now married:
52.0% (122)Unmarried:
48.0% (112)
Marital status - Asian population 15 years and over
Males 54.5% Never married38.9% Now married0.0% Separated0.9% Widowed5.7% DivorcedFemales 37.0% Never married50.7% Now married2.1% Separated8.6% Widowed1.7% DivorcedWomen who gave birth in the past 12 months Now married:
100.0% (4)Unmarried:
0.0% (0)
Women who did not give birth in the past 12 months Now married:
40.4% (188)Unmarried:
59.6% (277)
Marital status - Other race population 15 years and over
Males 26.2% Never married65.9% Now married3.1% Separated0.0% Widowed4.8% DivorcedFemales 37.9% Never married40.5% Now married1.5% Separated7.0% Widowed13.2% DivorcedWomen who gave birth in the past 12 months Now married:
20.3% (32)Unmarried:
79.7% (127)
Women who did not give birth in the past 12 months Now married:
41.1% (838)Unmarried:
58.9% (1,203)
Marital status - Two or more races population 15 years and over
Males 41.8% Never married49.1% Now married0.0% Separated0.0% Widowed9.1% DivorcedFemales 33.0% Never married52.0% Now married1.9% Separated6.2% Widowed6.8% DivorcedWomen who gave birth in the past 12 months Now married:
100.0% (33)Unmarried:
0.0% (0)
Women who did not give birth in the past 12 months Now married:
44.0% (376)Unmarried:
56.0% (479)
Marital status - White alone, not Hispanic / Latino population 15 years and over
Males 30.9% Never married53.0% Now married1.5% Separated2.7% Widowed12.0% DivorcedFemales 17.5% Never married49.2% Now married1.6% Separated12.8% Widowed18.7% DivorcedWomen who gave birth in the past 12 months Now married:
79.9% (157)Unmarried:
20.1% (40)
Women who did not give birth in the past 12 months Now married:
51.5% (1,693)Unmarried:
48.5% (1,592)
Marital status - Hispanic or Latino population 15 years and over
Males 38.9% Never married52.8% Now married1.5% Separated0.0% Widowed6.7% DivorcedFemales 42.2% Never married42.1% Now married2.2% Separated5.2% Widowed8.3% DivorcedWomen who gave birth in the past 12 months Now married:
36.9% (82)Unmarried:
63.1% (139)
Women who did not give birth in the past 12 months Now married:
39.8% (1,234)Unmarried:
60.2% (1,866)
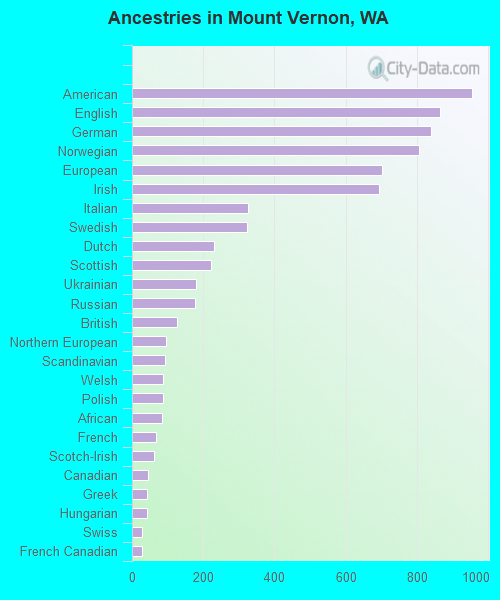
Ancestries in Mount Vernon
955 5.3% American864 4.8% English840 4.7% German806 4.5% Norwegian702 3.9% European694 3.9% Irish326 1.8% Italian324 1.8% Swedish229 1.3% Dutch221 1.2% Scottish179 1.0% Ukrainian176 1.0% Russian125 0.7% British96 0.5% Northern European93 0.5% Scandinavian88 0.5% Welsh86 0.5% Polish85 0.5% African67 0.4% French63 0.4% Scotch-Irish46 0.3% Canadian43 0.2% Greek42 0.2% Hungarian29 0.2% Swiss28 0.2% French Canadian28 0.2% Czech26 0.1% Palestinian21 0.1% Maltese20 0.1% Danish17 0.10% Bulgarian17 0.10% Finnish17 0.10% Croatian15 0.08% Iranian15 0.08% Slovene13 0.07% Celtic11 0.06% Eastern European10 0.06% Australian9 0.05% Austrian9 0.05% Belgian4 0.02% Portuguese
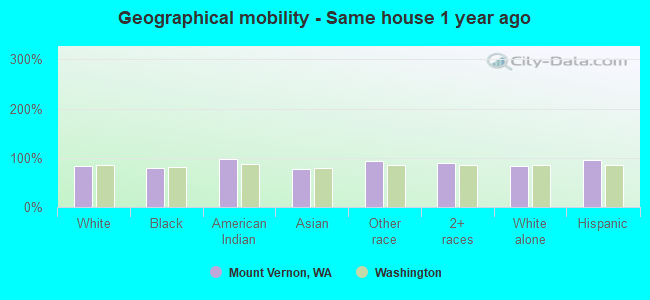
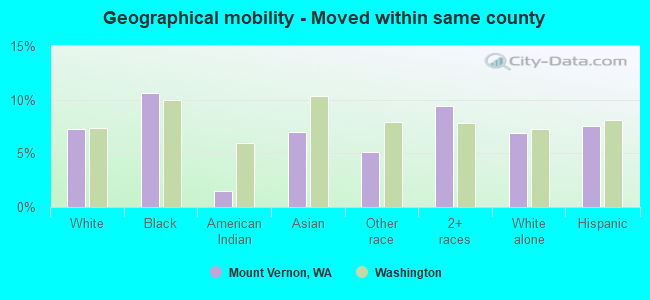
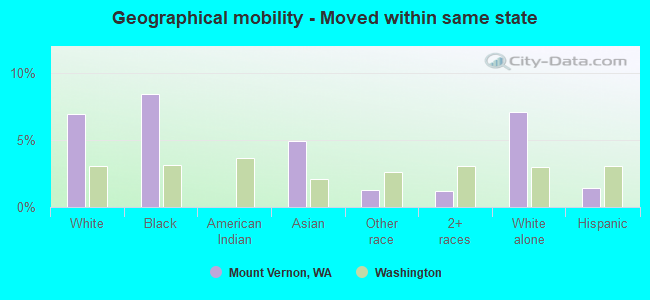
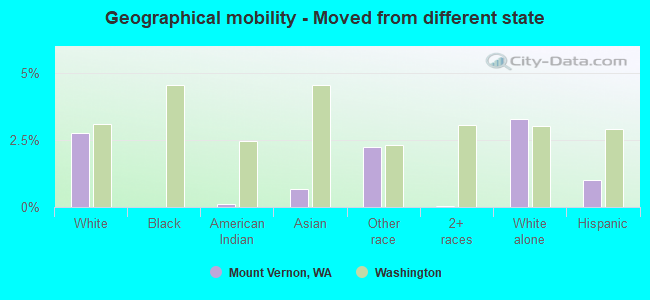
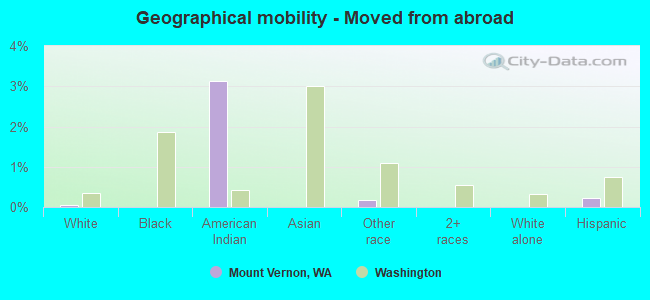
Geographical mobility in Mount Vernon Same house 1 year ago 18,368 82.6% White (Caucasian)303 79.9% Black or African American870 97.6% American Indian / Alaska Native933 76.5% Asian6,747 92.6% Other race3,145 88.7% Two or more races16,094 82.7% White alone, not Hispanic / Latino12,220 95.3% Hispanic or LatinoMoved within same county 1,625 7.3% White / Caucasian40 10.6% Black or African American13 1.5% American Indian / Alaska Native85 6.9% Asian377 5.2% Other race334 9.4% Two or more races1,345 6.9% White alone, not Hispanic / Latino966 7.5% Hispanic or LatinoMoved within same state 1,539 6.9% White / Caucasian32 8.4% Black or African American60 5.0% Asian91 1.3% Other race43 1.2% Two or more races1,375 7.1% White alone, not Hispanic / Latino179 1.4% Hispanic or LatinoMoved from different state 610 2.7% White / Caucasian1 0.1% American Indian / Alaska Native8 0.7% Asian163 2.2% Other race2 0.0% Two or more races637 3.3% White alone, not Hispanic / Latino128 1.0% Hispanic or LatinoMoved from abroad 11 0.0% White28 3.1% American Indian / Alaska Native13 0.2% Other race29 0.2% Hispanic or Latino
Children Nativity (place of birth) in Mount Vernon
Children under 6 years - Living with two parents Both parents native 666 100.0% NativeBoth parents foreign-born 257 96.3% Native10 3.7% Foreign-bornOne native, one foreign-born parent 431 100.0% NativeChildren under 6 years - Living with one parent Native parent 715 100.0% NativeForeign-born parent 278 100.0% NativeChildren 6 to 17 years - Living with two parents Both parents native 1,284 99.3% Native9 0.7% Foreign-bornBoth parents foreign-born 1,024 99.3% Native8 0.7% Foreign-bornOne native, one foreign-born parent 544 100.0% NativeChildren 6 to 17 years - Living with one parent Native parent 1,415 100.0% NativeForeign-born parent 907 51.1% Native868 48.9% Foreign-born
Grandparents responsible for own grandchildren in Mount Vernon
Grandparents (30 to 59 years) White / Caucasian 236 41.5% Responsible for grandchildren333 58.5% Not responsible for grandchildrenAmerican Indian / Alaska Native 20 100.0% Not responsible for grandchildrenAsian 28 100.0% Not responsible for grandchildrenOther race 17 4.6% Responsible for grandchildren348 95.4% Not responsible for grandchildrenTwo or more races 11 100.0% Not responsible for grandchildrenWhite alone, not Hispanic / Latino 257 53.1% Responsible for grandchildren227 46.9% Not responsible for grandchildrenHispanic or Latino 70 16.2% Responsible for grandchildren362 83.8% Not responsible for grandchildrenGrandparents (60 years and over) White / Caucasian 245 54.1% Responsible for grandchildren208 45.9% Not responsible for grandchildrenAsian 14 100.0% Not responsible for grandchildrenOther race 80 100.0% Not responsible for grandchildrenWhite alone, not Hispanic / Latino 245 57.7% Responsible for grandchildren180 42.3% Not responsible for grandchildrenHispanic or Latino 118 100.0% Not responsible for grandchildren